 MetaTrader 5
 专家
专家
 指标
指标
 程序库
程序库
 实用工具
实用工具
 窗口小部件
窗口小部件
 规则
规则
适用于MetaTrader 5的新EA交易和指标 - 431
 使用EA交易和指标,使外汇交易获得更多盈利。EA交易可使您自动开启和关闭交易,而指标将帮助您更准确地预测市场行为。
该页面提供MetaTrader 5应用程序的目录。
使用EA交易和指标,使外汇交易获得更多盈利。EA交易可使您自动开启和关闭交易,而指标将帮助您更准确地预测市场行为。
该页面提供MetaTrader 5应用程序的目录。 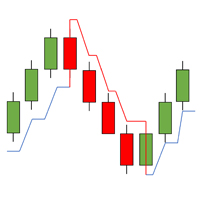
The TrendLinePro indicator for MetaTrader 5 creates a trend line based on the last candle highs and lows. The number of candles to be used to determine the direction can be selected yourself. The trend line can also be used to set an SL. Changes in trend directions can optionally be displayed with an arrow. Input Parameters: Number of Candles for Distance: 3 Display Direction Changes Arrows: false
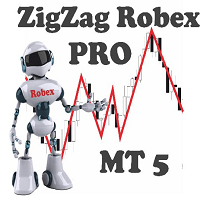
Intelligent ZigZag indicator.
It has only two settings. The higher the values, the more significant extreme values it shows.
Application area.
To determine the trend. Line drawing direction.
To recognize multiple patterns.
If you put two indicators on one chart with fast and slow values. By changing the color of one of them, you can very well decompose the price movement into waves.
The indicator can be a great helper for marking the chart and identifying the key levels from which the pri
Add an image or logo on a chart. Parameters: "File name for On mode" - location of image file depending MQL5 folder. "Background object" - set the logo as a background object. “x”, “y” – coordinates on the chart, from which the logo shows. If you want to delete the logo, just remove ea from the chart. The suggested resolution for the image is 200x200 pixels. You can use this ea while recording a video.
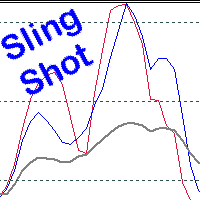
Scalping, Mean reversion or Position trading strategy
Get into an established trend on a pullback in the market. Use the Pinch in the indicator for profit taking. Use the Pinch as a mean reversion strategy, scalping back to a moving average line.
Input Parameters Fast Sling Shot configuration. Slow Sling Shot configuration. Dual Sling Shot configuration. Price line configuration. Trigger zones or levels. Example of Sling Shot trade idea: Price line sets the mood, below the baseline level (50)
The EA open sell positions on Tuesday only with maximum of 8 positions allowed. The EA risks 2 USD to make 10 USD depending on your account balance. As your account balance increases the risks and reward also increases. It works best on GBPUSD and USDCHF chart on weekly timeframe. Run the EA on both charts on the same account concurrently. Why use this EA? Robots are much better at multi-tasking than humans, so using an automated system allows traders to have multiple conditions for things lik

PropAngel EA is a manager EA to help you to pass proprietary firm challenges and evaluations and to keep your funded accounts. PropAngel EA makes sure you do not breach daily drawdown limit which gives you change to continue trading the account and recover from the drawdown. PropAngel EA makes sure that at the moment you have reached your challenge, evaluation or scaling target all trading will be immediately stopped. This is done to prevent account falling away from the target. PropAngel EA giv
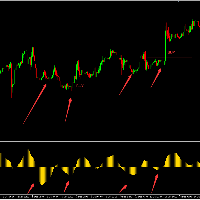
SQZ使用了自适应算法,能够很好的根据市场自我调整,如果你学习过机器学习的入门模型,应该了解线性回归模型,它能够很好的预测短期趋势,当然这只是SQZ指标的一部分。这是一个用于识别短期趋势反转的指标,能够非常好的用于追踪起爆点。当价格出现HH(更高的高点),指标出现LH(更低的高点)的时候,出现结构下破做空。当价格出现LL(更低的低点),指标出现HL(更高的低点)的时候,出现结构上破做多。另外,零轴上方代表多头,下方代表空头。如截图所示,在一个多头趋势中,我们等待指标价格出现背离,入场做多,止损设置在最新低点的下方+1-2个ATR值,你必须要警惕价格机构可能会利用你过窄的止损来获取流动性。同理,在一个空头趋势中我们等待出现双顶入场做空。在多头持有过程中,如果指标一直在0轴上方运行,我们可以继续持有,直到趋势动能减弱。

HAP_Trend EA is based on detection of Trendline algorithm and pending position strategy to EURUSD in M5 timeframe. I have developed HAP_Trend EA during 2022 and I have finished it at the end of 2022. I have been using HAP_Trend EA on REAL MONEY TEST since the beginning of 2023. As you may know real database and demo database are not exactly same, I have tested it on real account and it works on real account. Using HAP_Trend EA in your account is very easy: drag and drop on eurusd M5, then you w
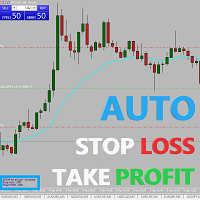
Easy and simple Automatic Stop Loss and Take Profit manager.
For all pairs, indexes etc. Works with all instruments.
All types of orders. All charts.
Users inputs:
- take profit in pp
- stop loss in pp
- font name,size and color
- corner for place settings info
Save & Load settings option.
Fast, simple and reliable trade assistant.
A "MUST HAVE" for all traders.
Check out other tools provided by our team!
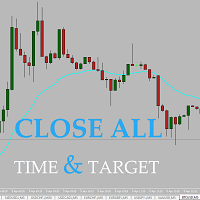
Easy and simple tool which close all trades in defined point of time. It can also close all open trades when opened positions reach defined target profit or stop loss.
For all pairs, indexes etc. Works with all instruments.
All types of orders. All charts.
Users inputs:
- close time (hour,min,sec)
- take profit (in users currency)
- stop loss (in users currency)
Save & Load settings option.
Fast, simple and reliable.
Check out other tools provided by our team!
FREE
This indicator shows both GMT time and your broker's time on the chart.
Simply attach the indicator to a chart, and you will see the GMT time and your broker's time displayed in the top left corner, as shown in the screenshot. By using this indicator, you can always stay informed about your broker's time, which is especially useful during daylight saving changes.
You won't have to worry about whether your broker follows the US or EU schedule, as the indicator automatically adjusts to reflect any
FREE

TrendFollowing is an multi-currency scanner that just indicates where to buy/sell: Abilities: Opens up the chart automatically with and arrow indicating where to take action. Send the signal to a telegram channel, see @fx_signal_com channel to get the idea. Configuration: No need to configure "Market Watch". Open a chart and attach the scanner to it. Trading Rules: Use only buystop/sellstop orders above/below arrow on the chart. Delete the pending order if price retraces below/above the moving
FREE
My Expert Advisor trade Gold (XAUUSD) on M1,M5 time frame, Base on RSI indicator, hedging strategy. stop loss 0.25 usd/0.01 lot take profit 3.9 usd/0.01 lot Recommend broker: Tickmill, 3 digit broker, stoploss = 25; takeprofit = 390 Min deposit: from 500 usd - From 500 usd to 40,000 usd after more than 01 year. (backtest) Input Setting to test my EA: - Stoploss: 0.25 usd/0.01 lot (adjust to the correct ratio and do not change) - Takeprofit: 3.9 usd/0.01 lot ( adjust to the correct

You can use an expert advisor or a trading tool called a "forex robot" to carry out trades in your absence. These tools enable you to make trades while you're working, asleep, or doing other things. Like other artificial intelligence platforms, they have some benefits and issues that you should be aware of.
If you're prone to trade when your emotions get the better of you, an EA removes that factor from your trading. If you use an EA, your fears and drive for more profit won't affect your choic
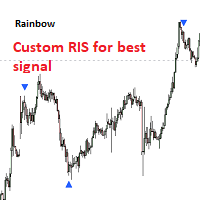
Slopes are an increasingly key concept in Technical Analysis. The most basic type is to calculate them on the prices, but also on technical indicators such as moving averages and the RSI.
In technical analysis, you generally use the RSI to detect imminent reversal moves within a range. In the case of the Blue indicator, we are calculating the slope of the market price and then calculating the RSI of that slope in order to detect instances of reversal.
The Blue indicator is therefore used as

If you are using naked eyes to find candlestick patterns on your chart it's a good thing but it requires your time and attention and still you miss some patterns here and there. Don't worry! This indicator will help you to find "Harami Candlestick Pattern" on your chart very easily. *Note: Default inputs are set for EURUSD H1 (1 hour) timeframe. This is an alert system which gives you alerts whenever harami candlestick pattern happens. Types of alerts it can give you are: 1. Audible Alerts - Thi

Super Scalp Indicator MT5 is a unique trend reversal 100% non-repainting multi-algo indicator that can be used on all symbols/instruments: forex, commodities, cryptocurrencies, indices, stocks . Super Scalp Indicator MT5 will determine the current trend at its early stages, gathering information and data from up to 10 standard algos When indicator give a valid buy or sell signal, a corresponding arrow will be printed on the chart, open trade at start of the next candle/bar indic

Scalper Pivot detects respectable small reversal areas that can be used to mark repeatable opportunity windows. For M1 timeframe. Setup/inputs: First, set one pip on price, e.g. EURUSD to 0.0001, USDJPY to 0.01, or XAUUSD to 0.1. Or select AUTO for autodetect common symbols. Set minimum and maximum range on pips, if you want scalp between 10 to 20 pips then set it to 10 and 20 respectively. Set detection window to any candle count you want. Set it too low or too high would be less accurate.
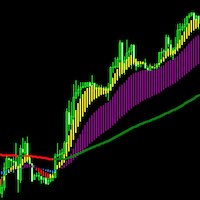
HighQualityMap是一个很好的中长线交易指示器,这个指标可以单独使用,尤其是用在M30或者大于M30的时间框架下,它能很好的体现出趋势的走向,以及转折点,你可以很快的从这个指示器上寻找到最佳的buy和sell位置,同时也能很好根据指示器去坚守自己的持仓定订单。指标不含有未来函数,不会重新绘制,不仅能够应用到自己的手动交易过程中,还能完全可以写入到自己的EA中。(如果你感觉到这个指标能够帮助你进行更准确的交易,请帮忙给个好评,希望我的作品能够帮助更多有需要的人) ===================参数列表===================== 所有参数均采用默认参数即可,无需更改,若为激进型交易者,可以根据自己的需要来调整参数。 =================参考使用方法=================== 此指标可以适用于任何交易品种,使用周期框架大于M30相对更准确。
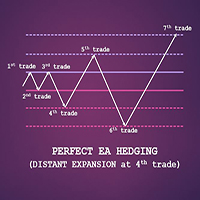
Hedging was known as "100% Winning Strategy" in many decade before. But it doesn't seem right in the side-way market. If you put Hedging distant too close, it will entry as more as the side-way stay. If you put Hedging distant too far, it would never hit the BEP before the account blown.
So, now "EA by CAPO" brought to you the new generation of Hedging that help user avoid the Risk from side-way market. We let the EA observe first 3trades with the same distant and it increase the distant at 4th

TrendFollowing is an multi-currency scanner that just indicates where to buy/sell: Abilities: Opens up the chart automatically with and arrow indicating where to take action. Send the signal to a telegram channel, see @fx_signal_com channel to get the idea. Configuration: Configure "Market Watch" with all the symbol you like to trade. Open a chart and attach the scanner to it. Trading Rules: Use only buystop/sellstop orders above/below arrow on the chart Delete the pending order if price retrac

Epicentrum EA is built with the latest innovation Support and Resistent algorithm. Application of Neural Network to study the characteristics of the pairs being played. Merging sophisticated algorithms with neural network produces quality position entries. EA will open and close the trade on Support and Resistent Zone You Can Using Default Setting and running on EURUSD, GBPUSD, USDJPY, USDCAD pairs, Timeframes : 1 min
"It works best on EURUSD, GBPUSD, USDJPY, USDCAD Pairs, How About Stoplos

ABOUT LWANDLE V3 This EA is the scalping and price action EA which is very good on trading in binary.com best results where achieved on JUMP 10 AND VIX 75 (1S)
BEST TIMEFRAME M1 TIMEFRAME AND USE PERIOD M15 for candle momentum, it is very rare to reach 0.32 lot when martingaling. only one trade at the time while produce nice results. HOW TO SET UP THE EA Take Profit must be higher than the Stop Loss trailing stop must be equal with SL recommended broker trailing step must be almost equal with
Grid trading Strategy
A very safe and profitable strategy based on dividing the chart to horizontal grids
and based on market direction (Bullish/Bearish) open buy or sell when the price touches each grid line.
Grid distance will be calculated based on percentage of price. That way this EA can be used for any type of market. trade a list of given pairs at the same time on a single account and apply risk management rule for all of them

This EA will be sold only to ten people. When more people and more money follow a strategy, the strategy can stop working faster. To protect our market hedge, we will sell this strategy only to ten people with a maximum of five activations per person.
Strategy Performance Overview and Recommendations:
GameChanger EA is a grid strategy designed to produce steady profits and withstand heavy drawdowns. It has proven its profitability over 10+ years of historical data. As traders, we suggest usi
您想在 Deriv.com 上安全、快速、有效地进行交易吗? 您是否尝试过各种策略但没有找到合适的策略? 别担心,我们有办法! RtcDERIV 是专为 Deriv.com 设计的最新智能交易系统,它结合了剥头皮和 mar 策略,在过去一年中成功获得了超过 10,000% 的利润。
RtcDERIV 的优势之一是它在 Volatility Index 上的使用,尤其是 Volatility Index 25,目前确实非常好。 在 Deriv 上交易还具有 7x24 无休假的优势,因此您可以随时最大化利润。
RtcDERIV 已在 Metatrader 5 Deriv 平台上运行,默认设置为 0.5 手,足以以 500 美元开始交易。 但是,为了您的安全,我们建议您从 1000 美元开始。 回撤率低至 1.75% 左右,您可以在交易中感到更安全。
我们对 RtcDERIV 进行了一年多的回测,结果令人印象深刻。 一年之内,我们仅用500美元的资金就取得了超过10,000%的利润! 这证明了我们的策略是多么有效。 查看我们所做的回测组合,您也可以在提供的演示试用版中进行。
现在,
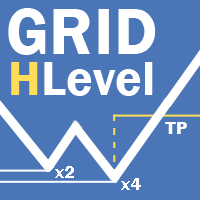
Dual Striker —— 全新黄金交易EA。 真实信号 +150% -> 真实账户 无马丁格尔策略,无加仓摊平 在您的交易终端中免费测试: Dual Striker EA Grid HLevel Expert Advisor 非常適合那些希望每月在外匯市場上獲得穩定利潤的交易者。 Expert Advisor 根據平均策略工作,我建議您正確使用它。 “ 正確 ” 使用它意味著以市場反轉點的平均數開倉 , 並且僅在全球趨勢的方向上交易。 至於主要趨勢的方向 , 我建議通過時間框架 H4 上的 Valable ZigZag 指標來確定。 指標更難確定市場可能發生變化的水平 , 因此我建議交易者在圖表上手動設置它們 , 以便使用平均訂單更準確地進入市場。
因此 , 我想向您介紹 Grid HLevel Expert Advisor - 一種以手動設置的支撐和阻力水平進行交易的 Expert Advisor 。 注意力 !!! Grid HLevel EA 不是全自動的 , 而是半自動的。 所以不要指望你把它
FREE

The strategy for this expert advisor works more effectively only if you set buy only or sell only,the most important part I took into consideration are the main market turning points.You would want to say reversals or change in direction in trends,the key to making profitable trades with this advisor is to set your stop loss on the previous high for sell only signal and previous low for buy positions ,This advisor can trade any Market,but mainly was developed for Boom and Crash,vix75 and Jump 25
FREE

MiloBot PRO 是一个先进的外汇专家顾问,基于一个独特的专有策略 它已经被开发、测试和优化了2年多的时间。该策略的可靠性在于,开发商的真实账户的存款总额超过10万美元。 独特的MiloBot PRO策略允许每个月获得稳定的利润,自定义指标允许EA在市场反转时刻尽可能精确地进入市场。 查看开发商当前的实时信号: 2019 年 11 月以来的账户(利润超过 +1520%): myfxbook.com/members/Malik87/robot-advisor-launched-november-11/3623023 Mql5 Signal : https://www.mql5.com/zh/signals/2379641
我們個人使用 MiloBot Pro 進行交易,因此我們不斷測試它,在 EA 中實施一些新的東西。 所有買家都將收到更新並使用最新和最可靠的顧問版本。 我叫 Sergey Ermolov ,是 MiloBot PRO 顧問開發團隊的負責人。 我只相信數字,而數字表明: 我们的MiloBot PRO专家顾问让你的年收益高达103%,包括资本重组

节省时间并做出更明智的决策,使用锚定的 Sweet VWAP 如果您想测试这个工具的威力,您可以下载 MetaTrader 5 的锚定 VWAP 免费指标 。 除了这个指标可以独立工作外,它还是 Sweet VWAP 免费版本的一个扩展。 这是因为当您点击免费版本时,您在鼠标指针上看到的那个 VWAP 将被固定。为了更好地理解,固定在那里的是这个指标,具有其所有功能。 此指标与 Sweet VWAP 完全集成,这是 MetaTrader 5 的免费锚定 VWAP 指标。 功能 固定时间 这是您想要锚定 VWAP 的蜡烛。这是由 Sweet VWAP(免费版本)自动完成的,只需单击图表即可。 交易量类型 您可以选择交易量类型,也可以将其保持自动。自动表示它将使用交易资产的实际交易量作为优先级,前提是经纪商提供此信息。 VWAP 平滑方法 简单: 这是 VWAP 的标准计算,即价格加权交易量。 指数: 第一个变体。使用此计算,VWAP 对最新价格赋予更大的权重。如果您觉得市场刚刚形成了一个新的底部/顶部,这非常有用。然后,您检查在形成底部/顶部的蜡烛中形成的 AVWAP,并且在接下来的顶部
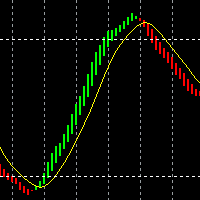
这是一个清晰的判断顶部和底部的指标,用于盘整有很好的效果。
促销价 49$ → 59$
特点 很好的判断顶部和底部 不重绘,不漂移 快速计算,不卡 丰富的提醒模式 多个参数和颜色可调整
参数 "======== Main ========" HighLowPeriod1 = 9 HighLowPeriod2 = 60 HighLowPeriod3 = 34 HighLowEMAPeriod = 4 MASignalPeriod = 5 "======== Notify ========" UseAlertNotify = true; UseMetaQuotesIDNotify = true; UseMailNotify = true; NotifySignalMode = Change Color and Check Level; HighLevel = 80; LowLevel

请仅针对以下 7 种货币对设置 Slick Extractor 交易机器人:EURUSD、GBPUSD、GBPAUD、USDCHF、USDJPY、CADCHF 和 CADJPY。
图表上的交易时间范围应严格为 4 小时 (H4)。
请将输入设置中的“Auto lot size”更改为“True”,这非常重要,这将使 EA 计算每笔交易的最佳手数,这样 EA 的风险就不会超过默认的 2%每笔交易的净值。如果自动手数保持为假,则每个货币对的默认手数为最小手数 (0.01)。
要增加自动计算的手数,只需将“每笔交易的风险”增加到不超过 6% (0.06) 以实现良好的风险管理。每笔交易的风险以权益的百分比表示,例如默认值为权益的 2% (0.02)。此处应格外小心。
在输入设置中调整时差以匹配您经纪商的交易时间。例如,由于时区差异,如果您的经纪人的时间比本地计算机或机器人将运行的 VPS 早 2 小时,则将“时间差异”更改为 2。如果您的经纪人的时间比本地计算机或 VPS 晚 2 小时机器人将运行的 VPS,然后将“时差”更改为 -2。这非常重要,如果做得不正确,可能会降低机器人的

您必须有兴趣制作自己的专家和优化。 这不带有设置文件。 增强您自己的交易能力,利用基因优化测试仪的力量。
Alpha Generation 使用一组技术指标,包括 Awesome Oscillator、Bulls Power、Commodity Channel Index、Envelopes、Moving Average Convergence Divergence、Moving Average、Parabolic SAR、Relative Strength Index、Stochastic Oscillator 和 Williams Percent Range 来生成交易信号。
EA 还包括一个固定保证金资金管理系统,它根据账户余额的百分比确定头寸的大小。 该代码包括每个输入参数的详细注释,用户可以自定义这些注释以使 EA 适应他们的特定交易策略。 指标的不同组合可以产生无穷无尽的信号。
如何使用:
选择要执行的优化并在测试器中输入。 运行测试并在回溯测试和正向测试中查看结果。 将输入保存为设置文件。 在图表上加载 EA 并加载设置文件,就这样,您成为了专家。

利用 Nadaraya Watson Envelope MT5 的潜力来提升您的交易策略,这是一种创新指标,旨在为交易者提供精确的趋势分析和动态支撑与阻力水平。非常适合 forex、商品和加密货币交易者,这个工具增强了决策能力和识别市场反转及趋势延续的准确性。 Nadaraya Watson Envelope MT5 的独特之处在于利用先进的高斯核平滑技术创建自适应包络带,以响应市场波动。这使得交易者能够自信地捕捉关键价格波动,无论是快速获利的剥头皮交易还是长期持有的仓位。 MQL 产品安装指南 | 在 MT5 上更新购买的 MQL 产品 | 常见故障排除指南 | 指标设置 / 指南 主要特点 缓冲区集成:将指标值暴露为可访问的缓冲区,以便进行基于信号的自动交易,使 Expert Advisor 能够有效利用数据。 快速且可回测:基于 MetaTrader 的本地 OnCalculate() 引擎进行快速计算,确保与策略测试器的兼容性,以进行历史分析。 弹出警报:在信号事件上触发 MetaTrader 警报弹出窗口,确保您不会错过任何交易机会。 推送通知:实时推送通知直接发送到您的 M
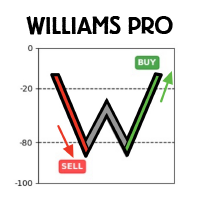
Williams pro 是专为市场设计的自动交易系统,建立在健全的交易原则基础上。 与许多其他交易系统不同,它不依赖于网格系统或鞅策略,这通常会导致高风险且不可预测的交易。 相反,该算法使用高度可靠和有效的技术指标来衡量市场动能并帮助识别潜在的买卖机会。 交易算法使用 Williams % R 指标进行精确入场,将指数移动平均线应用于高价和低价,并使用平均真实范围进行及时退出。 如果交易朝着正确的方向发展,算法将修改止损以达到收支平衡。 我建议在 USDJPY M30 上使用此交易机器人,但当然它也可以用于其他高动量工具和其他时间范围。 显示的回测是在 2019 年至 2023 年对 USDJPY M30 进行的。回测反映了默认参数。
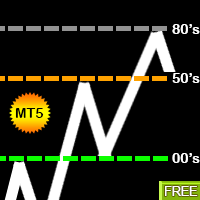
Multi-Timeframe Psychological Price Levels Indicator Trade with Confidence. Identify Key Market Levels Instantly. The Multi-Timeframe Psychological Price Levels Indicator is an advanced trading tool designed to automatically detect and display the market's most influential psychological price levels across multiple timeframes. These critical levels often act as powerful zones of support, resistance, breakout, and reversal where institutional and retail traders naturally focus their attention. U

介绍 RSIScalperPro - 这款基于 RSI 指标的革命性交易指标适用于 MetaTrader 5,专为一分钟图表的剖刺交易而设计。借助 RSIScalperPro,您将拥有一个强大的工具箱,用于精确的入场和出场信号,提升您的交易水平。 RSIScalperPro 使用两种不同的 RSI 指标,为超买和超卖区域提供清晰的信号。您可以根据自己的偏好自定义两个 RSI 的时间周期和限制值,以实现您的交易策略的最佳效果。图表上的明显箭头使您可以轻松识别何时进入或退出交易。 RSIScalperPro 的另一个亮点是三个可自定义的移动平均线,帮助您识别趋势方向并确认强大的交易信号。这使您可以早早发现趋势并参与到盈利交易中。 此外,您可以设置 RSIScalperPro 发出每个新交易信号的听觉警报。这样,即使您不经常坐在计算机屏幕前,也不会错过任何重要的交易机会。 RSIScalperPro 提供用户友好的界面,并且在 MetaTrader 5 中很容易插入和配置。您可以根据个人交易偏好自定义指标,并利用其多样化的功能,提高交易成果。 利用 RSIScalperPro 的优势,提高

ItradePeriod is an advanced and highly customizable trading software that allows traders to automate their trading strategies with ease. With ItradePeriod, traders can execute trades using six different strategies that can be customized to fit their specific trading style. The software features a unique scheduling system that allows traders to schedule trades at specific times, ensuring maximum efficiency and profitability. Each strategy can be customized with a range of trades management option
Trading assistant that offers advanced management of your trades with optimization features. It automatically calculates the risk per trade, makes it easy to set up new orders, and offers advanced management tools such as automatic trade closing in 5 different ways. It also has other useful features that will improve your control and decision making. And best of all, you can use it in the strategy tester to perfect your tactics before trading live!
Our trading assistant is a trading tool that

Here is a powerful trading tool that will allow you to trade manually or automatically in any market, but is especially useful in markets with high volatility and liquidity.
This system has two EAs (Expert Advisors): one for Buy and one for Sell, which work independently. The operation is based on the hedging strategy and the increase in lots based on the Fibonacci sequence, which will allow you to always add the two previous lots: 1, 2, 3, 5, 8, 13...
You decide how you want to trade: you ca

Are you looking for a cool expert where you can manage your orders easily and fast? I have good news because by using Rapid Trade Manager you can: calculate the risk per trade (percentage or fixed amount) manage your open orders individually choose from a variety of features such as: Take Profit, Partial Close, Stop Loss, Trailing Stop, Break Even, Close All and Close Order. Note! Doesn't work in the Strategy Tester If you are interested check out my videos for more. More info about the Rap
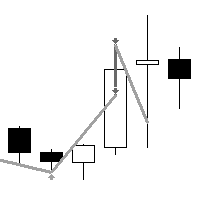
"AV BuyLow SellHigh EA" is an Expert Advisor for MetaTrader 5, which was created from the simple "AV Preview".
The original idea was to buy lower and sell higher from the last entry price. On request, I have developed it further and tried to remove its trend weakness. This EA is only the Minlot version to try out.
Strategy:
The size of a displayed rectangle is used to decide whether range trading is to be carried out (sell above, buy below) or trend trading (buy on rising, continue selling o
FREE
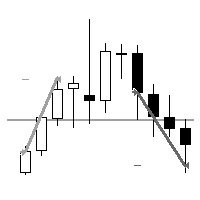
"AV Level EA MT5" is an Expert Advisor for the MetaTrader 5, which is intended exclusively for the german DAX (DE40, GE40, etc.) and is also available as a free version with MinLot to try out.
NEW: More ways to close, third entry.
Strategy:
- Level Trading, DAX M15 (also M5 or M30)
- Entry: Buy level 75, sell level 25
- Exits: TP = 25 (i.e. approx. 00 level) or TP = 50 (buy 75 level, sell 25 level)
- Second entry in the event of a reset, distance e.g. 25 or 50 (it does not take place with
FREE
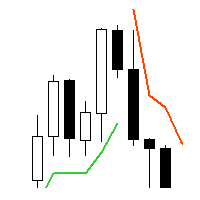
"AV SuperTrend EA MT5" is an expert advisor for MetaTrader 5, which uses the change in the SuperTrend as an entry, can trail the positions on the SuperTrend line and automatically closes the positions when the trend changes. Only one position is opened at a time. Depending on the setting, there is always a position open.
An SMA can be used as a filter: above the SMA only long entries, below the SMA only short entries.
The supertrend advisor is particularly suitable for trendy markets. In the r
Introducing "Congestion Breakout MT5" - the indicator that helps you identify congestion zones in your chart and alerts you when the price breaks through them. Traders know that congestion zones can be key areas of price action and can indicate potential turning points in the market. However, spotting these zones and anticipating breakouts can be a difficult and time-consuming task. That's where "Congestion Breakout" comes in. This powerful indicator uses advanced algorithms to analyze the pri
"AV BuyLow SellHigh EA Full" is an Expert Advisor for MetaTrader 5, which was created from the simple "AV Preview".
The original idea was to buy lower and sell higher from the last entry price. On request, I have developed it further and tried to remove its trend weakness. This EA has more settings than the free Minlot version.
Strategy:
The size of a displayed rectangle is used to decide whether range trading is to be carried out (sell above, buy below) or trend trading (buy on rising, cont

This Rocket Breakout Strategy for NASDAQ index is a trading strategy that focuses on breakouts from a range based on previous days, using a volatility filter to identify pre-breakout situations and a trend filter. This strategy employs a stop loss and profit target approach to manage risk, with higher profit targets for long entries and lower for short entries. The strategy also includes an end-of-week exit to avoid exposure to weekend news events. Percentage-based position sizing is used for

Indicator ICT Implied Fair Value Gap (IFVG) is an important part of the Smart Money Concepts (SMC) system. It looks for and shows on the chart a modern pattern - the Fair Value Gap ( FVG ). This pattern is a three candlestick imbalance formation based on the discovery of a mismatch between supply and demand. This happens when the price moves quickly in one direction without encountering resistance. The result is a "gap", which can be filled in later. The indicator finds this pattern using the up

The Breakout Trading Strategy "Turtle" is a trading strategy that enters into a position when long period highs or lows are broken and exits the position when short period highs or lows are broken. This strategy aims to capitalize on significant price movements that break through established support or resistance levels. The long period highs and lows serve as a signal for a potential breakout, while the short period highs and lows serve as a signal to exit the position before the momentum fades
"AV Level EA MT5 Full" is an Expert Advisor for the MetaTrader 5, which is intended exclusively for the german DAX (DE40, GE40, etc.) and is also available as a free version with MinLot to try out.
NEW: More ways to close, third entry, MagicNr adjustable.
Strategy:
- Level Trading, DAX M15 (also M5 or M30)
- Entry: Buy level 75, sell level 25
- Exits: TP = 25 (i.e. approx. 00 level) or TP = 50 (buy 75 level, sell 25 level)
- Second entry in the event of a reset, distance e.g. 25 or 50 (it
Please send me Direct message on MQL5 CHAT after purchasing the Indicator for Training and Installation Support There are some additional files that is important to use with the Indicator . So be sure to contact me after purchasing the Indicator So that I can add you for training and support .
If you find any difficulty with installation then send me Direct message here So that I can connect with you via Anydesk or Teamview for the product installation. " Smart Order Block Indicator " to find m

You can change the time period of the chart at the touch of a button. You can also change multiple charts at the touch of a button. You can also change multiple charts at the touch of a button, saving you the trouble of changing time periods.
We are live-streaming the actual operation of the system. Please check for yourself if it is usable. Please check it out for yourself. https://www.youtube.com/@ganesha_forex
We do not guarantee your investment results. Investments should be made at you
AutoScroll automatically scrolls the chart by the set width (pips). You can see the next milestone without having to operate the chart yourself. You can concentrate on trading.
We are live-streaming the actual operation of the system. Please check for yourself if it is usable. Please check it out for yourself. https://www.youtube.com/@ganesha_forex
We do not guarantee your investment results. Investments should be made at your own risk. We sharll not be liable for any disadvantage or damage c
The time until the end of the bar is counted down. Therefore, you can time your order while watching the chart. You can concentrate on your trading.
We are live-streaming the actual operation of the system. Please check for yourself if it is usable. Please check it out for yourself. https://www.youtube.com/@ganesha_forex
We do not guarantee your investment results. Investments should be made at your own risk. We sharll not be liable for any disadvantage or damage caused by the use of the info
Fibonacci automatically draws Fibonacci retracement, Because Fibonacci automatically draws Fibonacci retracement, you can know at a glance the price to buy at a push or sell back. Therefore, you can trade in favorable conditions in a trending market.
We are live-streaming the actual operation of the system. Please check for yourself if it is usable. Please check it out for yourself. https://www.youtube.com/@ganesha_forex
We do not guarantee your investment results. Investments should be made
The chart pattern is automatically drawn. It also automatically tells you the price at which you are most likely to buy or sell according to the pattern. Therefore, there is no need to memorize patterns or draw lines by yourself.
* The "WhaleFinder" includes four indicators ("DrawTurningPoint", "DrawHurdle", "DrawChartPattern", "DrawFibonacci"). so, Please be careful not to purchase more than one copy (duplicates).
We are live-streaming the actual operation of the system. Please check for yo
The system automatically draws resistance and support lines, The system automatically draws resistance and support lines, so you can see at a glance the price range where you are most likely to encounter resistance. Therefore, you can trade in price zones where you are less likely to encounter resistance.
We are live-streaming the actual operation of the system. Please check for yourself if it is usable. Please check it out for yourself. https://www.youtube.com/@ganesha_forex
We do not guaran
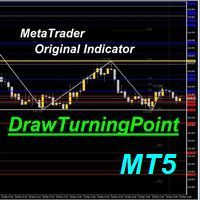
Based on the Dow Theory, the system automatically draws a turning point, which is the starting point for buying or selling. It also automatically tells you whether the market is in a buying or selling condition and recognizes the environment. It is also a good tool to prevent false trades and to make profitable trades.
We are live-streaming the actual operation of the system. Please check for yourself if it is usable. Please check it out for yourself. https://www.youtube.com/@ganesha_forex
We

A heatmap is a graphical representation of data in two dimensions, using colors to display different factors. Heatmaps are a helpful visual aid for viewers, enabling the quick dissemination of statistical or data-driven information. The MP Heatmap indicator provides a graphical representation of the relative strengths of major currencies compared to others, organizing data from pairs into color-coded results and producing a clear overview of the entire Forex market. The MP Heatmap indicator dis
FREE

The ATR indicator (Average True Range) is a tool used to measure market volatility. It can be used to develop a trading strategy that takes into account daily and weekly price volatility. Here are some key points about using ATR in a trading strategy: Volatility Assessment: ATR helps understand how much the price of an asset has changed in a given period compared to previous periods. This is useful for assessing the likelihood of a trend reversal. Order Setting: You can u

The Imbalance Market is a multi-pair, multi-order and multi-lot product. It is designed to operate on 4 pairs: EURUSD, GBPUSD, USDJPY and USDCHF, it is optimized and designed for these four values, not being recommended for use in others. You can use other robots on your platform, but I do not recommend that you use it in these pairs at the same time as this robot.
This system detects when the market is unbalanced and operates in favor of equilibrium, that is, it detects a pair's uneven movement
The NFX Crash 500 Bot, is an advanced Synthetics Trading bot! It is a tried and tested EA based on a proprietary trading strategy specifically designed and optimised for the Crash 500 Index . We have paired this with a custom multilayer neural network that constantly scans previous and present market conditions using over 120 different data points and can make fine adjustments to find better entries. It uses Technical Analysis, Statistical Data Analysis, and custom indicators to open trades. LIN

The FxCruiser trading robot is a highly advanced trading tool that utilizes artificial intelligence to accurately predict market movements. Designed specifically to trade in the EURUSD and GBPUSD markets, it boasts an exceptional rate of return that is unmatched by any other trading robot. With its unique features and unparalleled performance, FxCruiser has established itself as the top trading robot in the industry.
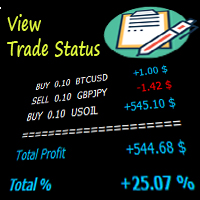
This indicator will help you have a better visualization of the status of your open trades. You can see profits or losses in USD or %, as well as a total of all trades and the percentage of profit or loss according to your account size. You can change the font size and color. I hope you find it useful and it makes monitoring your trades easier. This indicator adjusts to the size of your screen and will be positioned in the bottom right corner of your screen for better convenience.

Outside day trading strategy looks for a specific pattern in the price chart of a security.
The pattern is characterized by a larger range than the previous day, with the high of the day higher than the previous day's high and the low of the day lower than the previous day's low.
Works with many symbols, such as BTCUSD, GBPUSD,USDCAD, oil, gas, and others. PLEASE RATE! Thank you very much!
FEATURES:
- Real Strategy - Daily Bar Strategy - Exit the trade if the day was profitable - ATR multiple s
FREE

Copy trades with ease using the MetaTrader5 trade copier - the quickest and easiest way to copy transactions between different MetaTrader 5 accounts! This innovative tool allows you to locally copy trades in any direction and quantity, giving you full control over your investments.
Attention!
You need to download the Trade Copier Slave mq5 file as well to run this EA. Download it from here https://www.mql5.com/en/market/product/96541
Designed to work on both Windows PC and Windows VPS, this
FREE

H_ap_sp EA is based on detection of spike trading algorithm and pending position strategy to EURUSD in M5 timeframe. I have developed H_ap_sp EA during 2022 and I have finished it at the end of 2022. I have been using H_ap_sp EA on REAL MONEY TEST since the beginning of 2023. As you may know real database and demo database are not exactly same, I have tested it on real account and it works on real account. Using H_ap_sp EA in your account is very easy: drag and drop on eurusd M5, then you will
Indicator details The Moving Average Retracement Boundaries(M.A.R.B) shows the average retracement level above or below the given moving average.It shows the first upper boundary (which is the average retracement above the moving average ),the second upper boundary (which is double the first upper boundary),the first lower boundary (which is the average retracement below the moving average) and the second lower boundary (which is double the first lower boundary).
How to use it 1.It can be used
FREE

The euro index on your chart, built live from your own broker's five euro pairs. When EURUSD falls you cannot tell from EURUSD alone whether the euro is weak or the dollar is strong. An index answers it. Put this under any chart and you are looking at the euro on its own terms, measured against the pound, the yen, the franc and the krona as well as the dollar. It uses the New York Board of Trade Euro Currency Index formula. EUR/USD 31.55% EUR/GBP 30.56% EUR/JPY 18.91% EUR/CHF 11.13% EUR/SEK 7.85
FREE

Displays trends in current chart. You can display trends of multiple timeframes in one chart by inserting this indicator as often as you want. Key features: displays trend line by finding highs and lows counts number of high/low of current trend in different color (long/short) allows you to display multiple timeframe trends in one chart Settings: Indicator Name: if you want to show M5 and H1 on one chart add TITrend twice to your current chart and rename M5 to "TITrendM5" and H1 to "TITrendH1" C
MetaTrader市场是 出售自动交易和技术指标的最好地方。
您只需要以一个有吸引力的设计和良好的描述为MetaTrader平台开发应用程序。我们将为您解释如何在市场发布您的产品将它提供给数以百万计的MetaTrader用户。
