 MetaTrader 5
 专家
 指标
 程序库
 实用工具
 窗口小部件
 规则
适用于MetaTrader 5的新技术指标 - 149
 技术指标的信号外汇和股票市场的开仓交易和平仓交易起着至关重要的作用。指标的本质就是一种交易品种的数学转换,旨在预测未来的价格变化。
测试技术指标可以更有利于预测市场行为并从中获利。

• Please test the product in the Strategy Tester before purchasing to understand how it works.
• If you face any issues, contact me via private message—I’m always available to help.
• After purchase, send me a screenshot of your order to receive a FREE EA as a gift.
The Visual EMA ReversalScout Indicator combines a powerful EMA crossover strategy with RSI-based divergence detection to generate reliable buy and sell signals. Its advanced logic ensures robust and actionable market insights w

• Please test the product in the Strategy Tester before purchasing to understand how it works.
• If you face any issues, contact me via private message—I’m always available to help.
• After purchase, send me a screenshot of your order to receive a FREE EA as a gift.
Visual EMA SignalLine Pro – Your Ultimate Trading Companion Experience a smarter, more precise approach to trading with Visual EMA SignalLine Pro! This powerful indicator simplifies complex market analysis, allowing you to focu

• Please test the product in the Strategy Tester before purchasing to understand how it works.
• If you face any issues, contact me via private message—I’m always available to help.
• After purchase, send me a screenshot of your order to receive a FREE EA as a gift.
VisualEMA TrendForce Indicator — Empower Your Trading with Precision Price: $65
Discover a Smarter Way to Trade with EMAs! The VisualEMA TrendForce Indicator is designed to elevate your trading with a reliable and visually intu

• Please test the product in the Strategy Tester before purchasing to understand how it works.
• If you face any issues, contact me via private message—I’m always available to help.
• After purchase, send me a screenshot of your order to receive a FREE EA as a gift.
Visual CrossPulse Indicator - Revolutionize Your Trading! Take your trading to the next level with the Visual CrossPulse Indicator, a cutting-edge tool designed for precision and ease. This indicator combines powerful technical

GPF Stochastic: a momentum indicator that compares a specific closing price of an asset to a range of its prices over a certain period. It helps traders identify potential overbought or oversold conditions in the market. The indicator consists of two lines: %K Line : The main line, which represents the current closing price relative to the price range over a set period. %D Line : The signal line, which is a moving average of %K. The Stochastic Oscillator ranges from 0 to 100 , with levels typic
FREE

How to Add a Product Description (MetaTrader Market) To add the product description effectively in MetaTrader's Market, follow these steps: 1. Log into the MetaTrader Market: Go to your MQL5 account . Navigate to the "Seller's Dashboard" or "Products" section. Select your product, DuhokTrend . 2. Writing the Description: To enhance the product's rating, write a detailed and structured description : Template for Product Description:
DuhokTrend - Advanced Indicator for Trend Analysis Overview:

This indicator is for scalpers who want to make profit from recovery and retracements. As a scalping indicator, you won't win big but small and steady profits. How to use this? Open a stop buy order if the price close below the "Recovery" at the recovery price with a TP at the "Expected recovery". It's best to use with an EA to open orders automatically closing at the current "Expected recovery" instead of setting a TP. Doing so will ensure orders will close no matter where the price go without
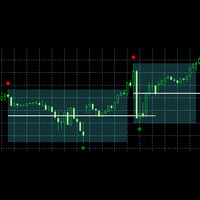
Based on concept of Zones from DTFX.
Video 2
Daves suggest using a length of 25 for optimal performance. But it's up to you to decide based on backtest/forwardtest results.
How this indicator draw zones
In bullish scenario, first it will find a swing high, then a swing low, then a break of with price closed above the swing high. But the way it find swing high and low heavily depends on structure length value. If you set structure length as 12: to find swing high it will check 13th candle high
请留下积极的评价。
重要提示 :截图中显示的图像是我的指标,包括Suleiman Levels指标和RSI Trend V指标,当然还附带了“Time Candle”,它最初是用于高级分析和独家水平的综合指标Suleiman Levels的一部分。 如果您喜欢,请尝试“RSI Trend V”指标:
https://www.mql5.com/en/market/product/132080 如果您喜欢,请尝试“Suleiman Levels”指标:
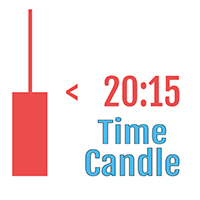
https://www.mql5.com/en/market/product/128183 Time Candle Suleiman指标旨在平滑且优雅地显示当前蜡烛的剩余时间。它提供完整的自定义选项,允许您控制倒计时的外观,包括字体类型、大小、颜色以及与蜡烛的相对位置,适用于所有时间框架。
注意:查看我的专业高级分析“Suleiman Levels”指标,这是一个综合指标,包含超过9,800行代码,具有罕见且独家的功能,可帮助您更好地理解和简化图表。它通过识别独家水平、支撑和阻力区域、趋势线以及突破或拒绝区域,实现更高效的交易。此外,它还
FREE

重要说明: 截图展示的是我的两个指标——"苏莱曼层级"指标和"RSI趋势V" 指标. يمكن أن يكون هذا أفضل ما يمكن أن يكون عليه الأمر بالنسبة إلى 9800 جنيه إسترليني. لا داعي للقلق بشأن هذه المشكلة
.
1-黄色方框(资金流检测)-黄色方框说明"完全创新且独有的指标特性-从零开始研发": 检测特定K线中银行与机构的资金流入. 2-الحصول على أفضل النتائج-الحصول على أفضل النتائج- 图表彩色层级说明"完全创新且独有的指标特性-从零开始研发":独家创新的非重绘彩色""""""""""""""""" 3-الحصول على أفضل النتائج: يجب أن يكون كل ما عليك فعله هو الحصول على أفضل سعر. 4-الأمر الأكثر أهمية هو أن كل ما عليك فعله هو أن تكون قادرًا على تحقيق النجاح في كل ما تحت
免费获取我所有的 MT4 和 MT5 指标 — 点击这里了解方法
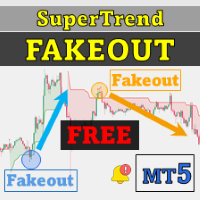
新工具 售价 $30 限于 首周 或 前 3 次购买 ! MQL5 Trading Tools 频道 : 加入我的 MQL5 频道,获取我的最新动态 Supertrend Fakeout 指标是经典 Supertrend 指标的增强版本,旨在提供更可靠的趋势信号。通过引入诸如 Fakeout Index Limit 和 Fakeout ATR Mult 等高级功能,该指标有助于过滤掉由于短期价格波动或市场噪声引起的假趋势反转。 查看更多 MT4 版本: Supertrend Fakeout MT4 查看更多产品: 所有产品 工作原理 Supertrend Fakeout 指标基于 平均真实范围 (ATR) 和一个乘数来识别趋势。 当价格高于 Supertrend 线时,表示上升趋势。 当价格低于 Supertrend 线时,表示下降趋势。 此增强版本在确认趋势反转之前增加了以下重要检查: 检查价格与 Supertrend 线的距离 指标监控价格是否从潜在突破点偏离距离等于 Fakeou
FREE

After your purchase, feel free to contact me for more details on how to receive a bonus indicator called VFI, which pairs perfectly with Easy Breakout for enhanced confluence!
Easy Breakout MT5 is a powerful price action trading system built on one of the most popular and widely trusted strategies among traders: the Breakout strategy ! This indicator delivers crystal-clear Buy and Sell signals based on breakouts from key support and resistance zones. Unlike typical breakout indicators
Get ALL my MT4 & MT5 indicators FREE — See how here
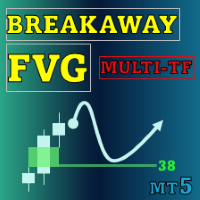
Special offer : ALL TOOLS , just $35 each! New tools will be $30 for the first week or the first 3 purchases ! Trading Tools Channel on MQL5 : Join my MQL5 channel to update the latest news from me Breakaway Fair Value Gaps (FVG) 工具是一种尖端的解决方案,旨在帮助交易者识别价格从平衡中突破的区域,并提供有关修正概率的深入见解。该工具不仅突出关键信号,还包括高级功能以提高决策的准确性。 查看 MT4 版本: Breakaway Fair Value Gaps MT4 查看更多产品: 所有 产品 Breakaway FVG 的关键特点 1. 什么是 Breakaway Fair Value Gap? 定义:
Breakawa
Get ALL my MT4 & MT5 indicators FREE — See how here
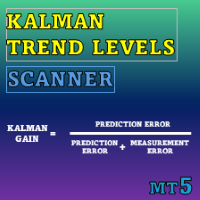
Special offer : ALL TOOLS , just $35 each! New tools will be $30 for the first week or the first 3 purchases ! Trading Tools Channel on MQL5 : Join my MQL5 channel to update the latest news from me Kalman Trend Levels 是一种先进的趋势跟踪指标,利用尖端的卡尔曼滤波技术,为交易者提供强大的分析信号。该工具设计精确且具有适应性,不仅能够识别关键的支撑和阻力区域,还提供全面的市场动量和趋势变化分析方法。 查看 MT4 版本: Kalman Trend Levels MT4 查看更多产品: All Products See more detailed explanation of Kalman Filter logic in this ind

圣诞节 特卖 : ALL PRODUCTS 均为 $30 SMC Scanner 不仅仅是一个指标,而是基于 Smart M0ney Concept (SMC) 构建的 综合交易分析系统 。该方法论让交易者理解并利用大型金融机构(Smart M0ney )的价格行为。借助其高级功能, SMC Scanner 将复杂的分析简化为可付诸行动的交易见解。 为什么选择 SMC Scanner? 理解市场行为: SMC Scanner 帮助你解读 Smart M0ney 的动作并抓住潜在的交易机会。 降低风险: 识别关键价格区域,如 Order Blocks (OB)、Fair Value Gaps (FVG)和流动性区域,以避免市场陷阱。 节省时间: 自动化市场分析和实时提醒,让你专注于决策。 多功能性: 适用于所有时间周期和货币对,提供最大灵活性。 SMC Scanner 的关键特性 1. 绘图面板 – 快速绘图工具 核心功能: 矩形工具 : 用你选择的背景颜色绘制实心矩形。 绘制无背景的空心矩形。 趋势线工具 : 创建可自定义的趋势线,可调整粗细和颜色。 水平线工具 : 轻松绘制水平

The TrendOscillator Indicator is an upgraded version of the traditional Stochastic Oscillator. It comprises two lines: %K and %D. The %K line represents the current market position. In contrast, the %D line is a moving average of the %K line used to generate signals and identify potential entry or exit points. The good thing is the indicator works on all timeframes like the traditional Stochastic. However, to avoid any false signals, applying the indicator on longer timeframes is better
FREE
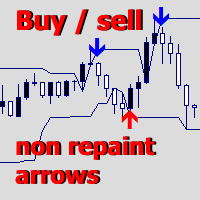
Upper and Lower Reversal - 早期预测反转时刻的系统。允许您在价格变动通道的上限和下限的边界处找到价格转折点。
指示器永远不会重新着色或改变信号箭头的位置。红色箭头是买入信号,蓝色箭头是卖出信号。
适应任何时间范围和交易工具 该指标不会重新绘制,仅在蜡烛收盘时起作用。 信号警报有多种类型 该指标易于使用,只有 2 个外部可配置参数: Channel Length - 调整构建信号的价格通道的长度。 Signal Normalization - 改变信号箭头的质量水平,参数越高 - 错误信号越少(对于 BTC、黄金和高波动性工具,变化几个数量级) Alerts play sound / Alerts display message / Alerts send notification / Send email - 当输入信号箭头出现时使用通知。 Sound for signals - 信号箭头的声音文件。

With this indicator, you can predict future price behavior for a certain number of bars ahead, giving you the ability to anticipate market dynamics. The indicator draws a forecast line , which models potential future price values based on sophisticated algorithms analyzing past data. This information can be leveraged not only for market entry and exit decisions but also for setting or adjusting stop-loss levels to better manage your positions. Application of the Forecast The data provided

Hello good people this is The Rangers Fx We have released indicator for Sniper entries it gives most signals on the lows and on the highs then other signals it's for continuation This indicator it's not complicated you only follow signals that are shown on the screen which is blue arrow for buy and red arrow for sell Timeframe is M15 (15 minutes) This indicator works on currencies,indices,cryptocurrencies,stocks,volatility index,step index etc as long as it's meta trader 5 this indicator will wo
The ABC Indicator analyzes the market through waves, impulses, and trends, helping identify key reversal and trend-change points. It automatically detects waves A, B, and C, along with stop-loss and take-profit levels. A reliable tool to enhance the accuracy and efficiency of your trading. This product is also available for MetaTrader 4 => https://www.mql5.com/en/market/product/128179 Key Features of the Indicator:
1. Wave and Trend Identification: - Automatic detection of waves based on mov

Are you looking for precision and reliability in your trading strategy? This non-repainting indicator is designed to elevate your trading game by providing entry signals aligned with the current trend direction, offering a powerful edge for traders of all styles. Key Features: Dual Signal Modes for Ultimate Flexibility :
1️⃣ Swing Trading Mode : Ideal for longer trades. Hold positions with confidence and target higher profit potential.
2️⃣ Scalping Mode : Designed for quick trades with minim

Introducing Assembler:
The best value for money, Designed for advanced traders and professionals, yet accessible for ambitious beginners ready to elevate their trading game. Great for ICT, SMC, TREND and breakout traders . Combining advanced analytics, a sleek graphical interface, and highly customizable features, Assembler empowers you to trade with precision, clarity, and confidence.
Key Features of Assembler 1. Dynamic Graphical User Interface (GUI): A fully draggable, customizable interf

3D Bars Oscillator - Market Trend Visualization Indicator Brief Description 3D Bars Oscillator is an innovative MetaTrader 5 indicator that provides a unique three-dimensional view of market trend dynamics using advanced Renko and smoothing algorithms. Key Features Visualization Technology : Three-dimensional representation of market trend Adaptive Algorithm : Trend calculation based on Renko blocks Flexible Configuration : Full control over indicator parameters Technical Specifications Version
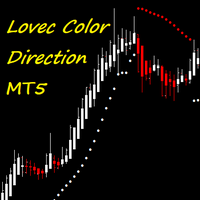
An indicator for better perception and recognition of the current trend direction, the beginning and end of corrections. It is recommended for manual trading, but it is possible to integrate it into an Expert Advisor for automated trading. The dots around the price indicate the current trend direction, the color of the candles themselves indicates the presence or absence of a correction. It is recommended to enter a position in the direction of the current trend after the end of corrections.

Multi-timeframe Parabolic SAR panel for a better visual perception of the market situation and assessment of the trend, trend reversals. Used exclusively!!! on the daily timeframe. The panel indicates the direction of SAR movement on the current (daily), as well as on the weekly (medium-term) and monthly (long-term) timeframes. It is possible to customize the display colors for each individual timeframe. General Step and Maximum settings for the entire panel.

Trend Compass: All-in-One Trend Tracking Trend Compass is an advanced, all-inclusive trading indicator that provides a comprehensive solution for trend-following traders, designed to simplify market analysis and decision-making.
Trade How You Like: Extreme Customization Trend Compass is not just a rigid system, it is a highly adaptable framework designed to fit your specific trading style. With over 100 configurable settings, you have total control over how the market is analyzed, filtered
If you love this indicator, please leave a positive rating and comment, it will be a source of motivation to help me create more products <3 Key Takeaways The Laguerre RSI is an enhanced version of the traditional Relative Strength Index (RSI) that incorporates Laguerre filters to smooth the price data. This helps reduce the noise and volatility that are often seen in the standard RSI, providing a cleaner and more reliable indicator for spotting trends, reversals, and overbought or oversold con
FREE

The SuperTrend Indicator is a powerful trend-following tool that overlays directly on your price chart. Designed to help traders identify prevailing trends and potential reversals, this indicator uses Average True Range (ATR) calculations to dynamically adjust to market volatility. The intuitive color-coded display ensures clear visualization of trend changes. Key Features: Dynamic Trend Identification: Utilizes ATR-based calculations to provide responsive support/resistance levels in line with
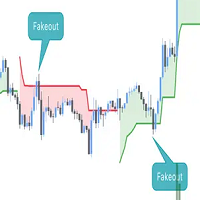
This script is an enhanced version of the classic Supertrend indicator. It incorporates an additional feature that ensures trend reversals are more reliable by introducing a Fakeout Index Limit and a Fakeout ATR Mult. This helps avoid false trend changes that could occur due to short-term price fluctuations or market noise. In smart money concept, when institute , "big-fish" want to buy, they usually sell first to take sellside liquidity and vice versal. This is why the indicator become importan

What is VWAP? The Volume Weighted Average Price (VWAP) is a trading benchmark that reflects the average price of a security, weighted by volume, over a specific time period. It helps traders identify fair value and is used widely in intraday trading to assess price action relative to institutional trading levels. Key Features of Anchored VWAP PRO Anchored Calculation : Unlike traditional VWAP that resets daily, your indicator allows users to anchor VWAP to specific time frames or key points (e.g

The Breakaway Fair Value Gap (FVG) is a typical FVG located at a point where the price is breaking new Highs or Lows.
USAGE Figure 1 In the figure 1, the price range is visualized by Donchian Channels.
In theory, the Breakaway FVGs should generally be a good indication of market participation, showing favor in the FVG's breaking direction. This is a combination of buyers or sellers pushing markets quickly while already at the highest high or lowest low in recent history. Figure 2 Whi

MA Crossover and Trend Alert Indicator Latest Updates: Fixed multiple buy and sell icons on each candle for cleaner signals. Optimized alert logic to prevent duplicate notifications. Enhanced compatibility – Now works with Heiken Ashi or regular candles. Updated print statement – Alerts now log directly to alerts.txt for future reference. Overview
The EMA Crossover and Trend Alert Indicator is a trend-following tool designed to assist traders in identifying moving average crossovers and short-
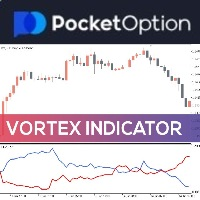
Vortex Indicator with Alert System for MT5 Overview
The Vortex Indicator with Alert System is a trend-following tool designed to help traders identify market direction and momentum shifts. This MetaTrader 5 (MT5) indicator analyzes positive and negative vortex movements (+VI and -VI) and generates buy and sell crossover signals with visual markers and customizable alerts. Directional Momentum Detection: Tracks +VI and -VI crossovers for trend confirmation. Crossover Alerts: Notifies traders of

• Please test the product in the Strategy Tester before purchasing to understand how it works.
• If you face any issues, contact me via private message—I’m always available to help.
• After purchase, send me a screenshot of your order to receive a FREE EA as a gift.
Master Support & Resistance Trading with Precision LevelGuard SmartSMA leverages the power of moving averages to help you trade confidently across markets. Designed to identify dynamic support and resistance levels, this EA deli

# ZigZag RSI with Dynamic Trendlines and Multi-Level Alerts
## Overview The ZigZag RSI indicator is an advanced technical analysis tool that combines the power of RSI (Relative Strength Index) with ZigZag pattern detection and dynamic trendline analysis. It helps traders identify potential trend reversals, support/resistance levels, and provides automated alerts for multiple trading scenarios.
## Key Features - Combined RSI and ZigZag pattern detection - Dynamic swing high/low identification

The ATR Trade System is a sophisticated trading tool designed for active traders seeking precise entry and exit points based on market volatility. This system combines adaptive trend identification with dynamic support and resistance levels, making it suitable for any trading instrument and timeframe. Key Features: Adaptive trend detection with color-coded signals Multiple volatility modes (Tight to FOMC) for different market conditions Higher timeframe trend analysis for better context Customiz
Advanced Price Level Alert The Advanced Price Level Alert is a powerful price-monitoring tool designed for traders who need reliable and customizable price-level alerts. This indicator combines visual price-level tracking with flexible alert mechanisms to keep you informed of important price movements without requiring you to constantly monitor your charts. Key Features Customizable Alert Frequencies – Choose from six different alert-frequency settings, ranging from 1 to 20 alerts per minute. Mu
FREE

Server Timer
Version: 1.2 The Server Time Clock Indicator is a lightweight and visually appealing tool for displaying the server's current date and time directly on the chart. This indicator updates dynamically every second and provides the following features: Customizable Appearance : Adjust font color, background color, and font size to match your chart's theme. Day and Time Display : Shows the current day, date, and time in an easy-to-read format ( Day{MM/DD} HH:MM:SS ). No Performance Over
FREE
JESUS CROSS Indicator by Damion Description: The MA Crossover indicator is designed to alert traders when two moving averages cross on a 30-minute chart. It uses a Fast Moving Average (10-period) and a Slow Moving Average (21-period) to detect crossovers, which are commonly used as signals for potential trend changes. Key Features: Fast and Slow MA : The indicator employs a 10-period Fast Moving Average (FastMA) and a 21-period Slow Moving Average (SlowMA). Customizable Settings : Users can req

Haven Candle Timer Countdown — 实用多时间周期蜡烛倒计时指标 Haven Candle Timer Countdown 是一款实用的辅助指标,旨在帮助交易者同时准确跟踪多个时间周期的当前蜡烛收盘剩余时间。它能有效避免在K线即将收盘时进行不合时宜的交易,并使当前服务器时间在图表上清晰可见。 其他产品 -> 点击这里 。 在许多交易系统中,准确计算蜡烛收盘时间对决策至关重要。该指标将此过程自动化,直接在图表上显示信息,且不会使您的工作区显得杂乱。 核心功能 当前蜡烛倒计时(跟踪 Bid 价格) — 直接在当前价格线旁显示剩余时间。倒计时颜色会根据蜡烛方向(阳线或阴线)自动变化,便于快速直观地评估市场态势。 三个可配置的角落倒计时 — 允许您在首选角落显示三个选定时间周期(从 M1 到 MN)的倒计时。这有助于您在不切换窗口的情况下监控更高或更低的周期。 经纪商交易时段感知(“Market Closed”状态) — 指标会监控经纪商的实际交易时间。当市场关闭时(例如周末),它会显示清晰的“Market Closed(休市)”状态,而不是显示误导性或冻结的数字。
FREE
Get ALL my MT4 & MT5 indicators FREE — See how here
Special offer : ALL TOOLS , just $35 each! New tools will be $30 for the first week or the first 3 purchases ! Trading Tools Channel on MQL5 : Join my MQL5 channel to update the latest news from me Trendlines with Breaks Scanner 是一款先进的交易工具,旨在帮助交易者实时识别关键趋势和突破点。通过基于枢轴点的自动生成趋势线,该指标让交易者能够以精准和自信把握交易机会。 查看 MT4 版本: Trendlines with Breaks Scanner MT4 查看更多产品: All Products 主要功能 1. 实时突破检测 突破警报: 当价格突破趋势线时立即通知您。集成的警报功能确保您不会错过任何关键的市场动作。 无重绘

Introducing Indicator for PainX and GainX Indices Traders on Weltrade Get ready to experience the power of trading with our indicator, specifically designed for Weltrade broker's PainX and GainX Indices. Advanced Strategies for Unbeatable Insights Our indicator employs sophisticated strategies to analyze market trends, pinpointing optimal entry and exit points. Optimized for Maximum Performance To ensure optimal results, our indicator is carefully calibrated for 5-minute timeframe charts on
免费获取此指标及 更多指标 ,请点击这里: 将指标转换为交易机器人(无需编程) 特别优惠 : ALL TOOLS ,每款仅 $35 ; 限时优惠 ! 新工具 将是 30 美元 为 第一周 或 前 3 次购买 ! MQL5 上的交易工具频道:加入我的 MQL5 频道以接收最新更新 多时间框架 & 多符号指南: 多时间框架 & 扫描仪用户指南 - 提供 12 种语言版本 请参阅 MT5 版本: Volumatic VIDyA MT5 Multi-Timeframe Scanner 请参阅 MT4 版本: Volumatic VIDyA MT4 Multi-Timeframe Scanner 查看更多产品: 所有产品 或 交易指标、特别优惠 & 新发布 Volumatic VIDyA Multi-Timeframe Scanner 将自适应趋势检测、基于 ATR 的波动带、枢轴流动性水平、定向成交量分析、多时间框架可视化和多交易品种扫描仪结合在一个综合指标中。 该指标的核心是使用 VIDyA - 可变指数动态平均 - 调整其平滑速度以适应当前的市
相对强弱指数(RSI) 多货币扫描仪 MT5 是一款创新的交易工具,旨在帮助交易者有效地同时监控多个货币对。通过利用强大的 RSI 指标,该扫描仪提供市场状况的全面概述,帮助交易者识别各个时间框架内的潜在交易机会。 该指标通过以用户友好的格式呈现关键信号,提供了显著的优势。交易者可以根据自己的策略自定义设置,使其成为初学者和经验丰富的交易者提升市场分析和决策过程的理想解决方案。 MQL产品安装指南 | 在 MT4/MT5 上更新已购买的MQL产品 | 常见故障排除指南 | 指标设置 / 指南 主要特点 缓冲区集成:将指标值暴露为可访问的缓冲区,允许 Expert Advisor 读取自动交易信号。 可视化箭头信号:在信号蜡烛图上直接显示清晰的买入/卖出箭头,便于视觉阅读。 快速且可回测:基于 MetaTrader 的本机 OnCalculate() 引擎构建,确保快速执行并兼容历史回测。 弹出警报:在信号事件上发送 MetaTrader 警报弹窗,让您不错过任何交易设置。 推送通知:为您的 MetaTrader 移动应用提供实时推送通知,便于随时监控。 电子邮件警报:在信号事件上发送电
介绍 Moving Average Multicurrency Scanner MT5,这是一款尖端指标,旨在通过监控多个货币对在不同时间框架下来增强您的交易体验。此工具非常适合依赖移动平均线来识别趋势并做出明智交易决策的交易者。 使用 Moving Average Multicurrency Scanner MT5,您可以轻松分析市场动态并及时接收信号,让您能够实时把握交易机会。想象一下,您可以通过无缝对接多个时间框架和货币对来定制您的交易策略。 MQL产品安装指南 | 在 MT4/MT5 上更新已购买的MQL产品 | 常见故障排除指南 | 指标设置 / 指南 主要特点 缓冲区集成:将指标值暴露为可访问的缓冲区,允许 Expert Advisor 使用基于信号的交易策略。 可视箭头信号:Plots 在信号蜡烛上直接在图表上清晰显示买入/卖出箭头,便于视觉阅读。 快速且可回测:基于 MetaTrader 的本地 OnCalculate() 引擎构建,确保快速计算并与策略测试器兼容进行历史回测。 弹出警报:在信号事件上生成 MetaTrader 弹出警报,确保您不会错过潜在的交易设置。

介绍 Ichimoku Cloud Multicurrency Scanner MT5,这是一款创新的交易指标,旨在帮助交易者同时监控多个货币对。此工具非常适合希望在不同时间框架中利用 Ichimoku Kinko Hyo 策略的交易者,提升他们的交易决策过程。 凭借其先进的功能,Ichimoku Cloud Multicurrency Scanner MT5 简化了信号识别,使交易者能够快速发现潜在的交易机会。无论您是日内交易者还是长期投资者,此工具都能提供有价值的见解,以优化您的交易策略。 MQL 产品安装指南 | 在 MT4/MT5 上更新已购买的 MQL 产品 | 常见故障排除指南 | 指标设置 / 指南 主要特点 缓冲区集成:将指标值作为可访问的缓冲区暴露,允许 Expert Advisor 使用它们进行基于信号的自动交易。 可视化箭头信号:在信号蜡烛上直接在图表上显示清晰的买入/卖出箭头,便于视觉阅读。 非重绘信号:信号仅在闭合的柱上确认,确保可靠性和准确性,无需回测曲线拟合。 快速且可回测:基于 MetaTrader 的本地 OnCalculate() 引擎构建,提供极快
Brilliant Reversals MultiCurrency Scanner MT5 是一款先进的交易指标,旨在帮助交易者识别多个货币对的潜在反转点。通过利用先进的算法,这个工具提供即时洞察,使其对希望优化交易策略的新手和经验丰富的交易者都极为重要。 该指标通过根据市场条件提供实时买入和卖出信号,增强了交易者的决策能力并改善了交易表现。凭借其全面的仪表板和警报功能,您可以轻松监控关键货币对,并迅速抓住市场机会。 MQL产品安装指南 | 在 MT4/MT5 上更新已购买的MQL产品 | 常见故障排除指南 | 指标设置 / 指南 主要特点 缓冲区集成:将指标值暴露为可访问的缓冲区,使 Expert Advisor 能够有效利用基于信号的交易。 可视化箭头信号:在您的图表上清晰地显示 BUY/SELL 箭头,方便您发现交易机会。 快速且可回测:基于 MetaTrader 的本地 OnCalculate() 引擎构建,确保快速计算并与策略测试器完全兼容。 弹出警报:在信号事件时触发警报弹窗,确保您不会错过潜在的交易设置。 推送通知:实时向您的 MetaTrader 移动应用发送推送通知,

此指标是EA的一部分: HIPERCUBE PRO GALE BTC Darwinex Zero 20%折扣码: DWZ2328770MGM_20
推出新版本的Donchian指标
我们很高兴推出 新版本的Donchian指标 ,它经过尖端改进和精度增强。现在完全 适配于HiperCube Pro Gale ,这一更新工具提供了更高效交易的无缝体验。
为什么这个版本是游戏规则的改变者:
适配于HiperCube Pro Gale : 最新更新专为与 HiperCube Pro Gale 集成而设计,确保您的交易策略具有最大兼容性和效率。 无与伦比的功能 : Donchian指标一直是市场趋势追踪的热门选择,新版本经过优化,性能更上一层楼。 验证的有效性 : 凭借其预测市场动态的能力,Donchian指标显示出 更高的精确性和可靠性 ,是严肃交易者的必备工具。 探索 Donchian指标 的强大功能,并通过这一先进的高性能工具提升您的交易水平。
FREE

CandleStick Patterns Multicurrency Scanner MT5 是一个创新的指标,旨在帮助交易者识别各种货币对和时间框架中的蜡烛图模式。这个工具非常适合希望通过利用视觉信号和警报来增强交易策略的初学者和经验丰富的交易者,以便及时做出决策。 通过使用 CandleStick Patterns Multicurrency Scanner MT5,交易者可以同时监控多个货币对,从而获得更明智的交易决策。这可以通过实时识别潜在的反转或延续模式来改善交易结果。 MQL产品安装指南 | 在 MT4/MT5 上更新已购买的 MQL 产品 | 常见故障排除指南 | 指标设置 / 指南 主要特点 信号检测:识别并显示15种流行的蜡烛图模式,包括十字星、锤子线和看涨吞没。 视觉箭头信号:Plots 在图表上直接显示清晰的买入和卖出箭头,便于识别交易设置。 快速且可回测:基于 MetaTrader 的本地 OnCalculate() 引擎构建,确保快速计算并与策略测试器兼容。 弹出警报:在信号事件上提供实时警报弹窗,保持交易者的信息更新。 推送通知:向您的移动设备发送即时推送通

Parabolic Sar Multicurrency Scanner MT5 是一款专为 MetaTrader 5 用户设计的高级交易指标。它允许交易者轻松监控多个货币对和时间框架,为有效的交易策略提供关键见解。 该工具通过提供基于抛物线SAR指标的实时信号,提高了交易效率,非常适合希望利用各种货币对市场趋势和反转的交易者。 MQL产品安装指南 | 在 MT4/MT5 上更新已购买的MQL产品 | 常见故障排除指南 | 指标设置 / 指南 主要特点 缓冲区集成:将指标值作为可访问的缓冲区暴露给 Expert Advisor,以便在自动交易中使用。 视觉箭头信号:在图表上直接显示 Plots 清晰的买入/卖出箭头,便于在信号蜡烛上进行视觉读取。 快速且可回测:基于 MetaTrader 的本地 OnCalculate() 引擎构建,确保快速计算并与策略测试器完全兼容。 弹出警报:为信号事件触发 MetaTrader 警报弹出窗口,确保您不会错过潜在的交易设置。 推送通知:实时向您的 MetaTrader 移动应用发送推送通知,以便随时监控。 电子邮件警报:在信号事件上提供电子邮件通知,
Stochastic Multicurrency Scanner MT5 是一个复杂的指标,旨在帮助交易者监控多个货币对,使用 Stochastic 振荡器。这个工具非常适合希望通过在各种时间框架中接收及时信号来增强交易策略的新手和经验丰富的交易者。 该指标通过允许交易者即时识别超买和超卖状态,提供了显著的优势。例如,交易者可以快速发现市场中的潜在反转点,从而做出更明智的交易决策,提高盈利能力。 MQL产品安装指南 | 在 MT4/MT5 上更新已购买的 MQL 产品 | 常见故障排除指南 | 指标设置 / 指南 主要特点 缓冲区集成:将指标值暴露为可访问的缓冲区,允许 Expert Advisor 使用信号进行自动交易。 视觉箭头信号:在信号蜡烛上直接在图表上显示清晰的买入/卖出箭头,便于读取市场状况。 快速且可回测:基于 MetaTrader 的本机 OnCalculate() 引擎构建,确保快速计算并与策略测试器兼容,以进行历史分析。 弹出警报:在信号事件上触发 MetaTrader 警报弹出窗口,确保您不会错过任何交易机会。 推送通知:实时向您的 MetaTrader 移动应用
SuperTrend Multicurrency Scanner MT5 是一种先进的交易指标,旨在使用超级趋势策略高效监控多个货币对和时间框架。非常适合寻求利用趋势策略的交易者,这个工具提供全面的趋势分析和信号,以增强交易决策。 该指标提供无与伦比的优势,如实时趋势监控和警报系统,使交易者更容易识别有利的进出点。无论您是经验丰富的交易者还是刚刚起步,SuperTrend Multicurrency Scanner MT5 都能为您提供必要的见解,以有效导航 forex 市场。 MQL产品安装指南 | 在 MT4/MT5 上更新已购买的MQL产品 | 常见故障排除指南 | 指标设置 / 指南 主要特点 缓冲区集成:将指标值暴露为可访问的缓冲区,供 Expert Advisor 使用,实现基于信号的自动交易。 视觉箭头信号:在信号蜡烛上清晰显示买入/卖出箭头,便于直观解读。 快速且可回测:基于 OnCalculate() 引擎构建,确保快速计算并与策略测试器兼容,便于历史回测。 弹出警报:在信号事件上触发 MetaTrader 警报弹窗,确保您不会错过任何交易机会。 推送通知:实时向您的

MT5交易中的指标追踪功能 MetaTrader 5 (MT5) 的 指标追踪 功能是交易者优化交易过程和决策的关键工具。该功能允许交易者监控关键市场数据并有效分析趋势,从而提高交易执行的准确性并优化策略调整。 主要功能: 实时市场监控 :
实时追踪外汇、股票、大宗商品等多个市场的数据,指标动态更新,帮助交易者掌握最新的价格变动和市场动态。 可自定义指标 :
MT5提供多种内置指标(如RSI、MACD、移动平均线),同时支持创建或导入符合个性化策略的自定义指标。 可视化分析工具 :
指标直接叠加在图表上,提供清晰的视觉指引。交易者可以自定义图表的时间框架和样式,以便详细分析价格趋势、交易量和动量。 高级提醒系统 :
设置指标信号提醒,例如指标交叉、超买/超卖状态或背离模式。提醒可通过弹窗、邮件或移动端推送消息发送,确保交易者不会错过重要机会。 多时间框架分析 :
同时在不同时间框架上分析指标,帮助交易者在把握长期趋势的同时精确捕捉短期机会。 与自动交易集成 :
使用指标作为触发条件,通过智能交易系统(Expert Advisors, EAs)自动执行交易。这减少了情绪干扰并提高交易效率
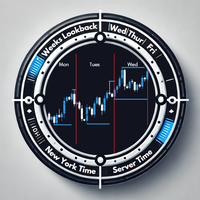
Overview The Daily Session Separator indicator is a powerful tool designed to enhance your trading experience by clearly marking daily trading sessions on your chart. It helps traders visualize daily boundaries, session highs and lows, and essential day-specific data to make informed decisions. With its seamless integration into any chart and dynamic adaptability, this indicator is a must-have for traders who rely on precision and clarity. Key Features Daily Session Separators Automatically adds
FREE

This factor is traded on the 5M five-minute frame
Please see the explanations in the attached images
Trading is done according to the trend. If the trend is upward, we buy only when the red line is touched
If the trend is downward, we sell only when the blue line is touched
In the case of a sideways trend, we can sell when the blue line is touched and buy when the red line is touched
When the price reaches the red buy line or the sell line from above, we enter a deal and stop the loss at 5
If you love this indicator, please leave a positive rating and comment, it will be a source of motivation to help me create more products <3 Key Takeaways The Zig Zag Advanced indicator plot points on a chart whenever prices reverse by the percentage the trader sets in the input section. The Zig Zag Advanced indicator lowers the impact of random price fluctuations and is used to identify trends and changes in trends. The indicator lowers noise levels, highlighting trends higher and lower. Th
FREE
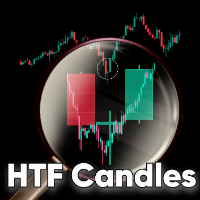
HTF Candles is an indicator which plots the outline of the higher time-frame candles on the lower candle. The indicator gives you the option to choose whether or not to view live current HTF candle, with no lag or repainting. Features No objects drawn on chart: The indicator does not plot any lines or rectangle objects on the chart, it simply draws the htf candles. This keeps your chart simple and clean. MTF Selection: The indicator allows you to choose all the different higher time-frames for e

Introducing the Range Predictor : Your Ultimate Guide to Future Trading Ranges! Imagine having the power to see into the future of market moves— Range Predictor brings this dream to life. Designed to deliver real-time, predictive support and resistance levels , this tool goes beyond standard indicators, offering trend direction insights and precise range forecasts . Whether you're a day trader or a swing trader, the Range Predictor is your all-in-one toolkit for mastering the ma

Indicator Overview Latest Updates: Update 02-23-2025: This version includes further optimizations for improved signal accuracy. Update 01-13-2025: Now compatible with the upcoming Web Request App, which will replace the AutoSignal_Connection bot. Purpose
This MT5 indicator is designed for analyzing 3-minute Heiken Ashi candles, generating buy and sell signals based on moving average (MA) crossovers. It provides visual signals and alerts, making it a valuable tool for traders. Heiken Ashi Candl

Multi-functional Pattern Indicator: Your Assistant for Successful Trading Looking for a tool to help you identify the most critical market patterns and improve your trading decisions? Our indicator is a versatile assistant for traders of any level. Automatic Detection and Plotting:
The indicator automatically analyzes the chart and highlights patterns, saving you from the hassle of searching for them manually.
If you love this indicator, please leave a positive rating and comment, it will be a source of motivation to help me create more products <3 How to use Gann High-Low Activator? The Gann HiLo Activator helps the trader identify the current trend of the market. When the indicator is below the closing price, it can indicate that an uptrend is taking place. Conversely, when the indicator is above the closing price, it can indicate a downtrend. The Gann HiLo Activator also generates buy and sell sig
FREE
The Precision Scalping Indicator is a powerful and versatile trading tool designed to enhance your scalping strategies across various financial markets. Whether you trade forex pairs, commodities like Gold (XAU/USD), cryptocurrencies such as Bitcoin (BTC), or synthetic indices from Deriv, this indicator adapts seamlessly to your trading style. Key Features: Non-Repainting Signals : Ensures signal reliability by displaying fixed signals that don't disappear or repaint. Audible Alerts : Real-time

If you love this indicator, please leave a positive rating and comment, it will be a source of motivation to help me create more products <3 How to use SuperTrend? When the price crosses above the supertrend line it signals a buy signal and when the price crosses below the supertrend line it signals a sell signal. The supertrend indicator which acts as a dynamic level of support or resistance and helps traders make informed decisions about entry and exit points. When prices are above s upertre
FREE

Trend Following with Adaptive Weighted Average (AWA) Indicator The Adaptive Weighted Average (AWA) indicator is is a powerful technical analysis tool designed to provide highly accurate trading signals across various symbols and timeframes. This indicator leverages a unique Adaptive Weighted Average (AWA) calculation, combining multiple moving averages with user-defined weights, and incorporates advanced filtering techniques to minimize noise and whipsaw signals. The indicator is particularl
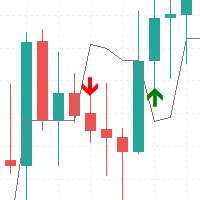
UT Bot Alert Indicator: Detailed Functionality Core Mechanism The UT Bot Alert indicator is a sophisticated trading tool designed to identify market trends and potential entry/exit points using a dynamic trailing stop method. Key Technical Components Volatility Calculation Uses Average True Range (ATR) to measure market volatility ATR period is customizable by the trader Provides adaptive tracking of price movements Trailing Stop Mechanism Creates a dynamic stop line that follows price action Ad

If you love this indicator, please leave a positive rating and comment, it will be a source of motivation to help me create more products <3 Key Takeaways Fisher is a repaint indicator. It recalculates previous bars when new bars become available. Modified to avoid repainting to accommodate some merchants. Fisher indicator is quite a simple histogram indicator that detects the trend's direction and strength and signals about trend changes. Traders look for extreme readings to signal potential p
FREE

If you love this indicator, please leave a positive rating and comment, it will be a source of motivation to help me create more products <3 How to use QQE? Determine trend when RSI MA above 50 indicate a bullish market, while RSI MA below 50 indicate a bearish market and can server as a trend filter. Identify short-term up/down momentum, when the RSI MA crosses up Smoothed signals bullish momentum, and when the RSI MA crosses down Smoothed signals bearish momentum. It is also possible to
FREE

The Market Heart indicator scans market entries after high volatility is noticed. Most big moves occur a short time after market volatility. Most big moves occur a short time after market volatility. The idea is to look for entries after the rectangles form and not necessarily as trade entry signals. . For example, you could use the Retracement Feeder indicator that generates arrow signals.
Market Heart MT4 Version
How to use: 1. Primary use The White Box is the first to be formed an

If you love this indicator, please leave a positive rating and comment, it will be a source of motivation to help me create more products <3 How to use Aroon Indicator? The AroonUp and the AroonDown measure the strength of the uptrend and the strength of the downtrend, respectively. These lines fluctuate between zero and 100. Values close to 100 indicate a strong trend and values near zero indicate a weak trend where the lower the AroonUp, the weaker the uptrend and the stronger the downtrend,
FREE
Is Zero Lag profitable? Not always, different system is for different pairs. You can play around with this indicator from Mladen, I have modified it with Bollinger Bands over T3.
You can change the period and how it calculate. MT4 version soon will be released too. Please leave a review , it helps us and we will share more indicators. .... Thank you and happy trading
FREE
MetaTrader市场是 出售自动交易和技术指标的最好地方。
您只需要以一个有吸引力的设计和良好的描述为MetaTrader平台开发应用程序。我们将为您解释如何在市场发布您的产品将它提供给数以百万计的MetaTrader用户。
