 MetaTrader 5
 专家
专家 指标
指标 程序库
程序库 实用工具
实用工具 窗口小部件
窗口小部件 规则
规则适用于MetaTrader 5的新技术指标 - 147
 技术指标的信号外汇和股票市场的开仓交易和平仓交易起着至关重要的作用。指标的本质就是一种交易品种的数学转换,旨在预测未来的价格变化。
测试技术指标可以更有利于预测市场行为并从中获利。
技术指标的信号外汇和股票市场的开仓交易和平仓交易起着至关重要的作用。指标的本质就是一种交易品种的数学转换,旨在预测未来的价格变化。
测试技术指标可以更有利于预测市场行为并从中获利。 
Note: This indicator is for sub-window use and not for the main chart. If you need to apply it for the indicators in the main chart, then use this indicator instead: https://www.mql5.com/en/market/product/108876 AIntel Predict - Your Gateway to Future Trading Success! Unlock the power of predictive analytics with AIntel Predict. Say goodbye to the guesswork and hello to improved forecasting, as AIntel Predict leverages historical data to unveil the future of your trades like never before. Whe

It is 1 Minute Strategy. When Indicator Gives Signal Then Put on Buy. It's Best Work on Crash 300 & Crash 500. If you want to know anything details please Contact Me on Telegram In this Link: https://t.me/+mi_52VwFp3E4MGNl It is very nice for scalping & for who not gives enough time on market.
N/B: Please be carefully it's only for scalping & not trade all the day. It's only 10 or maximum 15 trade per day.
Thanks everyone.

現在的價格相當優惠,建議盡早入手——價格可能隨時調整。 Black horse 指标的目标是找出价格走势与VWAP指标之间的背离。它使用过滤器来排除许多虚假的背离,提供高质量、准确的信号。
红色点位于蜡烛上方,表示看跌的背离,而绿色点位于蜡烛下方,表示看涨的背离。
背离的主要过滤器聚焦在ATR(平均真实范围)和过去蜡烛的价格变动,直到回顾期结束。当回顾期内的价格变动足够急剧,超过ATR倍数乘以ATR时,将确定存在背离。
由于计算的特性,在处理较高时间框架时,建议将ATR倍数和回顾期设置得较低。在较高的时间框架上,价格波动往往更为平滑,例如15分钟图表,急剧的价格波动发生的频率较低,通常包含在较少的蜡烛中,而这些蜡烛通常出现在较低的时间框架上。较不波动的股票,如HSBC,也应使用较低的ATR倍数和较短的回顾期。
我們所有箭頭訊號指標的核心特點
100% 不重繪 / 無延遲 的箭頭訊號
訊號一旦出現即固定 —— 不閃爍、不移位、不修改
內建 圖表箭頭、資訊面板、彈窗提示、聲音提醒、推播通知
支援 EA(提供緩衝區輸出),可用於自動交易或訊號複製
这是一个简单的VWAP指标,但我们在其中设置了提醒,以便您知道当价格触及简单VWAP或价格穿过VWAP时。 这是MetaTrader 5(MT5)的传统VWAP指标。 默认参数与常规VWAP相同,但您可以选择使用新的计算方法: 当价格触及或穿过VWAP时,您将通过提醒、手机通知、电子邮件或声音事件得知。 免费的MetaTrader 5锚定VWAP指标 。 参数: VWAP周期 VWAP基于时间周期进行计算。常规VWAP每天都以新的计算开始。然而,我留下了这个参数,让您选择一个喜欢的时间周期来计算VWAP。也就是说,您可以在M1时间框架内,查看H1的VWAP计算,该计算始终在每个新的H1条上重新启动。计算每个选择的时间周期都会重新启动。 然而,您现在不需要担心这一点,因为默认参数与常规VWAP的参数相同。只需将此VWAP指标下载并插入到您的MetaTrader 5(MT5)图表中即可。 价格类型 计算VWAP的默认价格是收盘价(Close),这是简单VWAP的标准价格。但是,您还可以选择其他价格类型进行VWAP计算,如下所示: 收盘价 开盘价 最高价 最低价 中值 典型价 加权价 Up,
FREE

第一个射频干扰脉冲水平 这是关键的反转点,也是回测后寻找入场点的主要区域。后续的RFI水平证实了新方向的强度以及该趋势的延续。 俄语说明 — 英文说明 — MT4 版本 主要特点: 活跃买家和卖家区域 该指标会自动识别买卖设置的第一个RFI脉冲水平。一旦某个水平被激活,就会开始寻找入场点:区域颜色会发生变化,同时额外的箭头可以帮助快速识别价格走势的方向。 逻辑人工智能——入口搜索区域 交易设置激活后,指标会突出显示需要进行进一步分析和寻找潜在入场点的区域。这些区域在图表上以特殊标记显示。 更高时间框架级别 — MTF 模式 MTF模式允许您将更高时间框架的RFI水平直接显示在当前图表上。这有助于同时分析多个时间框架的市场。 它还可以与以下方式一起使用: TPSpro TREND PRO 用于进一步分析趋势方向。 逐步交易算法 我们专门开发了一种交易算法来处理活跃的RFI设置。该算法适用于日内交易,既可顺势交易,也可寻找反转机会。 适用于所有时间周期 TPSpro RFI 级别可用于从 M1 到 MN 的任何时间范围。 视
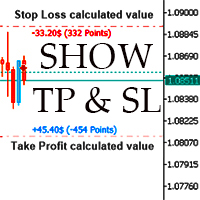
Orders SL and TP Values Show 此指標在主圖表中的線條上顯示損益值。此外,也會顯示以點為單位的距離。
此指標的一些特徵是:
選擇包含掉期值以更精確地計算您的訂單停損和止盈值。 (預設啟動) 可以選擇在價格左側包含票號。這對於根據終端的工具箱識別等級很有用。 (預設為禁用) 無論停損值還是止盈值,當盈利時,它們都會被塗成藍色,當它們虧損時,它們會被塗成紅色。 如果存在 2 個或多個具有相同價值的不同票據的止損或止盈,他們將隨機旋轉資訊以及票據編號,以便正確識別每一張。 這些值將以您帳戶上的貨幣顯示。積分也會顯示。 顏色或距離可以透過輸入參數進行調整。 計數器顯示符合的總訂單的目前索引(具有相同止損或止盈值的訂單)。 顯示考慮目前工具的所有停損和止盈水準的損失和利潤比率資訊的文字(在此計算中可以將掛單設為忽略)。
隨著時間的推移,如果用戶提出要求,將會添加更多選項和功能。
該軟體已經在許多變數上進行了測試,如果存在錯誤或錯誤,請報告它,並儘可能詳細地描述其原因,如果可能,請附上螢幕截圖,以便我了解如何修復它。
僅以英語報告。

ATR Projection指标在技术分析中脱颖而出,旨在提供有关金融市场潜在价格移动极限的准确见解。其灵活的方法允许用户直观地定制分析指标,以适应每个交易资产的特定需求。
可定制的运行方式:
默认情况下,ATR Projection考虑最近100根蜡烛的平均值的30%。这种灵活性使用户能够根据其偏好和每个资产的独特特征调整指标,提供更个性化的分析。
选择30%和100根蜡烛背后的逻辑:
对百分比和蜡烛数量的慎重选择旨在捕捉最近过去的相关动向,提供更精确的预测。这种战略性方法突显了价格有显著概率移动的区域,为交易员提供更明智的视角。
ATR Projection的优势:
1. 可定制的技术准确性:用户可以根据每个交易资产的特定条件自由定制指标。
2. 专注于高概率:通过仅关注最近100根蜡烛的平均值的30%,ATR Projection将注意力集中在可能性较高的移动上,优化了明智的决策制定。
3. 适应交易资产:该指标的灵活性允许适应不同的资产,提供根据每种金融工具的独特特征定制的分析。
此外,值得注意的是,ATR Projection对于创建交易机器人非常友好,使用

BigPlayerRange — 适用于沪深300和美元人民币的最佳MT5指标 探索 BigPlayerRange 的强大功能,它被认为是用于 沪深300、上证指数、USD/CNH 等资产的 MetaTrader 5 最佳指标 。该工具能精准识别机构主力的关键区域,帮助交易者进行高精度的技术分析。 指标工作原理: BigPlayerRange 绘制两个水平区域,通过成交量分析反映市场能量: 绿色区域 :买方防守位置,支撑价格。 红色区域 :卖方压制位置,形成阻力。 使用策略: 收盘价突破绿色区域上方 :可能开启上涨趋势,目标为上方区间。 收盘价跌破红色区域下方 :暗示下跌压力增强,目标为下方支撑。 价格停留在区间内 :行情震荡,等待突破信号。 核心优势: 机构活动区域识别 :提前发现主力进出场信号。 自动计算的目标价格 :提供两个明确的止盈位置。 回调概率分析 :优化风险控制,提升稳定性。 参数个性化设置: 自定义交易时间与成交量类型(Tick或真实成交量)。 使用机构逻辑提升日内交易效率。 推荐搭配

Make your decisions easier when rolling Covered Call. This robot provides you with information that aids in decision on how and when to roll your structure. It works for any asset in the spot market that has authorized options series on B3 (Brazilian stock exchange). Associate the robot with the asset you want to use for the Covered Call. How to use the robot: Set parameters for your current structure: Purchase price of the base asset in your structure. Code of the Call you used to build your st
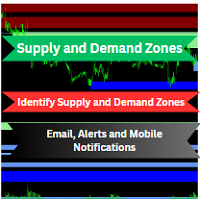
This powerful Indicator can automatically identify supply and demand zones and send you alerts, email and push notification on mobile whenever a new zone is created or when the price enters a specific zone.
This indicator integrates with any timeframe and chart or currency pair, ensuring its versatility across your trading endeavors. Supply & Demand Zones Finder(SDZF) indicator seamlessly identifies proven supply and demand zones, areas where price has consistently found support or resistance.
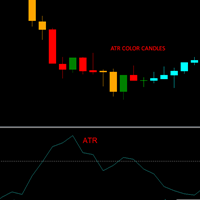
This indicator allows you to visually identify with a different color the candlesticks that exceed a certain limit of the ATR.
Just drag and drop it on the chart.
The user must enter the value of the ATR period.
The user must enter the value of the ATR limit with which he wants to identify the candlesticks.
In the colors tab, the user can select the colors with which to repaint the candles.
It is recommended that the first color always be None.
The second color corresponds to bullish c
FREE
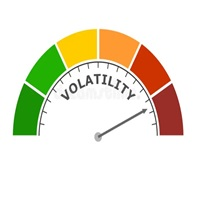
This indicator allows us to identify unusual volatility conditions.
If the ATR line is below the middle bollinger line, volatility is assumed to be below average. If the ATR line is above the middle bollinger line, volatility is assumed to be above average.
If the ATR line breaks the upper bollinger band, volatility is assumed to be high. If the ATR line breaks the lower bollinger band, volatility is assumed to be low.
FREE

Unlock the power of the market with our game-changing SMC Liquidity Zone Scanner – the ultimate tool that transforms your trading strategy! Say goodbye to uncertainty and hello to precision with our cutting-edge indicator, engineered to elevate your trading game. The SMC Liquidity Zone Scanner isn't just another tool; it's your gateway to mastering market liquidity, identifying critical break of structure points, and pinpointing support and resistance levels effortlessly. Powered by state-of-th

The indicator is designed to close positions on the market in time. For example: to take profits ahead of schedule if the price has not reached TakeProfit, and the market is turning around. The indicator analyzes the momentum, not the trend. He does not give any information about the trend. The indicator is well suited for finding divergence. The Ershov 38 Parrots indicator dynamically adjusts to the market and detects price movement impulses of medium and high amplitude. It almost does not rea
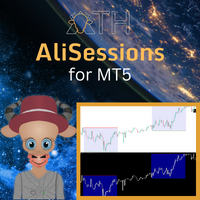
AliSession Highlight is an indicator that highlights a specific period of time according to your preferences. It can help you gain a clear vision of price movements into a specific session, the range of a session, and also to easily identify the high and low of the session. You can use it on any currency pairs, indices, and any timeframes. Settings: Start Hour: Set the hour to initiate the session highlight. Start Min: Set the minute for the start of the session highlight. End Hour: Specify the
FREE

AliPivot Points is a Meta Trader 5 Indicator that draws you the latest pivot points. You can choose from timeframes ranging from 1 Minute to 1 Month. Calculation methods for pivot points includes: Classic Pivot Points Camarilla Pivot Points Fibonacci Pivot Points Woodie Pivot Points You can personalize the line colors, style, and width to suit your preference. The indicator displays values on the right side of the chart. AliPivot Points values can also be utilized by developers for creating Expe
FREE
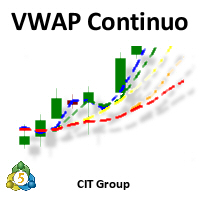
Apresentação:
- O Indicador "VWAP Contínua" da CIT Group é um indicador especializado na bolsa brasileira (B3). Objetivo:
- Especificamente desenvolvido para o perfil de pessoas que operam IntraDay.
Funcionamento:
- Calculado com base nos trades realizados durante o pregão, sendo atualizado a cada 1 segundo, tendo maior precisão dos preços Funcionalidades:
- Entrega de até 5 VWAPs simultâneas, onde as 4 primeiras são configuráveis, e a última é fixa sendo a diária - Opção para visualizar di
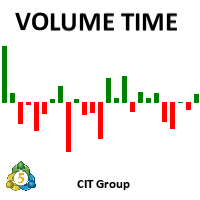
Apresentação:
- O Indicador "Volume Time" da CIT Group é um indicador especializado na bolsa brasileira (B3). Objetivo:
- Especificamente desenvolvido para o perfil de pessoas que operam IntraDay.
Funcionamento:
- Calculado com base nos trades realizados durante o pregão, sendo atualizado a cada 1 segundo, tendo maior precisão dos volumes Funcionalidades:
- Entrega de um conjunto de parâmetros como tipo de indicador (Financeiro, Volume ou Quantidade), estes podendo ser calculado (Unitário, U

Daily supply and demand levels for breakouts or reversals. Use on 1 Hour charts No nonsense, for the confident trader who trades price action supply and demand levels with daily projections without the fluff using 1 Hour charts. MT4 Version: https://www.mql5.com/en/market/product/108234 The Bank Trader Indicator is a sophisticated tool employed by institutional traders, particularly those in banking institutions, to navigate the complex world of forex markets. Rooted in the principles of daily
Apresentação:
- O Indicador "Agressão Acumulada" da CIT Group é um indicador especializado na bolsa brasileira (B3).
Objetivo:
- Especificamente desenvolvido para o perfil de pessoas que operam IntraDay.
Funcionamento:
- Calculado com base nos trades realizados durante o pregão, sendo atualizado a cada 1 segundo, tendo maior precisão da agressão
Funcionalidades:
- Entrega de um conjunto de parâmetros para calcular a média de agressão (Volume ou Quantidade), estes podendo ser calculado

ParabolicSAR is a multi-currency professional Expert Advisor that uses a variety of trading strategies in the foreign exchange market. Each of the individual strategies has gone through many years of development and testing on quotes with 100% simulation. Thanks to the use of several strategies for each currency pair, the Expert Advisor is successfully tested with 100% simulation of quotes over a long period of time. IMPORTANT! After the purchase please send me a private message to receive

note: this indicator is for METATRADER4, if you want the version for METATRADER5 this is the link: https://www.mql5.com/it/market/product/108106 TRENDMAESTRO ver 2.5 TRENDMAESTRO recognizes a new TREND from the start, he never makes mistakes. The certainty of identifying a new TREND is priceless. DESCRIPTION TRENDMAESTRO identifies a new TREND in the bud, this indicator examines the volatility, volumes and momentum to identify the moment in which there is an explosion of one or more of these da

TPSproTrend PRO 能够识别市场真正改变方向的时刻,并在行情开始时形成入场点。
你应该在价格刚刚开始波动时入场,而不是在波动已经发生之后。 指标 它不会重新绘制信号,并自动显示入场点、止损点和止盈点,使交易清晰、直观、有条理。 俄语说明 - MT4 版本 主要优势 信号不重绘。 所有信号均为固定值。 如果出现箭头 - 它不会再改变也不会消失了。
您可以基于稳定的数据做出交易决策,而无需承担虚假信号的风险。 现成的买卖入场点 该指标会自动确定最佳交易时机,并在图表上用箭头显示出来。
无需猜测或主观分析——只有清晰的信号。 自动止损和止盈区域 信号发出后,您立即会看到: 入口点 风险限制区(止损) 止盈区 这允许 在达成交易前评估交易条款 并遵守风险管理规定。 自适应止损(移动止损) 该指标采用智能交易支持逻辑,随着时间的推移…… 降低止损规模,从而降低初始风险。 支持更高时间框架(MTF) TPSproTrend PRO 显示: 来自更高时间框架的关键 MIN/MAX 修正 实际趋势变化 修正编号显示了运动的结构 交易很有帮助 顺应大
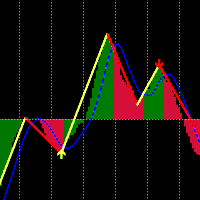
这个指标采用经典的MACD和Zigzag结合用于检测价格和指标的背离,并采用先进的人工智能技术检测背离的有效性。MACD是指标之王,Zigzag也是非常有用的指标,这个指标把两个指标结合起来,发挥两个指标的优势。检测背离存在概率的问题,通常背离了又背离,所有我们试图通过先进的人工智能技术判断背离的有效性,过滤掉无效的背离,然后通过多种方式提醒用户。 促销价:59$ 功能 1.MACD形式的Zigzag指标 2.检测价格和MACD指标背离 3.通过AI技术检测背离的有效性 4.背离信号预警提醒 5.背离信号手机提醒 6.背离信号邮件提醒 7.使用于多个周期 8.使用 强大的ONNX( Open Neural Network Exchange )模型格式
使用 底背离: 单MACD在下面交叉时,指标会检测出是否底背离,画出向上的箭头,并提醒
顶背离: 单MACD在上面交叉时,指标会检测出是否顶背离,画出向下的箭头,并提醒
输入参数 Fast EMA period = 12; Slow EMA period = 26;
Precision Trading Systems的PTS Demand Index代码
Demand Index是James Sibbet的创作,使用复杂的代码来简化对成交量和价格组合的解释工作。
理解成交量从未是一项容易的任务,但这个美丽的编程作品确实让这项工作变得更加轻松。
这个指标有几种方式可以使交易者和投资者受益匪浅。
背离(作为领先指标) 多年来,我研究了许多技术指标,我认为Demand Index是发现有意义的背离的佼佼者之一。
如果市场价格创出新高,而Demand Index没有创出新高,这被称为熊市背离。在我的网站上有几张极端背离案例的照片,可以帮助您理解要寻找什么。背离的差异越大,从趋势变化事件的预测角度来看,它就越重要。
趋势检测(作为滞后指标,带有内置的警报功能) 零线的交叉表示在您指定的长度内进行净卖出或净买入的迹象,必须注意,在这种情况下,该指标充当滞后指标,并且需要更长的长度以及一些平滑来提供有意义的结果。我建议为此目的使用至少>40的长度,添加一些平滑>5以减少虚假信号。
要启用零线交叉的警报,请单击指标属性、输入,使用警报= t

Trader! Don't you want to spend all day on your computer screen looking at quotes?
And do you want to receive stock buying/selling tips based on one of the most used indicators in FOREX on your cell phone?
Then discover the Vegas Tunnel
Support and product questions at the link below:
Support
This indicator searches for Buy and Sell SIGNALS in Stock Exchange Assets. It works on any asset on the market.
Select in the parameters which Fibonacci line the signal will be sent and then jus

The Datasource AC indicator is a technical analysis tool developed by the author based on the Accelerator Oscillator. Everyone knows the general principles of working with the AC indicator. Therefore, I will not describe them separately. I will focus on differences.
Differences are a purely technical implementation and expanded indicator. An important feature is that the indicator does not change its values even when using the closing price, since the indicator uses the safe calculation algori

This is a multi-timeframe indicator that detects and displays support and resistance (S&R) lines using the ZigZag indicator.
Features
The support and resistance lines are not redrawing. The indicator is capable of adding new support and resistance levels as they appear. Each S&R line has a tooltip that displays the price level and start time. Shows the start time, price level and number of touches of all S&R lines when pressing the shortcut Shift+I Save time for multi-timeframe analysis on tr

This indicator is great for trading on various trading pairs. The indicator itself uses mathematical linear strategies of augmented accuracy. It has many additional signals and basic signals. Many settings can be configured in the initial settings. There are lines and arrows on the graph for visualization. He displays his decision on a graph in the form of icons, text, and colored lines. There are only two types of main icons. In the tester it works fine by default in the settings. It is alread

Wyckoff sweep and order block detector I got tired of marking the same structure by hand every morning, so I wrote this. It looks for one thing only: the Wyckoff sequence that ends with a liquidity sweep and a pullback into the order block that started the move. When all the pieces line up, it draws them and tells you. That's the whole job. It doesn't predict, it doesn't score setups out of ten, and it won't tell you how much to risk. It marks structure that's already there and saves you the ey

--- StudentK Ict Smc Structure --- 1. Inner Circle Trading
2. Smart Money Concept
3. Structure
--- What are included in tool --- 1. Market Session Box
2. Kill Zone
3. High/Low
4. Imbalance
5. FU Candle
6. Thicker Wick + Doji Candlestick
7. StudentK's Structure Line
8. Pivot Point
--- Context --- StudentK is not indicated as a master or K Sir for knowledgeable person who claims for winning all the time. (But lots of traders should know the fact that it is rarely truth, especially in fluctuated
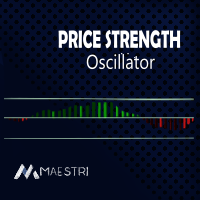
Introducing the "Bull vs Bear Price Strength Oscillator" Indicator: Your Key to Smart Trading Decisions! Are you looking for a trading tool that can provide you with a clear and visual representation of price trend strength? Look no further! The Price Strength Indicator is here to transform the way you analyze the markets and make trading decisions. Uncover Hidden Market Strength: The Price Strength Indicator is designed to help you assess the market's momentum with ease. It does this by evaluat
FREE
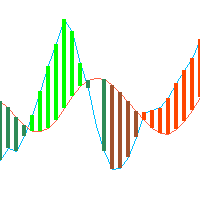
This is just a ADX with multi symbols, multi timeframes, and colors. features. different symbols and timeframes from the main chart. draw ADX and ADX moving average. easy to identify if ADX is above 25 or not. e asy to identify if ADX is above moving average or not. easy to identify the direction of the trend by color, not by DI line. unnecessary DI lines can be erased
FREE

This MetaTrader 5 indicator helps traders by identifying and marking two important levels on the chart:
1. Previous Day's High (PDH):
- The highest price reached in the market during the previous trading day.
2. Previous Day's Low (PDL):
- The lowest price reached in the market during the previous trading day.
How it Works:
1. Initialization:
- When you attach the indicator to a chart, it initializes by calculating the PDH and PDL based on the highest and lowest prices of the previo
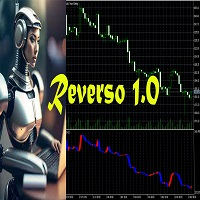
Reverso 1.0 est un Indicateur Technique basé sur la tendance. Cet Indicateur intègre une formule exceptionnelle qui permet de décider au croisement du signal et du prix de clôture d'entrer dans le marché.
Le timeframe indiqué est compris entre 2H et 1D.
Les symboles que je conseille sont les suivants:
BTCUSD-ETHUSD
XAUGBP-XAUEUR-XAUAUD-XAGEUR-XAUUSD
NZDJPY-GBPUSD-EURJPY-GBPJPY-USDJPY-CHFJPY-CADJPY-AUDJPY
精密指数振荡器(Pi-Osc)由Precision Trading Systems的Roger Medcalf开发
版本2经过精心重新编码,以在您的图表上加载速度非常快,还加入了一些其他技术改进,以提高体验。
Pi-Osc旨在提供准确的交易定时信号,旨在找到极端的耗尽点,这些点是市场被迫去触及,以清理每个人的止损单。
该产品解决了一个古老的问题,即知道极端点在哪里,这使得交易员的生活变得更加简单。
这是一个高度复杂的共识指标,与行业标准的振荡器相比,具有一些强大的区别。
它使用的一些特征包括需求指数、资金流动、RSI、随机指标、模式识别、成交量分析、标准偏差极端点以及不同长度上述各种变化的分歧。
乍一看,对于未经培训的人来说,它似乎与任何其他振荡器没有什么不同,但当与其他振荡器(如RSI或动量等)相对比时,这个指标的真正威力开始显现。
据我所知,没有其他振荡器可以频繁地精确指出顶部和底部,具有相同的定期效率。
精密指数振荡器由许多不同的数学方程组成,用于测量多个时间框架采样中的价格和成交量变动,从而高度准确地预测趋势可能发生转折的位置。
PTS Pi-Osc V2非

PTS - Divergence Buy Finder 由Precision Trading Systems制作
Precision Divergence Finder旨在精确找到市场底部,并经常成功。在技术分析中,挑选底部通常比挑选顶部容易得多,这个工具正是为了完成这个任务而设计的。在识别出牛市背离后,等待趋势上升再购买是明智的。您可以使用10或20个周期的最高点进场,或者使用15-30周期的移动平均线上升来识别趋势变化。 这个复杂的算法会实时逐根柱状图寻找并计算活跃的需求指数背离的数量。 该模型观察市场价格何时创出新低,而需求指数未创新低,从而产生背离。 该指标使用两个设置。 • 需求指数(DI)长度,它将为指标提供寻找的对象,并将为您选择的长度上的任何DI背离进行查找。 • 差异,这是[DI值现在]与[DI值长达200个周期以前]之间的背离量,对于它从各种回望期间找到的每个背离,它将在指标窗口中生成[1]输出。 最多检查20个周期,最大输出值将显示为20。 建议的设置 需求指数长度从15到100都可以使用,但最佳范围在20到60之间。 背离的差异为0.1至20

PTS - Divergence Buy Finder 由Precision Trading Systems制作
Precision Divergence Finder旨在精确找到市场底部,并经常成功。在技术分析中,挑选底部通常比挑选顶部容易得多,这个工具正是为了完成这个任务而设计的。在识别出牛市背离后,等待趋势上升再购买是明智的。您可以使用10或20个周期的最高点进场,或者使用15-30周期的移动平均线上升来识别趋势变化。 这个复杂的算法会实时逐根柱状图寻找并计算活跃的需求指数背离的数量。 该模型观察市场价格何时创出新低,而需求指数未创新低,从而产生背离。 该指标使用两个设置。 • 需求指数(DI)长度,它将为指标提供寻找的对象,并将为您选择的长度上的任何DI背离进行查找。 • 差异,这是[DI值现在]与[DI值长达200个周期以前]之间的背离量,对于它从各种回望期间找到的每个背离,它将在指标窗口中生成[1]输出。 最多检查20个周期,最大输出值将显示为20。 建议的设置 需求指数长度从15到100都可以使用,但最佳范围在20到60之间。 背离的差异为0.1至20

多重分形是 一種改良的比爾威廉斯分形指標,輔以高階分形,其大小相差四倍,類似於改變時間範圍。 與原廠終端指示器相比的優點: 方便 能見度 資訊內容 此指標很方便,因為您在工作時無需切換到不同的時間範圍。 可見度 - 在一張圖表中,您可以看到從小到中、大市場走勢的圖表結構。 資訊內容 - 直觀地我們獲得有關圖形的更多資訊。 現在,所有基於或基於多重分形指標的交易策略都將具有附加訊號。
此外,如您所知,分形可以充當支撐位和阻力位。 並且在一些交易策略中,顯示流動性水準。
交易者經常使用分形來確定價格變動的方向、支撐位和阻力位,並設定停損單。
如果價格無法突破先前的分形並在先前的分形後面鞏固,那麼市場就形成了橫盤。 祝您在交易中獲得豐厚的利潤。

Market Noise 市場噪音是確定價格圖表上的市場階段的指標,並且還可以在累積或派發階段發生時區分清晰平滑的趨勢運動和嘈雜的平坦運動。
每個階段都適合自己的交易類型:趨勢適合趨勢追蹤系統,平坦適合激進型交易。 當市場噪音開始時,您可以決定退出交易。 同樣,反之亦然,一旦噪音結束,您就需要關閉激進的交易系統。 有人可以使用兩種類型的交易策略進行交易,從一種策略切換到另一種策略。 因此,該指標在交易決策領域中扮演了好助手的角色。 任何價格變動都可以分為兩個部分 - 選定時間段內的總體價格變動以及該時間段內以價格波動形式出現的噪音。 同時,不同時期的不同市場可以表現出噪音和趨勢成分之間廣泛的相互關係(圖1)。 價格變動的噪音水平越高,辨別潛在趨勢的方向和強度就越困難。 因此,在這種情況下有必要使用較慢的趨勢識別方法。 另一方面,在低噪音水平的市場中,主要趨勢很容易確定,並且更快的確定趨勢的方法是合理的,確保價格方向變化的交易訊號的滯後最小。 為了確定市場狀態,使用高級效率比 (ER),該比率基於特定時期內總價格變動與噪音市場變動總和的指數比較。效率比 (ER) 可以變化從0到1。當

Magic Channel Scalper is a channel indicator for the MetaTrader 5 terminal. This indicator allows finding the most probable trend reversal points. Unlike most channel indicators, Magic Channel Scalper does not redraw. The alert system (alerts, email and push notifications) will help you to simultaneously monitor multiple trading instruments. Attach the indicator to a chart, and the alert will trigger once a signal emerges. With our alerting system, you will never miss a single position opening

Pick Trend is a reliable indicator without redrawing that will not leave any trader indifferent.
Pick Trend tool, which, based on mathematical calculations, analyze all five aspects: opening price, high, low, closing price and volume. Using the Pick Trend Forex indicator algorithm, you can quickly understand what trend is currently developing in the market. As a result of the calculations, the Pick Trend technical indicator is plotted on the chart in the form of a set of points for easy interp

IRush 指标使用流行指标 RSI(相对强度指数)的修改版本来寻找日线图或更低的条目。 该指标已使用以下主要交易品种进行设置和测试:AUDUSD、EURUSD、GBPUSD、USDCAD、USDCHF、 USDJPY。
使用该指标的自动交易是在专家顾问 Intraday Rush 中实现的。 该专家顾问可以打开、追踪和关闭其交易。 看看吧,它可能正是您正在寻找的!
IRush 的正确阅读
前一个柱的颜色表示当前柱的订单类型。 绿色 - 买入,红色 - 卖出,灰色 - 不确定性。 当前柱正在改变。 不建议根据当前柱线做出决定。
指标线显示超买和超卖区域。 接近70或更高,你不应该买。 接近30或更低,你不应该卖。
建议
在日线图上进行交易。 在一天开始时做出交易决定。
同一交易品种上类似信号的交易次数不得超过 2 次。
寻找不同交易品种的入场点并在不同交易品种上开仓交易。
每 1 笔交易的交易量为 250 美元存款的 0.01(更安全的水平是 1000 美元存款的 0.01)。
获取 300 (3000) 点,追踪 100 (1000) 点。
让您的交易“喘息”至
FREE

Entry and exit signals from the IFR2 Strategy by Larry Connors in his book "Short Term Trading Strategies That Work".
Larry claims this strategy correctly predicted the shortterm direction of the S&P 500 83.6% of the time from 1995 to 2007.
How does it work? The indicator activates the buy signal when the price closes above the 200-day moving average and the 2-period IFR closes below 5. The sell signal is the opposite.
How to use it? Enter the trade with a market order as soon as the candle
β指标,也被称为贝塔指标,作为对冲机构参考指标之一。 允许您测量个别资产(如货币和大宗商品)相对于市场组合、跨货币对、美元指数和股票指数的相对风险。通过了解您的资产与市场基准相比的表现,您将更清晰地了解您的投资风险状况。 显著特点: 准确的风险评估:β指标提供了资产相对于更广泛市场的风险的精确评估,帮助您做出明智的投资选择。 多样化策略:使用该指标优化您的投资组合,探索各种资产类别的多样化机会。 适用于多货币对冲:参与多货币对冲的投资者可以将该指标视为重要参考点。 实时见解:随时了解实时数据分析,以及时做出决策。 通过将β指标融入您的交易工具箱,解锁数据和风险分析的力量。开始做出更明智的选择,减少投资组合暴露于不必要风险。 β = 1:如果β等于1,表示资产的价格波动与市场整体的波动一致,即资产的价格变化与市场一致,通常意味着资产的风险与市场相当。 β > 1:如果β大于1,表示资产的价格波动比市场整体更大,即资产的价格变化波动较大,通常意味着资产更具风险。 β < 1:如果β小于1,表示资产的价格波动比市场整体更小,即资产的价格变化波动较小,通常意味着资产相对较低风险。 β = 0:
Corr指标,也被称为相关性指标,作为对冲机构参考指标之一。 用于度量两个或多个金融产品之间的关系程度。在金融领域,特别是在货币市场,相关系数常用来研究不同货币之间的相关性和相关程度。 相关系数通常表示为介于-1和1之间的数值。以下是一些相关系数的常见含义: 相关系数为1:这表示两个变量之间存在完全正相关,即它们的变动完全一致。在货币市场中,这可能表示两种货币汇率完全同向波动,通常不太常见。 相关系数为0:这表示两个变量之间没有线性相关性,它们的变动是独立的,一个变量的变化不会影响另一个变量。在货币市场中,这可能表示两种货币汇率之间没有线性关系。 相关系数为-1:这表示两个变量之间存在完全负相关,即它们的变动是完全相反的。在货币市场中,这可能表示两种货币汇率完全反向波动,也相对不太常见。 相关系数通常用于分析货币之间的相关性,以帮助投资者了解它们之间的关联程度。 例如,投资者可以使用相关系数来评估两种货币汇率是否倾向于朝着相同的方向波动,或者它们可能会在不同的市场情境下表现出相反的动向。 这有助于投资者更好地制定多货币投资策略,管理风险和把握机会。

Uses the built-in news calendar of the MT5 terminal or the Investing.com website (in the latter case, the Get news5 utility is required) Has the Scale parameter={100%, 110%, 125%, ...} to adjust the comfortable size of the text and control elements
Tells you in which direction it is safer to open positions 3 in 1: News + Trends + Forecast
News for the selected period: current and in tabular form
Actual trends for 5 customizable timeframes and trend reversal levels
Forecast of exchange rate mo

Fair Value Gap (FVG) Indicator: Master the ICT Method in Forex Trading
What Traders Are Saying: " Transformed my trading approach with its precise gap spotting ..." – J. Doe " The alert feature is a lifesaver, never miss a trading opportunity.. ." – Alex P. " A crucial tool for anyone following the ICT methodologies in Forex. .." – Samantha R. Unlock the secrets of price movement in the Forex market with the revolutionary Fair Value Gap (FVG) Indicator. Designed for precision and ease of use,
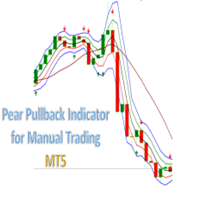
Grape PullBack Indicator for Manual Trading. Indicator (arrow) Type Strategy (Pullback) for all Symbols and Periodicity, Preferably from 30M periodicity. Can be used for manual trading. The indicator i s determined by strategies that is based on criteria for the location of candlesticks in the channel and for the Rsi, Atr, Fractal and Market facilitation index indicators. Its workspace corresponds to channel of 3 bars of Bill Willians with a channel extension . BUY when there is a Green A
Are you tired of the uncertainty that arises when your orders fail to stop at a specific line due to the spread? Look no further! Introducing our indicator that plots candlesticks based on the Ask price instead of the traditional bid-based chart commonly used in MQL4. With this indicator, you can say goodbye to the frustrations caused by the bid-based chart, as it provides you with a more accurate representation of market movements. By utilizing the Ask price, which represents the price at whic
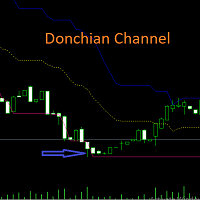
Harness the Power of Donchian Channels for Trend Trading
The Donchian Channel Indicator may your key to precision trading. With Donchian channels, you'll gain insights into market volatility, breakouts, and overbought/oversold conditions. This winning strategy is named after its developer, Richard Donchian.
How Does the Donchian Strategy Work? The upper band represents the previous period's highest high; The lower band represents the previous period's lowest Low; The centre band reflects
FREE

Dr. Trend is based on Market Trend Detection. With this Indicator anybody can easily understand the Market Trend and Trade accordingly. It will be very very helpful to Trade perfectly and increase the Accuracy Level.
Recommendation: Use this Indicator along with my another Indicator --->>> Dr. Trend Alert ; Use this Indicator along with my another Indicator --->>> My PVSR <<<--- Click Here ; Good_Luck
It can be used for: All Pairs: Forex, Cryptocurrencies, Metals, Stocks, Indices
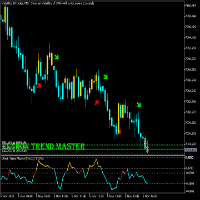
ULTRON TREND MASTER
This Indicator strategy works on any volatility market together with currency pairs and gold. It uses 2 files (Ultron Trend Master 1 and 2) Due to only uploading one file. Please also download Ultron Trend Master 1 free from comment section of this indicator . The purchased file is the main file with the strategy and should be used together with Trend Master 1 File.
The only indicator on the market that will be able to trade any Vix market together with any currency pair or

My PVSR is based on All Type of Pivot Points. Use this Indicator to get proper Support / Resistance Zone and Trade accordingly..
Recommendation: Use this Indicator along with my another Indicator --->>> Dr. Trend <<<--- Click Here ; To get the best output result feel free to contact me ; Best of Luck
It can be used for: All Pairs: Forex, Cryptocurrencies, Metals, Stocks, Indices etc. All Timeframe All Brokers All type of Trading Style like Scalping, Swing, Intraday, Short-Term, Long-
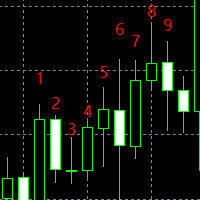
神奇九转, 顾名思义就是每当出现数字9时,行情就很大的几率会发生逆转,这时应该注意止盈。是一个很有效的指标。 在序列显示和形成过程中,一旦出现不符合触发条件的情况,则前面序列数字消失,本次九转序列结构不存在。如果连续九天都达到触发条件,九转序列结构形成,价格走势可能发生反转。
九转序列可分为上升九转结构和下降九转结构,也就是九转序列在买多和买空以及判断各种走势反转是都可以使用。 九转序列买入建仓,即下降九转序列结构形成时,价格走势将要发生转变,考虑建仓买入。 买入条件:连续出现九根K线,并且满足收盘价都低于前一根K线收盘价,当第8、9根K线满足上述条件时,九转序列形成,投资者准备买入建仓。
使用分时九转时需要注意两点: 1、极端行情时(连续上涨或下跌),九转序列失效; 2、当九转序列完全形成时,再进场操作(尤其不用刚出现数字8或9就入场,一定要完全形成之后才可以。)

介绍 SuperTrend MT5,一种尖端指标,旨在帮助交易者精准识别市场趋势。无论您是 forex、股票、加密货币还是商品交易者,这个强大的工具提供清晰的买入和卖出信号,使您能够做出明智的决策并最大化您的交易成功。 使用 SuperTrend MT5,您在交易策略中获得了显著的优势。用户报告称趋势检测的准确性得到了提升,使他们能够有效把握进出场时机。通过利用实时警报和可自定义设置,您可以适应市场变化并改善整体交易表现。 MQL产品安装指南 | 在 MT4/MT5 上更新已购买的MQL产品 | 常见故障排除指南 | 指标设置 / 指南 主要特点 缓冲区集成:将指标值暴露为可访问的缓冲区,以便与 Expert Advisor 进行基于信号的自动化交易。 快速且可回测:基于 MetaTrader 的本地 OnCalculate() 引擎构建,快速计算并与策略测试器兼容。 弹出警报:在信号事件上触发 MetaTrader 警报弹出窗口,确保您不会错过任何交易设置。 推送通知:实时向您的移动应用发送通知,让您随时随地监控交易。 电子邮件警报:提供信号事件的电子邮件通知,使您在离开终端时也能进
FREE

自己构建您的策略 这个工具允许您使用MetaTrader本机提供的所有指标以及从互联网下载的使用缓冲区显示数据的指标来开发自己的策略。 这个工具是您考虑将MetaTrader用于自动化交易策略的另一个理由。借助它,您可以以简单直观的方式创建自己的策略信号,使用任何MetaTrader指标。 我如何知道我的互联网下载的指标使用缓冲区? 很简单,只需运行此工具,它会自动发现您的指标拥有的所有缓冲区,并使它们可用于基于它们创建您的策略。 此工具可以自动识别您的指标是否具有缓冲区以及它们拥有多少数据缓冲区。您需要做的就是将缓冲区与正确的值关联起来。 MetaTrader本机指标如移动平均线、相对强弱指数(RSI)、随机指标(Stochastic)和移动平均收敛差离指标(MACD)等都非常容易使用,因为它们已经具有集成的缓冲区。但是,当涉及到从互联网下载的自定义指标时,了解哪个缓冲区与哪个数据相关是很重要的。让我们从头开始吧。 学习使用MetaTrader本机键盘快捷键: 快捷键 描述 CTRL+F 激活鼠标上的十字线,准确识别您正在引用的蜡烛图。 CTRL+D 显示指标缓冲区的数据窗口。 CT
FREE
通过 Keltner Channel MT5 增强您的交易体验,这是一种强大的指标,旨在帮助交易者识别市场波动和潜在的趋势反转。该工具非常适合希望在各种资产中完善其策略的新手和专家交易者。 Keltner Channel MT5 利用指数移动平均线和平均真实范围创建动态价格区间,帮助识别突破和评估市场趋势。通过提供清晰的视觉信号和警报,该指标使您能够在不依赖交易平台的情况下做出明智的交易决策。 MQL 产品安装指南 | 在 MT4/MT5 上更新已购买的 MQL 产品 | 常见故障排除指南 | 指标设置 / 指南 主要特点 缓冲区集成:将指标值公开为可访问的缓冲区,以便与 Expert Advisors 进行自动交易。 非重绘信号:信号仅在收盘柱上确认,确保准确性而不出现重绘问题。 快速且可回测:基于原生的 OnCalculate() 引擎构建,允许快速计算并与策略测试器完全兼容。 弹出警报:在信号事件上提供 MetaTrader 警报弹出窗口,确保您不会错过任何交易设置。 推送通知:实时向您的 MetaTrader 移动应用发送推送通知,适合随时监控交易。 电子邮件警报:在信号事件上
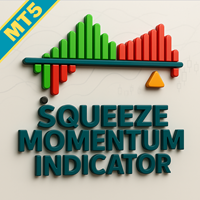
Squeeze Momentum Indicator MT5 是一个重要工具,适合希望增强市场分析和决策的交易者。专为 MetaTrader 5 设计,该指标识别波动性挤压和动量变化,使其对 forex、加密货币、股票和商品交易者来说不可或缺。 通过利用著名的 TTM Squeeze 策略,Squeeze Momentum Indicator MT5 帮助交易者准确定位潜在的突破机会和趋势变化,使他们能够有效地应对动态市场并优化交易策略。 MQL 产品安装指南 | 在 MT4/MT5 上更新已购买的 MQL 产品 | 常见故障排除指南 | 指标设置 / 指南 主要特点 缓冲区集成:将指标值暴露为可访问的缓冲区 — 可以被 Expert Advisor 直接读取以进行基于信号的自动交易。 快速且可回测:基于 MetaTrader 的本地 OnCalculate() 引擎构建 — 计算速度极快,并与策略测试器完全兼容,以进行历史回测。 弹出警报:在信号事件上触发 MetaTrader 警报弹出窗口,以确保您不会错过交易设置。 推送通知:实时向您的 MetaTrader 移动应用发送推送通知
方向波动性与成交量振荡器 MT5 是一款强大的交易工具,旨在通过结合方向性动量、波动性测量和成交量分析来增强您的市场分析。非常适合 forex、股票、加密货币和商品交易者,这个指标提供了有价值的见解,以优化您的交易决策并改善整体表现。 该指标能够识别动量变化和潜在反转,因此在交易社区中因其在波动市场条件下的有效性而备受推崇。用户报告称,在交易时机和准确性方面有显著改善,使其成为任何交易者工具箱中的必备工具。 MQL产品安装指南 | 在 MT4/MT5 上更新已购买的MQL产品 | 常见故障排除指南 | 指标设置 / 指南 主要特点 方向性动量分析:跟踪价格走势,以识别牛市或熊市趋势,确保精确的交易入场。 波动性测量:Plots 波动性上/下直方图,突出市场强度以适应策略。 成交量跟踪:显示成交量上/下直方图,揭示交易活动趋势,以增强决策。 弹出警报:在重要信号事件上触发 MetaTrader 警报弹出窗口,确保您不会错过任何设置。 推送通知:实时推送通知发送到您的 MetaTrader 移动应用,方便监控。 电子邮件警报:在信号事件上提供电子邮件通知,以便在您离开终端时进行远程监控。

Volume Profile for MetaTrader 5 Price movement alone does not explain where the market is actually traded .
What matters is where volume is built and how these areas shift over time. This Volume Profile displays the volume distribution directly on the chart , making it clear which price levels were accepted by the market and where rejection occurred. This allows structurally relevant zones to be identified and integrated into individual decision-making processes. The tool is designed for high pe
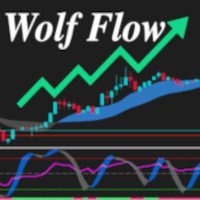
The Wolf Flow Indicator for MetaTrader 5 is the perfect solution for traders looking for instant clarity and precision in their market analysis. Simple to use and immediate to view, this tool offers you a complete overview of market dynamics in a single glance.
Strengths:
Absolute Simplicity: A clean and intuitive interface guarantees effortless use, even for less experienced traders. I mmediate and Rapid: Key data is presented in real time, allowing you to make instant decisions with c

Trend Channel is a Forex trend arrow indicator for identifying potential entry points. I like it, first of all, because it has a simple operating mechanism, adaptation to all time periods and trading tactics. Created based on a regression channel with filters. We display the signals of the Trend Channel indicator on the price function chart using a mathematical approach.
How it works: when the price breaks through the overbought/oversold zone (channel levels), a buy or sell signal is generated

Indicator Name : Fourier Transform Curve Indicator Description : The Fourier Transform Curve Indicator for MetaTrader 5 is a powerful tool that leverages Fourier analysis to depict curves directly on your price chart. It is designed to provide valuable insights into the underlying harmonic components of the price data. Parameters : Input Candle Count : This parameter allows you to specify the number of candles to include in the Fourier transformation calculation. A higher value will capture lon

The Tiko Trend indicator not only signals immediate buy or sell. It indicates the short term and long term trend. operations. The simplest way to use the indicator is to open a trade in the direction of the existing trend. The indicator allows you to study real and historical market trends in more detail! Shows the points for opening transactions to sell or buy, and also indicates the direction of the trend in: short-term and long-term periods. The analysis is based on the selected timefram
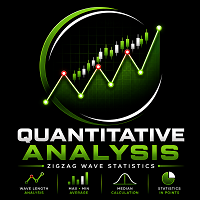
Here is a quantitative analysis indicator for any market. Its essence is simple - it calculates the magnitude of the waves of price movement from top to bottom, and gives the median value of the magnitude of the non-recoil trend. If the current value of the movement has exceeded this threshold by more than 10% (110% of the indicator indicator), you can enter a trade against the trend and work with a large margin of action based on ATR. Transactions are obtained with a high risk-reward ratio and

This Indicator represents the standard Heikin Ashi Candle converter from normal candles. They are applied on a different chart, so you can identify easily both prices. You can also change candles to your favourite colours. If you want to, you can use this indicator into an iCostum, so you can apply other indicators over this on, because there are excellent indicators combined with this type of candles
FREE
Quarterly Cycles
Quarterly Cycles is based on the Quarterly Theory developed by Daye ( traderdaye on X ). This is an aid to the user to find Cycles and it is NOT automatic detected, user can select AMDX or XAMD in each Cycle and it will be visually drawn on the chart. Quarterly Cycles: Yearly, Monthly, Weekly, Daily, 6 Hour (90 minutes)
– Yearly Cycle : The year is divided in four sections of three months each Q1 - January, February, March Q2 - April, May, June Q3 - July, August, Septemb

The GGP Wave Trend Oscillator MT5 Indicator is a volatility and momentum tool designed to help traders optimize their trading performance and providing traders find the most accurate market reversals. This indicator is MT5 conversion of the Indicator: WaveTrend Oscillator [WT] by “ LazyBear “ in Trading View website and some alert methods are added to provide real-time alerts when a trading signal is generated, in order to allow traders to act quickly and efficiently. When the oscillator is abov
MetaTrader市场是您可以下载免费模拟自动交易,用历史数据进行测试和优化的唯一商店。
阅读应用程序的概述和其他客户的评论,直接下载程序到您的程序端并且在购买之前测试一个自动交易。只有在MetaTrader市场可以完全免费测试应用程序。
