 MetaTrader 5
 专家
专家
 指标
指标
 程序库
程序库
 实用工具
实用工具
 窗口小部件
窗口小部件
 规则
规则
适用于MetaTrader 5的新技术指标 - 141
 技术指标的信号外汇和股票市场的开仓交易和平仓交易起着至关重要的作用。指标的本质就是一种交易品种的数学转换,旨在预测未来的价格变化。
测试技术指标可以更有利于预测市场行为并从中获利。
技术指标的信号外汇和股票市场的开仓交易和平仓交易起着至关重要的作用。指标的本质就是一种交易品种的数学转换,旨在预测未来的价格变化。
测试技术指标可以更有利于预测市场行为并从中获利。 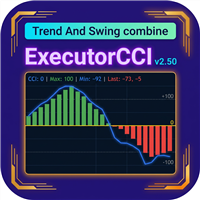
基于CCI的顺势原理,改良使其成为即可辨别趋势的反转,即在配合 ( Executor Trend Indicator ) 指标趋势行情识别后用来确认走势的指标。
特征 绿色 、红色立柱体部分为当前周期下的趋势头发展或空头发展. 蓝色线与绿柱同上为多头:蓝色线上达 100 绿柱上行过零轴,确认多头发展. 蓝色线与红柱同下为空头:蓝色线下达-100 红柱下行过零轴,确认空头发展. 右侧看板,给出的是当前走位数字提醒,同时给出了当前趋势是涨、是跌的提醒,以及给出了可入场的区域提醒。 使用 作趋势交易者建议在1H周期下使用 ; 作快进快出震荡交易者建议在1M、5M周期下使用 ; 配合使用 与 ( Executor Trend Indicator ) 指标联合使用,确认趋势反转走势, ( Executor Trend Indicator ) 多头走势时确认 ExecutorCCI 的绿柱是否 上行过零轴。空头反之。
这一改进后的基于CCI的指标能够清晰地展示趋势发展和反转,使其成为趋势跟踪和反转交易策略中的宝贵工具。
FREE
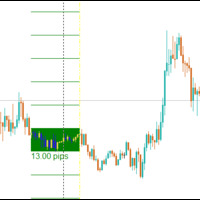
The Central Bank Dealers Range (CBDR) is a key ICT concept, used to project potential highs and lows for the day based on market conditions during a specific time window. The CBDR is utilized to forecast price movements in both bullish and bearish market conditions. By identifying this range, traders can better anticipate the price levels that may form as the day progresses.
CBDR and Standard Deviation A key feature of the CBDR is its application of standard deviation , a statistical measure u
FREE
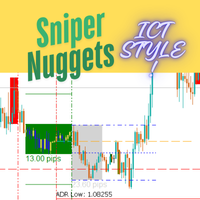
!!!!!!!! Sniper Nuggets !!!!!!!!
Sniper Nuggets is an all-in-one indicator for many things ICT style. It includes the following functionalities: Custom periods : which allow you to set custom daily period start and end times according to your taste. ADR Markers: which plots the average daily range. Worktime: which plots the various boxes on the chart for Asia range (including its high, low and midpoints, standard deviation predictions ), London open, New York open, CME open and London close.
FREE

Fibomathe Indicator: Support and Resistance Tool for MT5 The Fibomathe Indicator is a technical analysis tool designed for MetaTrader 5 (MT5) that assists traders in identifying support and resistance levels, take-profit zones, and additional price projection areas. It is suitable for traders who use structured approaches to analyze price action and manage trades. Key Features Support and Resistance Levels:
Allows users to define and adjust support and resistance levels directly on the chart.
FREE
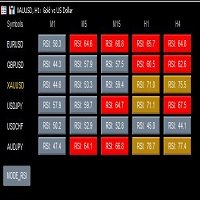
这是一个mt5版本的强大的多周期、多货币对、多指标监控指标工具,主要功能包括: 1.监控多种指标实时情况,可监控的指标包括RSI、MACD、MA和STO。 2.监控多种货币对, 可 自定义 添加或者删除货币对,指标自动更新。 3.监控各货币对多个周期。 4.点击后可直接切换到需要查看的图表和周期。 5.点击监控模式按钮可自由切换需要监控的指标类型:包括RSI模式,MACD模式,MA模式和STO模式。 1)RSI模式:RSI数值超过60显示红色,低于40显色蓝色;超过70和低于30显色超买超卖颜色。 2) MACD模式: DIF> DEA时,显示上涨趋势; DIF< DEA时,显示下跌趋势。 3) MA模式: MA小周期 > MA大周期时,显示上涨趋势; MA小周期< MA大周期时, 显示下跌趋势。 4)STO模式: %D>K线时, 显示上涨趋势; %D<K线时, 显示下跌趋势。

API BullBearPower mtf MT5 Designed for traders who rely on BullBearPower, this tool provides a multi-timeframe (MTF) view of BullBearPower, helping you identify possible dominant trends. Key Features: Multi-Timeframe Analysis – Analyze BullBearPower across different timeframes in real time. Dynamic Color Changes – Identify possible BullBearPower per individual timeframe with color changes. Volume Integration – Get a picture of possible trend strength with BullBearPower volume of each time

MultiVision Dashboard – Monitor Multiple Markets at a Glance.
The MultiVision Dashboard is an advanced, user-friendly MQL5 indicator that allows traders to monitor multiple symbols and timeframes simultaneously in a single, intuitive dashboard. It's designed to simplify market analysis by presenting essential data clearly, helping traders quickly identify opportunities and make better trading decisions.
Key Features
Flexible Symbol & Timeframe Selection
Customize the dashboard with your prefe
FREE
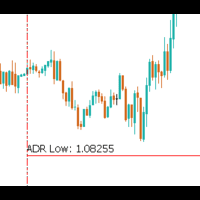
The Average Daily Range (ADR) is a powerful tool for traders, especially those focused on intraday and scalping strategies. It provides valuable insights into the expected price movement for the day and how price action is behaving relative to historical trends. The ADR indicator shows the following key information: Today's ADR : The typical range of price movement for the current trading day, based on historical data. 3x Today's ADR : Three times the current ADR, showing potential price moveme
FREE

Volume Above Average Indicator - MQL5 Introduction The Volume Above Average Indicator is a custom indicator for the MetaTrader 5 (MQL5) platform that helps traders identify the current trading volume compared to the historical average. The indicator uses three different sensitivity levels to classify volume into weak, medium, and strong, providing a clear visualization of market momentum. Key Features Displays trading volume in a separate window. Compares the current volume with the historical a
FREE

CFN - Multi MA & EMA Indicator for MT5 – with Alerts Take your chart analysis to the next level with the Multi MA & EMA Indicator for MetaTrader 5 – a versatile, efficient tool designed for traders who rely on Moving Averages and Exponential Moving Averages to interpret trends and make smarter trading decisions. Key Features: Supports up to 5 Moving Averages (MA) & 5 Exponential Moving Averages (EMA):
Easily plot and manage up to 10 customizable averages directly on your MT5 charts.
FREE

# Power Assisted Trend Following Indicator
## Overview
The PowerIndicator is an implementation of the "Power Assisted Trend Following" methodology developed by Dr. Andreas A. Aigner and Walter Schrabmair. This indicator builds upon and improves J. Welles Wilder's trend following concepts by applying principles from signal analysis to financial markets.
The core insight of this indicator is that successful trend following requires price movements to exceed a certain threshold (typically a mul
FREE


A powerful trend-following tool that uses ATR-based volatility to identify market trends across multiple timeframes . This enhanced version allows you to overlay the SuperTrend of a higher timeframe directly on your current chart, helping you align your trades with the dominant trend. How It Works The indicator calculates dynamic support and resistance levels using Average True Range (ATR) : Upper Band = Source Price + (Multiplier × ATR) Lower Band = Source Price - (Multiplier × ATR) In an uptre

AdaptiveMomentumCCI Indicator
The AdaptiveMomentumCCI is a custom technical indicator for MetaTrader 5 that enhances the traditional Commodity Channel Index (CCI) by incorporating adaptive period adjustments, momentum analysis, and signal filtering. It calculates a smoothed CCI based on a user-defined price source (e.g., HLC/3, OHLC/4, or close), with its period dynamically adjusted using the Average True Range (ATR) to reflect market volatility. The indicator features a dual-line system with

Mini Índice Composition: A Revolução na Análise do Mini Índice! O Mini Índice Composition é um indicador inovador que monitora em tempo real as principais ações que compõem o mini índice, trazendo uma visão quantitativa poderosa sobre o fluxo de ordens do mercado! Como Funciona? Diferente de outros indicadores que utilizam apenas dados históricos, o Mini Índice Composition faz uma leitura ao vivo das ordens que entram e saem das ações, pesando o impacto direto no mini índice. Com

This is a true trend lines indicator for MT4/MT5.
This indicator draw real trend lines.
Usually the trend line is drawn as a solid line.
The next trend line that is likely to be valid is drawn as a dotted line.
The most recent invalidated trend line is drawn as a dashed line.
Three-touch lines is drawn as a bright colors.
If the starting point of the trend line is new, the blue line is displayed(call shortline),
if it is old, the gold line is displayed(call longline).
The number of bars border

Trend magic indicator uses cci and atr to create buy and sell in the market . this a a line that changes its color when any of the conditions occur ie buy and sell . I find the indicator given you a bit of a better entry when you change the parameters to CCI=20, ATR=100, ATR MULTIPLIER= 2.
Set up entry just above the indicatror afetr a retracement. Set your stop loss a 20 cents to a dollar (depending on share size) below your entry. Be ready to enter a new position above indicator again if you
FREE

### Introducing the Price Action Ultimate Suite – The Ultimate Trading Tool for Professional Traders!
Are you searching for a powerful tool to elevate your Price Action trading strategy? Look no further than the **Price Action Ultimate Suite** – a comprehensive and intelligent indicator for MetaTrader 5 (MT5) – designed to be your trusted partner in conquering the financial markets! Packed with advanced features and user-friendly functionality, this indicator helps you identify key price patte
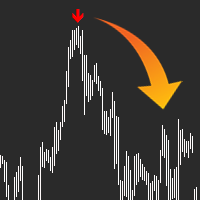
QUICK OVERVIEW: Use AI to predict the markets with AI Arrow, the ultimate trading tool, let it manage the probabilities and send you a simple signal in the form of an arrow, ready to trade, no complex configurations. The indicator will analyze the market and let you know when a potential movement will happen, sometimes it takes some extra bars for the movement to happen as it can't predict the exact top/bottom every time. Arrow will appear at the start of a new bar and alert you, so you have ti

Buy Signal Indicator This indicator generates a Bu y Signal when a potential upward movement is detected. A G reen Arrow appears below the price chart, indicating a possible entry point for a long position. The signal helps traders identify moments of strength in the market.
TIP:- USE 1 HOUR OR BIGGER TIMEFRAMES FOR BETTER RESULTS. TRAIL STOP LOSS BY USING NEAREST SWING HIGHS AND LOWS. NOTE:- THIS INDICATOR GIVES ONLY BUY SIGNALS FOR SELL SIGNAL USE MY OTHER INDICATOR.

Sell Signal Indicator This indicator generates a Sell Signal when a potential downward movement is detected. A Red Arrow appears above the price chart, indicating a possible entry point for a short position. The signal helps traders identify moments of strength in the market.
TIP:- USE 1 HOUR OR BIGGER TIMEFRAMES FOR BETTER RESULTS. TRAIL STOP LOSS BY USING NEAREST SWING HIGHS AND LOWS. NOTE:- THIS INDICATOR GIVES ONLY SELL SIGNALS FOR BUY SIGNAL USE MY OTHER INDICATOR.

Parabolic SAR + Deviation [BigBeluga] is an enhanced Parabolic SAR indicator designed to detect trends while incorporating deviation levels and trend change markers for added depth in analyzing price movements. Key Features: > Parabolic SAR with Optimized Settings: Built on the classic Parabolic SAR, this version uses predefined default settings to enhance its ability to detect and confirm trends. Clear trend direction is indicated by smooth trend lines, allowing traders to easily visuali

大多数交易者 看到 吞没形态蜡烛。 很少有人知道如何盈利地交易它们。 Engulfing Pro Trader 为您提供简单明了的信号和真实数据——交易、胜率、利润——让您自信地交易反转。没有希望,只有您需要的真实数字。在 Real Trades,我们向您展示真相,而不是梦想。 您喜欢看到吞没策略的现实吗?给我们一个五星评价,并 私下联系我 ,即可获得我们 Real Trades 的独家免费产品作为感谢!
查看我们的其他产品 ,获取更多真实策略,并 加入 Real Trades 社区 ,以自信交易并与真实交易者联系! 这个指标将经典的吞没形态转化为为您服务: 清晰信号:在您的图表上绘制买卖信号,包含多达3个止盈水平和止损。 杀伤区时间: 限制信号出现在高概率交易时段,以提高胜算。 实时统计面板:跟踪交易次数、胜率、风险回报比和赚取的点数——没有猜测,只有真相。 智能过滤器:ATR 大小过滤器和信号距离设置,剔除虚假形态。 实时警报:无论您身在何处,绝不错过任何形态。 亲眼见证!下载演示版,体验 Engulfing Pro Trader 的强大功能。
FREE

PUMPING STATION – 您的专属“全包式”交易策略
我们为您推出PUMPING STATION —— 一款革命性的外汇指标,它将使您的交易变得更加有趣且高效。这不仅仅是一个辅助工具,而是一套完整的交易系统,具备强大的算法,帮助您开始更加稳定的交易。 购买本产品,您将免费获得: 专属设置文件:用于自动配置,实现最大化性能。 逐步视频教程:学习如何使用PUMPING STATION策略进行交易。 Pumping Utility:专为PUMPING STATION打造的半自动交易机器人,让交易变得更加方便和简单。 购买后请立即联系我,我将为您提供所有额外资源的访问权限。 PUMPING STATION如何工作: 趋势监控:能够即时识别市场趋势方向。趋势是您最好的朋友。 进场信号:图表上的箭头会提示您何时进场以及交易方向。 明确的交易目标:指标会自动识别最佳的平仓时机。 回调交易:内置的基于布林带的价格通道可检测修正结束并发出新趋势开始的信号。 效率分析:如果当前设置效果较差,系统会自动提示。只需调整PUMPING STATION,即可获得最佳性能。 交易資產:我推薦我親自測試過的

Pips Chaser 指标的开发是为了补充你的手动交易。该指标可用于短线剥头皮和长线波段交易 // MT4 版本
特点 无重绘指标 当新数据到来时,该指标不会改变其数值 交易货币对 任何货币对 时间框架 H1是最好的,但你可以将其适应于任何时间框架 交易时间 全天候 Buffers Buy Buffer: 0 / Sell Buffer: 1
要求
使用一个ECN经纪商,并为一些头寸提供严格的点差是必须的。 不要在中等影响和高影响的新闻发布时间进行交易。
如何安装
将该指标附加到首选的交易对上(推荐H1)。
配置
指标设置 。 在这里你可以修改指标的参数以采用最适合你的策略。 附加设置 。 在这里你可以改变指标不同部分的颜色。你还可以改变警报的配置。
如何使用它
当你在图表中看到箱体突破的箭头时,你就必须进行买入或卖出交易。 当蜡烛触及趋势线时,你必须关闭交易。 当趋势线和狙击线在同一水平上相互接触时,这将是一个理想的利润水平。 当交易线远离对方时,在这种情况下,该交易将给你带来更多利润。而当交易线小于对方时,在这种情况下,该交易将给你带来较少的利润。 你必须在突破框
FREE
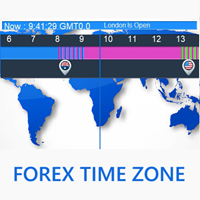
Forex Time Zone 简介 欢迎使用全新的免费专业工具—— Forex Time Zone !专业交易员深知时间在外汇交易中的重要性。每一秒,全球的一些市场开放,而另一些关闭,这会影响市场波动性以及个别货币的走势。此工具能够帮助交易员轻松了解当前哪个市场正在开放,以及当前的时区。 它是如何工作的? 只需根据您的国家选择您的时区,并将指标添加到图表中。您会看到一个水平的彩色框,每个市场用不同的颜色标记。如果两个市场重叠,框将显示两个市场的混合颜色。此外,还有一条竖直的蓝线,显示基于您所选时区的当前 GMT 时间。蓝线顶部的短标签会告诉您当前哪个市场开放。例如,它可能会显示“伦敦和东京现在开放”。 每个国家的旗帜表示什么? 在水平导航栏中,有四面代表每个市场开盘的国家国旗。 竖直的蓝线是否与图表时间或经纪商时间相关? 不,竖直的蓝线显示的是您所选时区的当前时间。此产品是独立运行的,与经纪商时间无关。 我们还有什么? 我们还提供了 Session Break Out 产品——这是由 Forex Time Zone 衍生出的高级版本。此工具专为突破交易策略设计,可将您的交易提升到新
FREE

UzFx 总止盈/止损与计时器 v3.0——一款功能全面的交易管理指标,显示以下内容: 总止盈——所有持仓的止盈值总和(以美元、点数或点为单位)
总止损——所有持仓的止损值总和(以美元、点数或点为单位)
浮动盈亏 - 包含掉期费用的实时盈亏(颜色标示:绿色表示盈利,红色表示亏损)
K线计时器 - 倒计时至下一根K线收盘
获取专业交易员面板 [ 点击此处 ] 您的完整交易监控解决方案
主要功能:
止盈和止损可分别选择单位(点差或点数)
支持以货币($)或点差/点数显示数值
仅计算已开仓交易(忽略挂单)
颜色、字体大小及图表位置均可完全自定义
布局简洁、间距合理,带有专业品牌标识
特别适合:
跨多头寸风险管理
快速掌握总风险敞口
利用K线计时器把握进出场时机
监控实时浮动盈亏
设置后无需操心——同时适用于所有交易品种!
“一目了然,掌握总风险与收益”
FREE

UzFx-本地货币转换器-MT5是一款功能强大且易于使用的指标,专为希望同时追踪美元和本地货币浮动及每日盈亏(P&L)的交易者设计。该工具通过用户自定义汇率提供实时转换功能,帮助交易者更有效地可视化交易表现。
核心功能
• 实时显示美元与本地货币的盈亏数据 每日盈亏计算——追踪当日已平仓交易的盈亏数据 支持将盈亏转换为指定本地货币(如PKR、INR、AED等) 汇率自定义——手动设置汇率实现精准转换 每日亏损限额监控——触及日亏损限额时自动预警 午夜自动重置——每个交易日自动清零当日盈亏数据。 可调整界面布局——修改图表上的字体大小、颜色及位置。
为何使用此指标?
避免不必要的手动换算与计算错误。 清晰呈现未平仓及已平仓交易的盈利状况。 通过追踪每日止损限额实现更优风险管理。
注:本指标不执行交易操作,仅用于盈亏监控与货币转换。
FREE

在交易世界中,每一个跳动都可能是一个新故事的开始,拥有一个可靠的盟友至关重要。TrendVarianceSpectrum 不仅仅是一个交易机器人;它是您在波动市场中的向导。凭借多年的经验构建,并在超过 25 年的数据上进行训练,它结合了数学的优雅与现代技术的力量。 TrendVarianceSpectrum 的主要优势: 极低回撤 :TrendVarianceSpectrum 以极低的回撤运行,使其成为最稳定的解决方案之一,适合重视可靠性的交易者。 适应波动性 :该系统在 EURUSD、XAUUSD 和 EURJPY 等具有挑战性的工具上表现出色,即使在高市场波动期间也能展现韧性。 跨时间框架的多样性 :无论是 M30、H1、H2、H3 还是 H4,TrendVarianceSpectrum 都能轻松适应您的交易风格。 尖端技术 :其核心结合了短期开盘方差分析与长期波动指标,能够精确识别市场入场点。 数据驱动的可靠性 :基于广泛的历史数据训练,该系统能够有效应对各种市场情景。 TrendVarianceSpectrum 不仅仅是一个工具;它是您的交易伙伴。它结合了精确性、稳定性和优雅性

VeMAs 是一款创新型交易工具,旨在通过分析交易量动态和市场结构来改进您的交易策略。 无论您是初学者还是经验丰富的交易者,VeMAs 都能为您提供优势。 Version MT4
Here are some blogs on the VeMAs indicator
市场容量和结构是需要关注的几个主要方面。
VeMAs 使用先进的算法评估交易量变化和价格走势。它专为追求准确性和效率的交易者设计。
该指标分析资产交易量的价格行为,并确定理想的入市点。
有了准确的切入点,您就能领先于潜在的变化。
VeMAs 应用选项和一些观察结果。这将帮助您了解如何使用该指标,即使您是第一次使用。--- https://www.mql5.com/zh/blogs/post/761144
主要功能:
成交量动量计算: 通过评估价格变化与成交量之间的关系,该指标可检测到显著的动量变化,使交易者能够准确定位进场和出场点。 趋势方向过滤器: 该指标包含一个价格过滤器,可识别当前的市场趋势。这样,您就可以根据市场大方向进行交易,从而提高成功的概率。 无交易信号: 柱状图上没有彩色背景(绿色或红色),表明

Introduction to the Manual Backtesting Indicator on MQL5 The MetaTrader platform provides an excellent backtesting tool for evaluating Expert Advisors (EAs). However, when it comes to manually backtesting a strategy to assess its effectiveness, this tool has some limitations: You cannot manually draw zones or trend lines while in backtesting mode. You cannot switch timeframes to check time alignment. For example, if my strategy requires additional confirmation from a higher timeframe (HTF), this

TimeView Pro – 可自定义的本地时间显示指标 (MetaTrader 5) 概述
TimeView Pro 是一款完全可自定义的时间显示指标,可根据用户的电脑时间或所在国家的时间自动调整。与其他类似指标不同,TimeView Pro 提供更高级的自定义功能,让交易者在不影响图表清晰度的情况下精准查看时间。 主要功能 烛台对齐 (默认启用) – 时间标签自动对齐至最近的K线。 快捷显示/隐藏 – 使用 Click Chart + H 快捷键快速开关时间显示。 可调节线条 – 可选择显示或隐藏 水平线 (默认关闭) 和 垂直线 (默认开启)。 自定义外观 – 支持 字体大小、背景颜色 及其他外观调整。 边界保护 – 避免时间标签在图表边缘重叠或被遮挡。 灵活定位 – 可选择 顶部、中间、底部或自定义位置 。 额外信息显示 – 选项包括 服务器时间、本地时间和价格显示 ,用户可自由选择是否开启。 适用场景 适合需要追踪不同时区交易的交易者。 帮助交易者清晰查看市场交易时间。 提供直观、整洁的时间显示,提升图表可读性。 为什么选择 TimeView Pro? 完全可自定义 – 可

这是您停止猜测并理解策略的机会。 已跟踪281笔交易 | 64%的胜率 | 历史数据中70%的风险回报比 这些不仅仅是数字——它们是展示此策略如何运作的真实统计数据。如果您正在寻找更聪明交易的方法,这个工具可以带您实现目标。 您喜欢看到吞没策略的真实情况吗?购买后 联系我们 ,我们将免费为您提供我们的另一款产品。
查看我们的其他产品 ,了解更多真实策略,并 加入Real Trades社区 ,以自信交易并与真正的交易者联系! 基于 烛台范围理论(CRT) 打造的经过验证的工具,旨在精准且一致地识别流动性激增。该策略跟踪流动性掠夺,使用前一根K线的范围预测价格走势,并通过额外确认过滤掉虚假信号。 这个指标如何帮助您: 识别基于流动性的交易——带有止损和止盈的买入/卖出信号。 入场前确认——通过要求先发生流动性抢夺,避免虚假设置。 提供实时交易统计——随时了解您的表现:胜率、风险回报比和点数。 关注关键市场时段——仅在概率对您有利时交易。 保持您更新——每个交易设置的实时警报。 额外过滤器——通过附加确认获得更好的信号。 如果您厌倦了交易却不了解策略的概率,我们的工具可以帮到您。 亲眼见证!
该指标主要用于手动交易。它会分析近期价格走势,并使用其自有算法进行处理。 基于此分析,该指标计算出最重要的价格水平。这些水平将价格值划分为三个区域:买入、卖出和中性。只有当价格位于相应区域时才应开仓。如果价格位于中性区域,则应考虑平仓或将其调整至盈亏平衡点。该指标还提供自身的开仓建议。这些点在图表上以点表示。
指标设置: Indicator period – 指标周期; Type – 此参数允许您选择加权系数的类型; Sensitivity – 指标敏感度(有效值为 0-8); Color of levels 和 Line style – 允许您选择指标水平的颜色和样式; Signal settings – 指标信号设置。
使用指标。选择时间范围(我推荐 M5-D1)。设置所需的指标周期。该指标首次启动可能需要一些时间。这是因为该指标需要统计数据,这些数据是根据历史数据收集的。该指标还包含警报选项和发送消息的功能。然而,在某些情况下,该指标可能会非常频繁地发出信号——大约每分钟一次。

VANGARD Trade Info MT5 – 高级交易信息与全面控制! VANGARD Trade Info MT5 是一款 必备工具 ,适用于希望 实时监控交易 的交易者,具备 隐私设置、自定义界面和智能保证金警报 。该指标提供 详细的交易信息 ,包括持仓、保证金水平、掉期费用和交易成本,并以 优化的界面 呈现,助您更快、更高效地做出交易决策。 为什么选择 VANGARD Trade Info MT5? 实时详细信息 – 随时查看您的持仓、盈亏 (P&L)、保证金水平、掉期费用和交易成本。 可定制隐私设置 – 可选择显示或隐藏账户余额、保证金和净值,保护您的隐私。 自定义界面 – 调整字体、颜色和样式,以适应您的视觉偏好。 智能保证金警报 – 当保证金水平低于设定值时,通过 MetaTrader 警报、PUSH 手机通知和电子邮件 及时提醒。 超轻量级优化 – 运行流畅,不会影响 MetaTrader 5 的性能。 主要功能 持仓信息面板 :快速查看每笔交易的手数、盈亏 (P&L) 和掉期费用。
交易统计摘要 :显示总交易数、

Smart Detector — 掌握Smart Money和ICT的秘密!
想像大型机构一样交易吗? Smart Detector揭示了**“聪明资金”(Smart Money) 和 Inner Circle Trader(ICT) 策略的奥秘。 这款适用于MetaTrader 5的指标能够 即时识别关键区域**,发现 市场操盘手留下的痕迹 ,如 强大的订单块(Order Blocks) 和 隐藏的公平价值缺口(Fair Value Gaps) 。 找出流动性藏身之处,并将其转化为你的交易优势! Smart Money: 通过 积累区和突破区 跟踪银行和对冲基金的行为。 ICT: 深入市场结构,捕捉 反转点 和 散户陷阱 。 简单高效: Smart Detector让复杂变得简单,提供清晰的交易信号:
红色图形 – 卖出
绿色图形 – 买入
无需猜测,只给你 精准的交易指引!
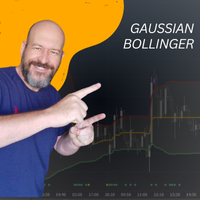
高斯布林带结合高斯移动平均线 ️ 用一款将高级数学与技术分析实用性完美结合的创新指标,革新您的交易策略! ️ 无论您是初学者还是经验丰富的交易者, 高斯布林带 都能帮助您 提升市场分析的深度 。这一独特指标用高斯移动平均线 (GMA) 替代传统移动平均线,生成的布林带对市场的实际条件更加 敏感且适应性强 。 高斯布林带的亮点 ️ 独特的高斯移动平均线 :以高斯分布为基础,高效平滑价格数据,提供清晰准确的趋势识别。 ️ 可调节的参数 :可灵活调整周期、标准差和偏移量,以适应不同的资产和市场条件。 ️ 简单与复杂的融合 :既适合初学者,也能满足高级交易者对精准分析的需求。 如何使用及策略推荐 “突破外带,回归内带”策略 :当价格 突破外带 后又 回到内带 时,表明价格可能回归到中线,这是一种有效的入场机会,目标可设为中线位置。 超买和超卖区域捕捉 :利用上下轨识别 超买和超卖 区域,这些区域通常是高波动时的反转信号。 识别市场盘整阶段 :当布林带变窄时,这通常预示市场进入盘整,之后可能会出现剧烈波动,提前准备抓住机会。

# Wilders Volatility Trend Following Optimised 指标文档
## 介绍
Wilders Volatility Trend Following Optimised 指标是一种用于 MetaTrader 5 的复杂趋势跟踪技术分析工具。它实现了一个高级自适应趋势跟踪系统,该系统能够动态适应市场条件,为交易者提供清晰的入场和出场信号,同时自动计算最佳止盈和止损水平。
该指标专为遵循基于趋势的策略的交易者设计,旨在通过响应市场波动性变化的自适应风险参数来优化交易管理。
## 主要特点
- **自适应趋势跟踪** :自动识别并跟踪市场趋势 - **动态仓位管理** :计算最佳入场、出场、止损和止盈水平 - **基于波动性的参数** :使用真实波幅均值(ATR)来适应市场波动性 - **自适应加速因子(AFX)** :实现加速因子之间的 S 型曲线过渡 - **平滑止盈计算** :使用双曲正切函数实现自然利润目标过渡 - **追踪止损** :实现智能追踪止损机制,锁定利润 - **视觉反馈** :提供全面的视觉元素,包括箭头、线条和文本注释

Indicador gratuito para Metatrader 5 que muestra en pantalla una caja rectangular para cada una de las sesiones de mercado "Londres, New York y Tokio". Se puede establecer la zona horaria de forma automática o mediante un valor de offset. Parámetros de configuración para cada una de las sesiones. Visible / No visible Hora Inicial Hora Final Caja sólida o transparente. Estilo del borde de la caja. Grosor del borde de la caja. Color.
FREE
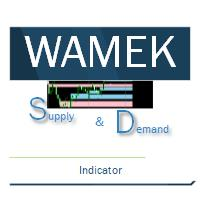
解锁机构级交易策略,使用我们的先进供需区指标! 利用我们的 供需区指标 ,掌握机构交易策略,精准识别金融市场中的 高胜率买卖点 !通过定位机构资金的买入和卖出区域,该指标让您能与市场大玩家同步交易,把握重大趋势反转,提升盈利机会! 为什么这款指标是专业交易者的必备工具? 无限历史区域扫描 – 自动检测并可视化关键的供需区,无需手动分析,适用于任何时间周期和资产。 精准锁定高盈利区域 – 该指标能清晰标记市场供需区,帮助您预测市场反转和突破,提高交易成功率。 自动扫描K线 – 实时信号提示潜在的入场点,让交易决策更加智能化。 清晰的颜色编码区域 :
粉色区域(供应区) – 突破后变成需求区,但颜色保持不变。 天蓝色区域(需求区) – 突破后变成供应区,颜色仍保持不变。 自动识别关键交易模式 :
Drop-Base-Drop(DBD) & Rally-Base-Drop(RBD) – 供应区。 Drop-Base-Rally(DBR) & Rally-Base-Rally(RBR) – 需求区。 掌握机构交易者的优势 大多数散户交易者亏损的原因是他们无法看到“聪明资金”(Smart Mon

Buy and Sell ATR Indicator updated version 1.2 (2026)
ATR-based trend indicator with visual signals, dynamic support/resistance, and TP/SL levels. This indicator identifies market trends using an ATR channel and displays clear Buy and Sell signals. It draws a dynamic trend line that changes color (green for uptrend, red for downtrend), shows arrows for entries, and plots the latest Take Profit and Stop Loss levels directly on the chart. Detailed Description in the comments post 2. Set files in
FREE
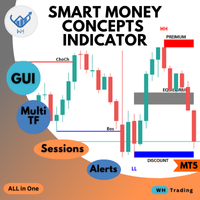
Welcome to the ultimate Smart Money Concepts indicator ,, this indicator is All-in-One package the only thing you need to empower
all the Smart Money Concepts in one place with interactive advanced gui panel with all the features and customization you need. MT4 Version : WH SMC Indicator MT4 *This Price For Limited Number of Copies.
Features: Main Section: User-Friendly Panel (GUI): Designed for traders of all experience levels, the indicator integrates seamlessly into your MT5 platform

The Time_Price_SQ9_Degree indicator is based on the 9 Gann square. Using this indicator, you can identify strong time and price zones. The indicator displays the levels as a degree value. The degrees can be set in the settings. After launching, the MENU button appears. If it is highlighted, it can be moved to any point on the graph, and after double-clicking on it, it stops being highlighted and menu buttons appear. To hide the menu, just double-click on the button, it will become highlight
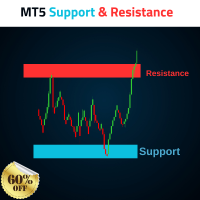
MT5 Support and Resistance Indicator Automatic Drawing of Multiple Supports and Resistances with levels. Supports As follow 1. Weak Support 2. Untested Support 3. Verified Support 4. Proven Support 5. Turncoat Support Resistances As follow 1. Weak Resistance 2. Untested Resistance 3. Verified Resistance 4. Proven Resistance 5. Turncoat Resistance Best Strategy to use 1. Identify Trend Direction on Daily Time Frame, Example Gold =
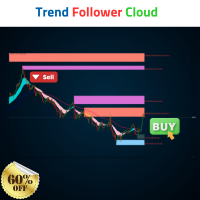
Trend Follower Cloud Trend is your freind. Advanced Indicator follow the trend, and gives a clear levels to buy and sell, and have Stop loss and Targets. Watch the Video to know how to use it combined with our Support and Resistance Indicator. Blue Trend Line Take a buy when we get a cloud intersection above the Bule line. Red Trend line Take a Sell when the Cloud drops below the Red line.

PipHistogram is an essential tool for traders who want to gain insight into price distribution and concentration. Its customizable, visually appealing histogram allows you to pinpoint key levels and make more informed trading decisions. Enhance your market analysis and improve your trading strategy with PipHistogram —your shortcut to understanding price dynamics in MetaTrader 5. Overview : PipHistogram is a powerful indicator for MetaTrader 5 that visually displays the percentage distribu
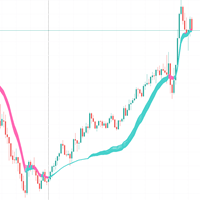
Understanding the RSI Adaptive EMA Indicator This code implements a custom trading indicator called "RSI Adaptive EMA" for MetaTrader platforms. It's a fascinating approach that combines RSI (Relative Strength Index) with an Exponential Moving Average (EMA) in a way that makes the EMA adapt based on market conditions.
Core Concept Traditional EMAs use a fixed smoothing factor (alpha), but this indicator creates a dynamic smoothing factor that changes based on RSI values. This allows the EMA lin
FREE

MATRIX Market Scanner
Comprehensive Analytics Without the Complexity Our innovative, cell-based dashboard gives you a panoramic view of the market—letting you monitor multiple instruments and timeframes seamlessly. Its high level of customization delivers an intuitive, dynamic display that adapts to your trading style, empowering you to see the bigger picture and make smarter, faster decisions. New Update The latest update to the Indicator Matrix Market Scanner introduces a powerful new feature
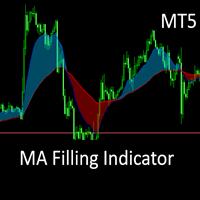
This is the MT5 converted Version of the The MA Filling Indicator, developed by Scriptong, is an advanced technical analysis tool designed for MetaTrader 4 (MT4) that enhances the traditional Moving Average (MA) indicator by incorporating a visually intuitive filling feature. The MA Filling Indicator is a versatile tool suitable for both novice and experienced traders seeking to enhance their trend-following strategies with a clear, color-coded representation of market dynamics. Support and ques
FREE
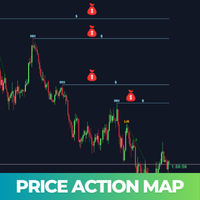
Price Action Map is an advanced trading indicator meticulously designed to provide clear visual insights into market structure by precisely labeling Higher Highs (HH) , Higher Lows (HL) , Lower Highs (LH) , and Lower Lows (LL) . Traders who find it challenging to accurately identify higher highs, lower lows, or understand different market phases will find this tool exceptionally valuable. Price Action Map significantly simplifies the analysis process, enabling traders at all skill levels to conf

The best and the only World Time Display for MT5
Features :
- JAPAN, LONDON & NEW YORK Time Display
- You can customize with different Font, Color And Text Size
- You can customize Box Position and Box Color to meet your satisfaction
- Only For Metatrader 5
- Customize GMT according to your Time Zone
- Simple To Use. Just Attach to your MT5
- No hidden code or no errors
FREE

Key Takeaways This timer does not lag like other timer indicators Show the time end of candlesticks and spread Hide or Show Spread depending on user needs Works on all timeframes Adjust Text Size Adjust Text Color Adjust Text Font
If you love this indicator, please leave a positive rating and comment, it will be a source of motivation to help me create more products <3
FREE

TS Time Remaining - Indicador de Cuenta Regresiva para Velas en MetaTrader 5 El TS Time Remaining es un indicador gratuito diseñado para la plataforma MetaTrader 5 que permite a los traders visualizar en tiempo real el tiempo restante de la vela actual. Esta herramienta es especialmente útil para aquellos operadores que trabajan con estrategias basadas en la acción del precio y patrones de velas japonesas, ya que les permite anticiparse al cierre de la vela y tomar decisiones con mayor precisión
FREE

G Channels – Efficient Adaptive Channel Indicator Introduction Channel indicators are widely used in technical analysis, offering valuable insights into price movements, trend identification, and volatility. Most channel-based indicators, such as Bollinger Bands and Keltner Channels, rely on a central tendency estimator (e.g., a moving average) combined with a volatility component to define upper and lower bands. The G Channels indicator takes this concept further by leveraging a highly efficie
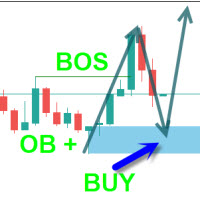
Smart Market Structure Simple is a powerful indicator that helps traders identify market structure based on the Smart Money Concept (SMC) . This indicator automatically detects Break of Structure (BOS), Change of Character (CHoCH), Fair Value Gaps (FVG), Order Blocks (OB), Liquidity Zones (LQZ), and key swing points Higher High (HH), Higher Low (HL), Lower High (LH), Lower Low (LL) . Main Objective: Assist traders in tracking institutional flow ( Smart Money ) and finding high-probability trade

Candle Reversal , is designed to identify and highlight key candlestick patterns that signal potential trend reversals or continuations in the market. It focuses on two primary types of patterns: 3-Line Strike Patterns (Bullish and Bearish) Engulfing Patterns (Bullish and Bearish) The indicator provides visual cues (arrows and text labels) on the chart to help traders quickly identify these patterns, making it easier to make informed trading decisions. use with MACD or awesome oscilator to
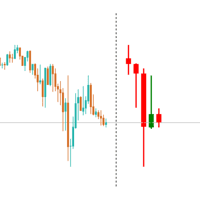
The Higher Timeframe Multiple Candle Tracker is designed to provide a snapshot of what the selected higher timeframe candles look like. It plots the N most recent candles after the current price. This tool is especially useful for traders who want to understand how the current higher timeframe candle may develop. You can choose the higher or lower timeframe from the available options. By default, bearish candles are displayed in red and bullish candles in green. The indicator also allows customi
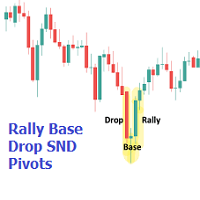
The Rally Base Drop SND Pivots indicator uses "Rally", "Base", and "Drop" Candles to determine pivot points at which supply and demand (SND) levels are drawn. (Figure 1) USAGE Figure 2 Rally, Base, and Drop (RBD) candles create a formula for seeing market structure through a fixed methodology. We are able to use this concept to point out pivot areas where Rallies and Drops directly meet.
The RBD SND Pivots are similar to traditionally identified "fractal" pivot points, with one key differ

• Please test the product in the Strategy Tester before purchasing to understand how it works.
• If you face any issues, contact me via private message—I’m always available to help.
• After purchase, send me a screenshot of your order to receive a FREE EA as a gift. Supertrend is a trend-following indicator based on Average True Range (ATR). The calculation of its single line combines trend detection and volatility. It can be used to detect changes in trend direction and to position stops.

• Please test the product in the Strategy Tester before purchasing to understand how it works.
• If you face any issues, contact me via private message—I’m always available to help.
• After purchase, send me a screenshot of your order to receive a FREE EA as a gift. PMax is a brand new indicator developed by KivancOzbilgic in earlier 2020. It's a combination of two trailing stop loss indicators; One is Anıl Özekşi's MOST (Moving Stop Loss) Indicator and the other one is well known ATR based

• Please test the product in the Strategy Tester before purchasing to understand how it works.
• If you face any issues, contact me via private message—I’m always available to help.
• After purchase, send me a screenshot of your order to receive a FREE EA as a gift. Dual Confirmation PMAX-Supertrend Indicator: The Ultimate Trading Edge The Dual Confirmation PMAX-Supertrend Indicator represents a significant advancement in technical analysis tools for serious traders. This premium indicator

Indicator Name: DualClockWithSignalTime.mq5 Description: The DualClockWithSignalTime is a custom MetaTrader 5 (MT5) indicator designed to display three pieces of real-time information directly on the chart: Broker Server Time Local Computer Time Last Signal Time (BUY/SELL) This indicator is helpful for traders who need to monitor both the broker's time and their own local time, ensuring better synchronization of trading actions. Additionally, it automatically detects and displays the latest BUY
FREE

JAJ Binary Pro is a precision-driven binary options strategy created by Jamaine Walkin , a full-time trader and investor. Designed for adaptability in Forex and OTC markets , it focuses on high-probability trade setups and disciplined risk management. Optimised for Pocket Option & MT5 , it reflects Jamaine’s structured approach to trading Options, ensuring consistency and confidence in execution.
Always use Proper Risk Management when trading.

Price Range MT5 是一款识别价格区间和价位的系统,能够识别区间何时结束、趋势何时开始。它能够以高概率指示新趋势的方向,并向您发送推送通知,让您能够及时做出决策。 Price Range 指标功能 该指标会实时推送所有价格区间、价位和趋势的通知,适用于任何交易品种和任何时间范围。 该指标会自行绘制所有价格区间,无需使用其他绘图工具。要删除所有显示的范围,请从图表中移除该指标。 该指标能够识别区间的实际结束时间,并在图表上标记趋势开始的信号。 在稳定的区间内,该指标会找到支撑位和阻力位。价格极有可能从这些价位反弹。 对于支撑位和阻力位,该指标会绘制最优止损线。数据科学会计算该价格,并将其作为下一个支撑位或阻力位。如果市场价格突破计算出的止损线,通常会脱离当前价格区间,并大幅上涨或下跌。 在我的博客中阅读有关该指标的交易策略: https://www.mql5.com/zh/blogs/post/761310 系统要求
任何类型的交易账户 任何交易符号 所有时间范围 设置 所有指标设置均在屏幕截图中简要显示。 请不要忘记在您的交易终端中启用推送通知!操作方法如下: htt

重要通知 – 需要许可证和激活
激活说明:
完成购买后,请立即联系我们以获取您的许可证密钥、密码或激活详情。没有这些,软件将无法运行。我们将确保激活过程顺利进行,并随时为您解答任何疑问。
多语言定制
为了提升您的交易体验,我们提供软件的多语言完整定制服务。我们的团队可以提供以下语言的翻译:
中文 | 法语 | 葡萄牙语 | 西班牙语 | 俄语
日语 | 德语 | 韩语 | 意大利语 | 土耳其语
只需告诉我们您偏好的语言,我们将定制指标,确保为您提供用户友好的体验。
成交量分布 – 高级市场分析工具
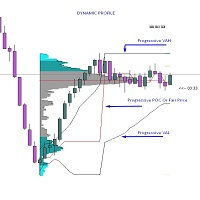
成交量分布是一个复杂的分析工具,旨在为交易者提供对市场动态的深入洞察。它捕捉价格随时间的变化,提供实时图形化的拍卖数据表示,揭示影响价格变动的集体行为模式。
其核心是 价值区域 (Value Area) ,代表包含当天68%交易活动的价格范围。这一区域与标准差对齐,突出显示大多数交易发生的区域。
主要功能:
成交量控制点 (VPOC): 识别在指定时间内交易量最高的价格水平,作为公平价格。
价值
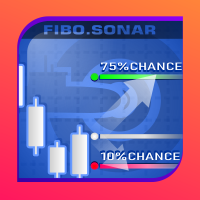
斐波那契声纳
斐波那契声纳有一个内部价格行为模式库,收集自 28 个符号和 7 个时间范围。 每个模式分为两面。前侧和后侧。斐波那契声纳使用前侧来识别相似的模式。最近的价格行为(任何时刻)直到最新条的开盘价是用作搜索库的前侧。
后侧保存每个模式所见的所有活动的汇总。这就是斐波那契术语的用武之地。从过去每个模式的所有实例的开盘价中,我们以斐波那契序列部署了开盘价上方和下方的价格水平。然后,我们测量了达到价格水平的次数。如果将达到价格水平的次数除以单个价格模式存在的实例数,则可以将其提取为百分比 (%)
当然,对于每个模式,您可以想象在顶部斐波那契价格和底部斐波那契价格上都有一个百分比。这允许使用给定百分比值来查找价格的方法。例如,使用此方法,我们可以要求达到 50% 的时间的水平,该方法将返回价格水平。
这些水平就是您在图表上看到的。虽然它们是由斐波那契价格范围与其发生可能性相结合而创建的,但它们并不位于与每个模式的开盘价之间的斐波那契距离。
这些水平的预定发生百分比为: 75% 50% 33% 10% 0% 其中有 5 个高于开盘价,5 个低于开盘价。这些水平并不围绕开盘价对
重要通知 – 需进行许可证和激活 激活说明: 完成购买后,请立即联系我们以获取您的许可证密钥、密码或激活详情。如果没有这些,软件将无法运行。我们将确保激活过程顺畅,并协助您解答任何问题。 多语言定制
为了提升您的交易体验,我们提供软件的多语言完整定制服务。我们的团队可以提供以下语言的翻译:
中文 | 法语 | 葡萄牙语 | 西班牙语 | 俄语
日语 | 德语 | 韩语 | 意大利语 | 土耳其语 只需告知我们您偏好的语言,我们将定制指标,确保提供用户友好的体验。 MT5市场轮廓指标 – 高级拍卖市场分析
市场轮廓是一种强大的图表工具,使交易者能够观察驱动所有市场运动的双向拍卖过程。它可视化了价格随时间的变化,揭示了群体行为和价格接受区域的关键模式。 本质上,市场轮廓是一个动态图形,持续记录和组织拍卖数据,帮助交易者精确地确定关键市场水平。 主要功能与概念 价值区域(VA) – 识别真正的市场平衡
价值区域表示包含一天交易活动中68%或70%(可调整)的价格范围,相当于价格分布的一个标准差。该区域突出显示了大部分交

The starting price is $75. It will increase to $120 after 30 sales.
After purchase, please contact me to get your trading tips + more information for a great bonus!
Lux Trend is a professional strategy based on using Higher Highs and Lower Highs to identify and draw Trendline Breakouts! Lux Trend utilizes two Moving Averages to confirm the overall trend direction before scanning the market for high-quality breakout opportunities, ensuring more accurate and reliable trade signals. This

介绍Always Win Currency Strength Analyzer:MT5终极货币强度仪表盘 这款MT5独立指标实时分析货币强度,识别最佳交易机会,提供可视化面板和自定义警报,是剥头皮和趋势交易者的必备工具。 核心功能:
实时强度追踪 – 分析外汇货币对与黄金(XAU)。
多时间框架分析 – 显示当前、1小时、4小时、8小时、24小时及1周前的强度。
自定义警报 – 设置强弱阈值并即时接收通知。
可视化面板 – 在MT5图表上一目了然。
捕捉趋势与反转 – 识别强弱货币对。 使用步骤: 将指标添加到MT5图表。 自定义分析周期与阈值。 监控多时间框架强度。 交易最强vs最弱货币。 阈值突破时接收警报。 立即开启智能交易! 跟踪货币与资产:
主要货币:
美元(USD)– 全球交易量第一
欧元(EUR)– 欧洲经济支柱
英镑(GBP)– 外汇市场主力
日元(JPY)– 避险首选
瑞郎(CHF)– 危机中的稳定器
澳元(AUD)– 大宗商品驱动
纽元(NZD)– 风险市场表现强

Session Break Out 指标 – 交易时段分析的终极工具 Session Break Out 指标 是一款先进的工具,旨在帮助交易者监测市场交易时段,并有效利用基于时间的交易策略。专业交易者深知,在外汇市场中,不同交易时段的货币强度和波动性各不相同,时间因素至关重要。 使用此强大指标,您可以:
追踪市场交易时段 – 立即识别当前活跃的交易时段及开放的市场。 监测时段高点和低点 – 关注关键价位,寻找突破或反转机会。 捕捉全新突破 – 当交易时段的高点或低点被突破时,实时收到提醒。 适配任何时区 – 轻松调整指标以匹配您的本地 GMT 设置。 可视化交易时段重叠 – 通过精美的图形界面清晰展示交易时段的转换。 历史交易时段框架 – 轻松开启历史时段显示,回顾市场结构。 即时买入 & 卖出信号 – 突破发生时,屏幕上显示实时提醒和箭头。 为什么选择 Session Break Out 指标? 简单安装 – 只需几秒钟即可轻松设置,无需复杂配置。
用户友好界面 – 直观设计,轻松读取交易时段数据。
强大的交易信号 – 适合希望利用交易时段趋势的交易者。 立即使用 Session
FREE
您知道为什么MetaTrader市场是出售交易策略和技术指标的最佳场所吗?不需要广告或软件保护,没有支付的麻烦。一切都在MetaTrader市场提供。
