 MetaTrader 5
 专家
 指标
 程序库
 实用工具
 窗口小部件
 规则
适用于MetaTrader 5的免费技术指标 - 70
 技术指标的信号外汇和股票市场的开仓交易和平仓交易起着至关重要的作用。指标的本质就是一种交易品种的数学转换,旨在预测未来的价格变化。
测试技术指标可以更有利于预测市场行为并从中获利。

Quickview The Quickview indicator instantly highlights asset variations, delivering crystal-clear market insights at a glance. Effortlessly track multiple assets with visual simplicity, enabling quicker, smarter, and more confident trading decisions daily. ️ Key Features Real-Time Asset Tracking: Instantly monitor multiple assets simultaneously, never missing a critical market move. Flexible and Intuitive Display: Personalize your view, displaying assets exactly as you want—clear, concise, c
FREE

Take control of your trading workspace with the Switcher Dashboard – a smart and efficient tool that auto-detects all open charts (Forex, VIX, stocks) and turns them into neatly organized, color-coded buttons for instant chart switching. Key Features: One-click chart navigation – Seamlessly switch between charts with a single click. Trend visualization – Instantly identify bullish or bearish conditions with clear color cues. Flexible layout options – Choose from 4 customizable views (left, righ
FREE

Not everyone can write an indicator. But anyone can have an idea. The indicator Universal Main Window Free MT5 , which takes as an input parameter the formula by which the indicator line will be drawn, will help to implement it. This indicator is intended for use in the main chart window.
All indicators of the series Universal :
Main window Separate window Free MT4 Universal Main Window Free MT5 Universal Main Window Free MT5 MT4 Universal Separate Window Free MT5 Universal Separate Window Fre
FREE

Dynamic Theoretical Stop
Histogram indicator that dynamically analyzes the theoretical Stop levels in real time.
Operation :
The DTS - Dynamic Theoretical Stop does a mapping of fractals in previous candles and suggests two levels of Stop: For purchase and for sale.
Suggested reading :
It is necessary to make the definition of Maximum Stop in points in the Trading Plan. In this way, the trader can decide the best entry point by analyzing the theoretical stop levels:
Stop for sales: Shown a
FREE

The forex spread is the difference between a forex broker's sell rate and buy rate when exchanging or trading currencies . Spreads can be narrower or wider, depending on the currency involved, the time of day a trade is initiated, and economic conditions.
Forex Spread WatchDog :
This Forex indicator ensures that you are getting the best spreads while trading, and guards against broker spread widening.
FREE

TS Time Remaining - Indicador de Cuenta Regresiva para Velas en MetaTrader 5 El TS Time Remaining es un indicador gratuito diseñado para la plataforma MetaTrader 5 que permite a los traders visualizar en tiempo real el tiempo restante de la vela actual. Esta herramienta es especialmente útil para aquellos operadores que trabajan con estrategias basadas en la acción del precio y patrones de velas japonesas, ya que les permite anticiparse al cierre de la vela y tomar decisiones con mayor precisión
FREE
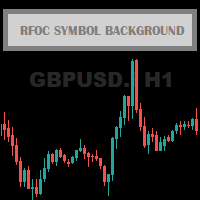
The RFOC Symbol Background was created to display the name of the asset and the current timeframe in the background of the chart.
Displaying the name of the asset at the bottom of the chart is often used by traders who are designing the screen for spectators, making it easier to identify the asset and the timeframe during a class, for example.
It is available for the user to select the font size (small, medium or large) and select the color for better viewing according to the background color
FREE

Expert Advisors often use a channel around standard MAs. The indicator builds such a channel and has three buffers: MA, MA Channel Top and MA Channel Bottom.
Now with the help of this single indicator you can plot a channel around the MA on the chart similar to similar Envelopes or Bollinger Bands.
There are a lot of strategies for using it: on the breakout of borders or on the bounce from them.
FREE
Индикатор отображает изменение баланса В правом нижнем углу окна.
Отображаются следующие периоды Сегодня Вчера 3 дня Неделя 10 дней Месяц 3 месяца Полгода Год Все время Есть возможность выставить расчетное время. Удобно пользоваться для расчетов прибыли/убытков с определенного часа.
Будет полезен например ночным скальперам. Данные совпадают с расчетами отчета в терминалее.
FREE
This is a free helper indicator for MT5 that will help traders setup their constant volume charts depending on their trading style. It will calculate the number of ticks that your constant volume chart should have depending on the following trading styles: Scalper Active Day trader Day trader Swing trader Position trader Instruction video attached.
Enjoy!
FREE
This indicator shows the value of returns in the selected time frame
They are calculated as logarithm of returns , rather than price or raw returns. For small returns, arithmetic and logarithmic returns will be similar. The benefit of using returns, versus prices, is normalization. It is possible measures all variables in a comparable metric despite originating from price series of unequal values
Inputs You can display data both as a Histogram or a Line It's also possible to display the a
FREE

The Time End bar by MMD is a simple indicator that shows the number of seconds remaining in the three selected intervals. According to the MMD methodology, the moment when a directional price movement occurs is important. This indicator allows you to use this relationship more effectively in Forex and Futures trading.
Functionality description:
Time Frame 1 Period - defining the first time interval Time Frame 1 Color - specifying the color for the first time interval Time Frame 1 Period - def
FREE

นี่คือคําอธิบาย Trend SAR Fusion PRO MT5 (เวอร์ชัน Stable) จากโค้ดที่คุณใช้
แนวคิดของอินดิเคเตอร์ อินดี้ตัวนี้ = รวม 3 อย่าง EMA10 (เร็ว) → จับโมเมนตัม EMA100 (ช้า) → จับเทรนหลัก SAR (จุดดอท) → ใช้เข้า/ออก สรุป: "ใช้ SAR เป็นตัวเข้า แต่ให้ EMA คัดกรองว่าเข้าเทรนจริงไหม" วิธีดูสัญญาณ (สำคัญสุด) เทรนขึ้น EMA10 > EMA100 จุด SAR อยู่ "ใต้ราคา" จะเห็น จุดเขียว
เข้า BUY ได้ เทรนลง EMA10 < EMA100 จุด SAR อยู่ "เหนือราคา" จะเห็น จุดแดง
เข้า SELL ได้ ช่วงเปลี่ยนเทรน ม
FREE

*Used by MeditionSeed EA. Meditation is a practice in which an individual uses a technique – such as mindfulness, or focusing the mind on a particular object, thought, or activity – to train attention and awareness, and achieve a mentally clear and emotionally calm and stable state.[1][2][3][4][web 1][web 2] Plant a Meditation Seed to have wonderful future.
FREE
The Choppery notifier is an indicator that has been developed and tested for the purpose of alerting you that a candle is about to form, it takes away the trouble of having to play a guessing game as to when next a candle will form after a trend, therefore most of the time it eliminates the thought of having to predict which direction price will begin to move at. This indicator can be used in any timeframe, a notification will be sent out to you via email when price moves. you can start at a min
FREE
RCH FX Spread + Bar Close Countdown Indicator
What This Indicator Does
A simple, professional tool that displays real-time spread information and bar closing countdown directly
on your MT5 charts.
Key Features
• Real-time spread display - Shows current spread in pips or points
• Bar close countdown timer - Exact seconds remaining until current bar closes
• Customizable alerts - Audio notification before bar closes
• Fully adjustable display - Position, colors, fonts, and sizing options
• Works o
FREE

(Special New Year promotion - free price!) The indicator displays the actual 'Scale in points per bar' (identical to the manual setting in the Terminal, see screenshot)
in the upper right corner of the chart.
The displayed value changes INSTANTLY whenever the chart scale is changed! (This is very convenient when planning screenshots).
In Settings: Change language (Russian/English), font size of the displayed text, text label offset coefficient from the graph corner, equally in X and Y directi
FREE

**Measure Utility (R-Meter) — MFE/MAE 交易日志与绩效面板**
不要再追逐「完美」指标。你真正的优势是数据,而这个工具会替你测量它。
Measure Utility 是一款轻量级的纯测量指标,可自动跟踪你的每一笔交易,并在图表上实时显示你的真实表现。它从不发送、修改或平仓任何订单,只负责观察与统计,因此可以安全地与任何策略或 EA 一起运行。
**每笔交易都会跟踪:** - MFE — 最大有利偏移(价格朝有利方向走了多远) - MAE — 最大不利偏移(价格朝不利方向走了多远) - 两者均以 R 倍数衡量(相对于初始止损距离)
**图表实时面板显示:** - 总交易数、胜率(盈利/亏损) - 盈利因子与净利润 - 平均盈利 / 平均亏损 - 最大连续亏损次数(波动性预警) - 持仓的实时 MFE 与 MAE
**自动 CSV 交易日志:** 每笔平仓交易都会记录到 CSV 文件(订单号、品种、方向、开/平仓时间、价格、手数、利润、结果),可直接用 Excel 打开,完成「100+ 笔交易」的分析循环。
**灵活的跟踪范围:** - 跟
FREE

Привет. Сегодня представляем индикатор корреляции - SynchroWindowTomson. Индикатор в одном окне показывает движение нескольких инструментов, по отношению друг к другу, удобно определять направление и изменение, особенно когда вы работаете с целым портфелем разных инструментов и нужно определить какой из них тянет результат назад и движется в другую сторону. Так же видны точки разворота спреда.
FREE
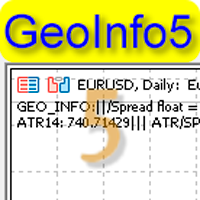
GeoInfo5 是信息量最大的指标之一,它以简洁的形式显示交易工具的基本信息。 Meta Trader4终端的版本在交易者中广受欢迎。 该指标是免费的,将永远是免费的。 推出版本现在也可用于MetaTrader5。
在图表左上角的行中以简短的形式显示有关工具主要参数的信息: 价差,交换买入订单,交换卖出订单,当前价差,抵押品(保证金),蜱虫大小,停止水平,订单冻结水平。 信息显示基于一个手和点。
信息以如下形式输出: Spread ... = 23 pips /SWAP B:4.200 /S:-8.470 /MRG:256.0/TCV:0.10/STL:0/FRL /MinLot:0.1
已经介绍了关于周期的平均范围和周期/点差的比率范围的信息的显示,这允许您选择在这些市场条件下最有效操作的最佳时间框架。 数据以格式呈现: ATR14:906.786///ATR/SPR:3.956 如果 ATR/SPR 比率较小,则选择更高的时间框架以实现更高效的操作可能是有意义的。 对于紧急工具(期货),到期日以以下格式显示: Exp Date:2022.02.18 参数: ShowSym
FREE

Display the date, time and price according to the movement of the mouse cursor on the chart This is useful for discretionary trading.
It is an indispensable tool for verifying and studying past market prices and trades. Characteristic Date,Time and Price are displayed.
The value follows the movement of the mouse.
You can change the color of the text. Please refer to the video on youtube. For MT5 only.
FREE

Fimathe Indicator The Fimathe Indicator is a tool for MetaTrader 5 designed to help traders identify support, resistance, neutral zones, and price channels. It features an interactive interface for drawing and managing support and resistance levels, generating take-profit channels and neutral zones, and providing visual and sound alerts for breakouts. Key Features Support and Resistance Lines: Dynamic and draggable lines to identify key levels. Reference Channel: Creates a channel between su
FREE

IDNR4 — Indicator Description (English)
The IDNR4 (Inside Day Narrow Range 4) is a volatility-compression pattern that identifies potential breakout conditions. It combines two concepts: NR4 (Narrow Range 4)
The current bar has the smallest high–low range compared to the previous three bars. Inside Bar (ID)
The current bar’s high and low are fully contained within the range of the previous bar. Signal Logic
• When the bar is NR4 only , it is highlighted as a normal contraction pattern.
• Wh
FREE

停止猜测,开始精准交易。
QTS Super Hybrid Platinum 不仅仅是一个指标,它更是一套完整的交易系统,专为追求精准和安全的短线交易者和日内交易者而设计。该工具结合了机构价格行为 (SNR) 和趋势动量 (三重 EMA) 的强大功能,过滤掉市场噪音,只为您提供高概率的交易机会。
为什么选择 QTS Super Hybrid Platinum?我们开发这款工具旨在解决交易者面临的三大难题:虚假信号、过度交易和错失良机。
白金版功能:
自动趋势和 SNR 逻辑:自动识别“大玩家”趋势(高时间框架偏好),并为您绘制关键支撑/阻力位。
移动推送通知:再也不会错过任何交易机会!当出现有效信号时,您的手机将立即收到提醒(“叮!”)。随时随地,轻松交易。
幽灵目标系统(自动止盈/止损):不知道在哪里退出?该指标会根据波动率(ATR)自动绘制“幽灵线”来设置止盈和止损点。
️ 智能过滤器(防陷阱):
RSI 过滤器:防止在顶部买入或在底部卖出。
波动率计:在市场横盘整理或剧烈波动时发出警告。
K 线计时器:使用精准的倒计时器避免假
FREE

Hollow Candles MA - 专业空心蜡烛趋势指标 Hollow Candles MA 是一款简洁高效的趋势跟踪指标,专为 Hollow Candles 图表设计。 它将收盘价与快速移动平均线进行比较,通过为蜡烛着色清晰显示当前市场趋势: DodgerBlue = 看涨趋势 (Close ≥ Fast MA) Red = 看跌趋势 (Close ≤ Fast MA) 该指标帮助交易者在 Hollow Candles 图表上以高清晰度直观识别趋势方向,更容易跟随强势行情并避免震荡行情。 主要特点: 针对 Hollow Candles 图表类型优化 简单可靠的趋势检测 使用 DodgerBlue 和 Red 的清晰视觉信号 系统资源占用极低 完全可自定义 参数: Fast MA Period:移动平均线周期(默认 14) MA Method:SMA、EMA、SMMA、LWMA MA Applied Price:CLOSE、OPEN、HIGH、LOW、MEDIAN、TYPICAL、WEIGHTED Bullish Color:默认 DodgerBlue Bearish Color:
FREE

Nebryx BandPulse Matrix Professional Bollinger Bands Volatility Context Indicator for MetaTrader 5
PRODUCT OVERVIEW Nebryx BandPulse Matrix is a clean volatility-context indicator built around Bollinger Bands. It is designed for traders who want more than a standard band overlay. The indicator combines classic Bollinger Bands with volatility squeeze detection, expansion confirmation, band-walk trend context, stretch/overextension markers, and a compact chart status label.
The product focuses
FREE

Horizontal lines on the chart alternate between solid and dashed styles, representing areas of interest based on significant highs and lows from different timeframes, creating potential confluence between market structures. The indicator is designed to assist each participant in their own market studies, giving users the flexibility to combine the indicator with their personal trading system and analysis methods . The lines should not be used as standalone entry triggers . Instead, they are inte
FREE

Anchored VWAP — 5 draggable anchors with deviation bands Volume-weighted average price anchored to user-defined points on the chart. Drop an anchor where you want the VWAP to start — earnings, swing high/low, session open, any event — and the indicator recalculates from that bar forward. This indicator is available free of charge. What it does: Up to 5 independent anchors, each with its own VWAP line and color, running simultaneously on the same chart 2 configurable σ deviation bands (default ±1
FREE

Its Free For Only This Month After That You Will Have To Pay 100$ (You Have Only 5 Days) The Zoner: Precision Daily Range & First Red Candle Zone Indicator for MT5 Stop Guessing Market Direction. Trade Like a Professional. Are you tired of buying rigid, over-optimized trading robots that fail the moment market volatility shifts? Do you waste valuable minutes every morning drawing manual boxes, calculating daily high-low ranges, and searching for key institutional reaction zones?
Meet The Zon
FREE

ICT Dynamic Killzones — Custom Timezone Edition 此指标在图表上绘制 ICT 风格的 Killzone 会话框,同时显示前一日高点(Previous Day High)和前一日低点(Previous Day Low)水平。专为 M1、M5 和 M15 时间框架设计。 支持的会话 指标支持以下交易会话,每种会话均可自定义颜色和标签: Asia Session(亚洲会话) London Session(伦敦会话) New York Session(纽约会话) London Close Session(伦敦收盘会话) One optional Custom Session(可选自定义会话) 每个会话以彩色框显示(可填充或仅边框),会动态更新以反映当前活跃会话的价格范围。已结束的会话将在收盘后固定。 时区配置 指标使用两个独立的偏移输入:您的本地时区 UTC 偏移和经纪商服务器 UTC 偏移。这样无论经纪商时钟如何,都能准确定位会话。 前一日高点和低点 PDH 和 PDL 线会自动从前一天的日蜡烛绘制。线的颜色、宽度、样式和射线方向均可自定义。 视
FREE

Account Info Panel 把你最常查看的数字放进图表上的一个小面板,你就不必切换到“交易”选项卡。
显示内容 - 余额和净值。 - 持仓的浮动盈亏。 - 今日已平仓:自服务器日开始以来平仓交易的盈利、隔夜利息、佣金和费用。不包括入金和出金。 - 已用保证金和可用保证金。 - 保证金水平,低于 200% 时高亮显示。 - 今日回撤:净值低于当日开始时水平的幅度,包括当前值和最深值。最深值从 3% 起高亮显示。 - 持仓数量和总手数,另有一行可选的仅限图表品种的数据。 - 交易服务器时间。 - 模拟账户上显示 "demo" 标签。账号默认隐藏,便于安全分享截图;一个输入参数即可开启显示。
工作原理 面板每秒根据终端的账户数据刷新一次。今日回撤从服务器日第一次更新时看到的净值开始计算。如果你在日内加载指标,则从加载那一刻开始计算。
输入参数 显示账号、图表品种行开/关、字体大小、面板角落。
限制 - 今日回撤只在指标运行期间跟踪。关闭图表或终端会将其重置。 - 数值以经纪商服务器为该账户报告的数据为准。
该指标只读取数据。它从不下单、修改或平仓。
FREE

Day and Week Separators 在日内图表上于每天、每周和每月的开始处绘制竖线,并可在每条线旁显示星期标签。这是一个小巧的视觉辅助工具,让您更容易看清一个交易日在哪里结束、下一个交易日从哪里开始。
工作原理 - 日、周、月分隔线各自有独立的开关、颜色和线型。 - 当多个周期在同一根K线上开始时,只绘制级别最高的线:月优先于周,周优先于日。 - 交易日可以从经纪商服务器的午夜开始(默认),也可以从您选择的任意服务器小时开始。如果经纪商服务器时间为纽约收盘 + 7 小时,默认设置已与通常的纽约 17:00 外汇交易日一致。 - 当交易日的星期数倒退(例如从周五到周一)或已经过了一整周时,即判定为新的一周。 - 标签在每条分隔线旁显示星期几(Mon、Tue 等)。 - 较早的分隔线会被自动删除,使图表保持轻量。您可以选择保留多少条。 - 分隔线位于K线后方,不会被意外选中。
输入参数 - 分隔线:日、周、月的开/关、颜色和线型。 - 日开始:服务器小时。 - 显示:星期标签、标签颜色、保留的分隔线数量、扫描的K线数量。
限制 - 仅在日内图表上绘制;在 D1 及更高周期
FREE

Opening Range Levels 标记开盘区间(即您所选交易时段的最初几分钟)的最高价、最低价和中间价,并将这些水平延续到当天剩余时间。
工作原理 - 您设定时间窗口及其时区:纽约(默认 09:30-10:00)、伦敦、东京或经纪商服务器时间。 - 自动应用美国和英国夏令时。经纪商的服务器时差从终端自动检测;大多数经纪商随美国夏令时调整时钟,这也是默认设置,另外也可使用固定或手动时差。 - 窗口开启期间,指标跟踪其最高价和最低价。窗口结束后,从窗口起点开始绘制区间最高价、最低价以及(可选)中间价。 - 线条逐根K线向右延伸,直到您选择的停止时间(默认 16:00);若设为 0,则延伸到下一个区间开始。 - 可选的扩展线位于最高价上方和最低价下方,距离为区间宽度的指定倍数。 - 每天保留各自的一组线条;您可以选择图表上保留多少天。面板显示今天的区间是等待中、形成中还是已确定,以及其最高价、最低价和宽度。
输入参数 - 开盘区间:时区、窗口开始与结束时间、停止时间。 - 服务器时间:检测方式和手动时差。 - 水平:颜色、中线、扩展线及倍数。 - 显示:历史天数、标签、面板及其角
FREE

Spread and Swap Info 在一个小面板中显示当前品种的交易成本和时间信息,让新手无需打开品种规格就能查看。
显示内容 - 以点为单位的点差,当经纪商提供固定点差时显示 "(fixed)"。 - 多头 / 空头隔夜利息,并按品种的隔夜利息模式显示正确单位:点、货币(基础货币、保证金货币或账户货币)、年化百分比或 "reopen"。当隔夜利息被禁用或两者都为零时,显示 "Swap: none"。 - 三倍隔夜利息日,即收取三天隔夜利息的星期几。没有隔夜利息时隐藏。 - 服务器时间和本地时间,方便您了解经纪商时钟与您的时间之间的关系。 - 时段:亚洲、欧洲、美国或同时多个,或 "Closed / between sessions",依据您设置的服务器小时。周末或该品种今天没有交易时段时,显示 "Market closed"。 - 可选的当前K线收盘倒计时。
如何设置 默认时段时间(亚洲 0-9、欧洲 7-16、美国 13-22)只是服务器时间下的起点。请根据您经纪商的服务器时钟进行调整。时段可以跨越午夜。
输入参数 角落、X/Y 偏移、行间距、字体和大小、标签/数值/强
FREE

Anchored Periodic VWAP with Deviation Bands A lightweight, interactive VWAP indicator that restarts every Day, Week or Month, with a built-in on-chart control panel. Overview Anchored Periodic VWAP plots the Volume Weighted Average Price and resets it automatically at the start of each Daily, Weekly or Monthly period. Around the VWAP it draws two pairs of standard-deviation bands, so you can see at a glance where price is trading relative to the period’s “fair value”. You can switch the anchor p
FREE

This indicator automatically detects harmonic price patterns on your chart, both bullish and bearish, and shows them as soon as they form, including potential patterns that are still developing. For every pattern it draws the Potential Reversal Zone (PRZ), and for completed patterns it also draws two take-profit and two stop-loss levels.
Supported Patterns: Gartley, Bat, Butterfly, Crab, Deep Crab, Shark and Cypher. Each pattern can be switched on or off individually.
Key Features: Completed
FREE
The Schaff Trend Cycle (STC) is a technical analysis tool designed to help traders identify trends and potential reversals in the market. It combines elements of cycle analysis and moving averages, making it particularly useful for predicting price movements in various financial instruments, including forex 1 . Key Features Predictive Nature : The STC is known for its ability to provide early signals about potential trend changes. This makes it a valuable tool for forex traders looking to
FREE
The RSI Channel Binary indicator is a specialized tool designed for binary options trading, leveraging the power of the Relative Strength Index (RSI) . The RSI is a momentum oscillator that ranges from 0 to 100 , helping traders identify overbought and oversold conditions in the market. In the RSI Channel Binary indicator, the following key signals are utilized: Buy Signal (CALL) : A CALL option is indicated when the RSI crosses above the 30 level. This movement suggests that the ass
FREE
The Pattern ADX RSI indicator is a powerful trading tool designed to enhance decision-making by combining the strengths of three distinct components: price patterns , Relative Strength Index (RSI) , and Average Directional Index (ADX) . This indicator waits for specific pattern signals to emerge in the market and then applies filtering mechanisms based on RSI and ADX readings to confirm the quality of the signal before executing trades. Key Components Pattern Detection : The indicator
FREE
The Trend ADX RSI Volumes is an advanced technical indicator that combines the Average Directional Index (ADX), the Relative Strength Index (RSI), and volume information to provide a comprehensive analysis of market trends. This indicator is designed to help traders identify not only the strength of a trend but also its direction and validity. Key Features of the Indicator Trend Strength Measurement : The ADX quantifies the strength of a trend on a scale from 0 to 100. Values above 25 ge
FREE

The Trend ADX is a specialized implementation of the Average Directional Index (ADX) that focuses on identifying and confirming market trends. By utilizing ADX along with its directional indicators, Trend ADX helps traders pinpoint the strength of a trend and make informed trading decisions. Key Features of Trend ADX Strength Measurement : The Trend ADX quantifies the strength of a trend, allowing traders to determine whether to enter or exit positions based on trend momentum. Direction Indi
FREE
Flux Binary FX is a powerful trading tool designed specifically for binary options and forex trading. This innovative indicator utilizes a unique approach to identify significant market trends, providing traders with clear signals to enhance their trading strategies. Key Features: Flux Trend Detection: The indicator generates arrows on the chart that indicate the presence of a flux trend. This feature allows traders to quickly identify potential entry and exit points, making it easier to cap
FREE
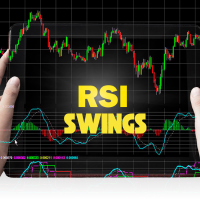
The RSI Swings indicator is a powerful tool designed for MetaTrader 5 (MT5) that combines the principles of the Relative Strength Index (RSI) with high and low price levels to enhance trading decisions. This innovative indicator helps traders identify potential reversal points in the market by analyzing price swings in conjunction with RSI readings. Key Features High-Low Analysis : The RSI Swings indicator focuses on the highs and lows of price movements, allowing traders to pinpoint signifi
FREE
The RSI Back Arrows indicator is a powerful tool designed for traders who rely on the Relative Strength Index (RSI) to identify potential market reversals. This indicator specifically highlights when the RSI has exited the oversold or overbought zones, providing clear visual signals to inform trading decisions. Key Features: Visual Cues : The indicator marks arrows on the chart when the RSI crosses back into a neutral zone, making it easy to spot potential entry and exit points. Over
FREE

BB Out Arrows is a powerful and intuitive indicator designed for MetaTrader 5 (MT5) that enhances trading strategies using Bollinger Bands. This indicator signals potential trading opportunities by displaying arrows when a candle closes outside of the Bollinger Bands, but with an added layer of precision through a wick percentage filter. Key Features: Bollinger Bands Integration: Utilizes the classic Bollinger Bands to identify market volatility and potential price reversals. Arrows Indicati
FREE
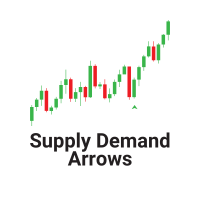
The "Supply Demand Arrows" indicator for MetaTrader 5 (MT5) is a powerful trading tool designed to help traders identify critical supply and demand zones in the market. By visually marking these zones with arrows, the indicator enhances trading precision and decision-making. Key Features Identification of Supply and Demand Zones : The indicator effectively highlights key supply and demand zones on the price chart, allowing traders to see where significant buying or selling pressure exists. T
FREE

SMC Structure Map 用固定、公开的规则画聪明钱市场结构、订单块、FVG 和流动性扫掠,只用已收盘的 K 线。历史上看到的,就是当时实时会看到的,事后不会重画。 应用程序说明 市场结构 已确认的摆动高低点,标 HH / HL / LH / LL(等高 / 等低标 EQH / EQL)。 K 线收盘越过当前摆动价位时标 BOS(顺势突破)或 CHoCH(性质转变)。 可选内部结构,摆动长度单独设置。 订单块和 FVG 订单块:结构突破前最后一根反向 K 线。 FVG:三根 K 线留下的缺口,带 50% 中线和回补百分比。 价格回来时状态实时更新:OB 已回测 / 已失效,FVG 已触及 / 50% / 已回补 / 跳空越过。失效区域可以灰色显示。 默认只画离现价最近的区域,面板会告诉你还有多少没画。 流动性扫掠 K 线冲过已确认的摆动高 / 低点,或前一交易日高 / 低点,收盘又回到里面。 面板上的多周期解读 最多 4 个更高周期的方向(比如 M15 图上显示 H1 · H4 · D1 · W1)。 可在图上叠加一个高周期(结构、OB、FVG),只用已收盘的高周期 K
FREE

今天是哪种类型的日子:趋势日、区间日、反转日、内包日还是外包日?Day Type Map 为图表上的每一天标出类型,显示今天到目前为止属于哪种类型,以及该品种过去的日子在六种类型之间是如何分布的。在黄金上,过去250天中,32%是区间日,17%是上涨趋势日,16%是反转日。免费、清晰,并已用另一套独立实现进行核对。 功能 最近的每一天都会画上下划线,并用各自的颜色标出类型:上涨趋势、下跌趋势、区间、反转、内包或外包。今天的类型会随着当天的形成而标出("Range so far")。一个小表格列出六种类型:每种类型在过去日子中所占的比例、每种类型有多少天,以及每种类型上一次出现是多久以前,今天的类型会被突出显示。可选的提醒会在今天的类型发生变化时通知你。 工作原理 每一天的类型由它自己的开盘价、最高价、最低价和收盘价,以及前一天的最高价和最低价来判定,使用简单、固定、对所有品种都相同的规则:内包日停留在前一天的范围之内;外包日同时超出前一天的两端;反转日超出前一天的一端,然后收盘回到自身波动范围另一侧附近;趋势日的收盘价远离开盘价;其余的日子都是区间日。分布使用你选择的过去天数(默认是最
FREE

Hello, traders. Ever stared at your chart wondering what really happened between those highs and lows? Well, allow me to introduce myself. I'm Inspector, your market structure detective
My job you ask? To investigate price action so you don't have to piece together every move yourself. I identify swings, classify market structure, measure retracements, and track how market behavior evolves, turning a busy chart into a clearer picture of what's happening.
Curious about a particular price move?
FREE

您的手数风险可能超过您设定的百分比。True Risk 在您开仓之前显示下一笔交易的真实风险。 问题所在 经纪商会把每个手数向下取整到步长,而且绝不会低于最小手数。在小账户上,仅最小手数本身就可能是您计划风险的许多倍。以 300 美元账户、黄金止损距离 25 美元为例,0.01 手已经承担 25 美元风险,即 8.3%,而不是您设定的 1%。点差和佣金同样是亏损的一部分。大多数计算器显示的是它们希望您交易的手数。本指标显示的是您实际能开的手数所对应的真实风险。 显示内容 取整后手数的真实风险,以金额和百分比大字显示。符合计划时为绿色,取整使风险增加超过 10% 时为琥珀色,真实风险超过设定风险两倍时为红色。 用简单的文字说明原因,例如 "Min lot is 13x your risk, max stop for 1%: 21 pts"。 风险允许的手数和经纪商允许的手数,显示在可复制的字段中。 该手数的保证金以及开仓后剩余的可用保证金。 添加止盈后,显示止盈和盈亏比。 在当前止损距离下,实现真正 1% 风险所需的余额。 交易方向(买入或卖出)以及应下的订单类型:市价、buy stop
FREE

SX Sessions draws the Asia, London and New York sessions as clean boxes on your chart, with the daily open and the high and low of the previous day. The session times follow the clock changes in summer and winter by themselves, so the boxes stay in the right place all year.
What you get: - Asia, London and New York boxes from the session high to the session low, with a light fill and the session name - The running session is drawn with a dashed border and grows with the price - Asia: its size
FREE

BOA Swing Levels 在您选择的时间周期上寻找波段高点和低点,显示下一次突破可能从哪里开始、其目标位和止损在哪里,以及这些目标在您所选品种的历史上达成的频率。 水平位 水平位基于水平周期(默认 M15)已收盘K线,由 N 根K线的价格通道确定:当价格从另一侧离开通道时,波段结束,其极值成为水平位。 当前突破水平位:价格上方最近一个未被突破的波段高点和价格下方最近一个未被突破的波段低点,向右延伸并标注价格。 历史水平位绘制到突破它的K线为止,并在突破处标记箭头。 目标与止损 每个当前水平位都有三个止盈目标(TP1、TP2、TP3)和一个止损,以水平周期的 ATR 计算。 水平位、目标和止损之间的区域被填充,越远的目标颜色越深;区域绘制在K线下方并与图表背景融合。 从突破K线开始跟踪最近一次突破:入场、止损和目标及其价格,以及哪些已经达到。 之前的突破(默认 10 个)显示其结果:只填充已达到的区域,并标注 TP1、TP2、TP3 或 SL。 胜率面板 在分析的历史中(默认水平周期 2000 根K线)的每次突破,都会在随后的已收盘K线上检查:价格先到达目标还是
FREE

中文 适用于 MetaTrader 5 的 Volume Profile 使用适用于 MetaTrader 5 的 Volume Profile,更直观地了解市场活动。该指标展示不同价格水平上的成交量分布,帮助您发现交易最活跃的区域,以及潜在的支撑位和阻力位。 您可以根据自己的交易风格自定义指标。选择特定时间范围,分析某个交易时段、交易日或指定时期;调整颜色以匹配图表主题,并设置清晰易读的显示方式。 通过 Volume Profile,您可以研究成交活跃区域,为技术分析增加一个实用的观察角度。无论是复盘历史价格走势,还是实时关注市场,都可以灵活调整设置,让指标更符合您的需求。 如果您觉得这个指标有帮助,我将非常感谢您留下评价。也欢迎访问我的网站,体验我的交易日志应用,并了解我发布的其他指标。网站链接可以在我的个人资料简介中找到。
FREE

UT Bot Alerts Nexus là một chỉ báo tiên tiến, tối ưu hóa về mặt hình ảnh được thiết kế cho XAUUSD và các cặp forex lớn, dựa trên logic cốt lõi huyền thoại "UT Bot Alerts" (ban đầu do khái niệm QuantNomad / Quantower sáng lập). Nó kết hợp các cơ chế theo dõi cấp tổ chức với tỷ lệ biến động động của ATR để cung cấp trực quan hóa biểu đồ rõ ràng, có thể hành động. ️ Logic cốt lõi & Tính năng: Bộ lọc dừng ATR dừng: Sử dụng phép tính RMA/Wilder ATR chính xác để lọc các nhiễu thị trường và nắm bắt cá
FREE

QuantEdge Account Monitor 用一个小面板显示您账户的真实状况。它免费且只读:从不开仓、修改或平仓任何交易。 实时显示 净值、余额、浮动盈亏和持仓数量 今日、本周和本月的结果,以金额和占期初余额的百分比显示(已平仓交易 + 浮动盈亏) 距净值高点的回撤,并以进度条显示距离您的警报水平还有多远 已平仓交易的最大回撤 已平仓交易的净值曲线 按品种或按 magic 号统计(一键切换):交易次数、胜率、盈利因子、净结果。手动交易显示为 magic 0,一眼就能看出哪个 EA 在赚钱、哪个在亏钱。 诚实的数字 每个结果都包含佣金、隔夜利息和费用,包括开仓时支付的佣金 入金和出金不计为盈利或亏损:百分比和回撤只衡量您的交易 全部历史、本月、最近 30 天或 90 天 警报 当日亏损警报(例如 -3 %)和回撤警报,每天一次:声音、推送到手机 MT5 应用、电子邮件 面板 英文 / 法文,4 种主题(石板灰、深蓝、浅色、自定义颜色),透明度可调 可拖动到任意位置,可最小化为一行 适用于任何图表和任何品种,可与您的 EA 同时使用(它是指标:不占用图表的 EA 位置) 截图是在策
FREE

Willy R 4 DEMA – Multi-Timeframe Trend & Precise Entry Indicator Predict Overall Price Direction and Pinpoint Precise Entry Points with a Single Indicator! Willy R 4 DEMA is a powerful hybrid technical indicator built on the synergy of two classic momentum and trend tools: the Williams %R (%R) oscillator and the Exponential Moving Average (EMA) , enhanced further with Double Exponential Moving Average (DEMA) lines across multiple timeframes. Finding the sweet spot between long-term trend direct
FREE

Strategy Lab Gann Swing Signals (free indicator, MT5)
Backtest figures below are simulated. Past results do not guarantee future results.
What it does - Builds a classic Gann swing chart: a swing turns after 2 (adjustable) higher highs or lower lows. - Draws an arrow when a bar CLOSES beyond the last swing top (buy) or swing bottom (sell). - Every signal shows a Stop Loss just beyond the opposite swing, plus TP1 / TP2 / TP3 at 1x, 2x and 3x the stop distance. - Optional Gann 1/8 octave levels
FREE

VEO PRO – Vortex Elasticity Oscillator measures one thing well: how far price has stretched away from its adaptive equilibrium, and what the current impulse is doing about it.
All values are computed on closed bars. Nothing repaints.
What you see - State histogram: NEUTRAL, CHARGE (energy building) or RELEASE (energy being released). - Footer: state, bias, impulse phase and age, events, exhaustion and resumption, and the Chase Veto status. - Stretch (S): distance from a Kalman-filtered equilib
FREE

ICT 结构标签 — STH / STL / ITH / ITL 专业级 ICT 市场结构指标,可自动识别并标记图表上的短期高点 (STH)、短期低点 (STL)、中期高点 (ITH) 和中期低点 (ITL)。 工作原理 该指标检测分形摆动点,并按照真正的 ICT 方法论进行分类: STH — Short Term High(短期高点) STL — Short Term Low(短期低点) ITH — Intermediate Term High(中期高点,高于两侧相邻的高点) ITL — Intermediate Term Low(中期低点,低于两侧相邻的低点) 分类严格遵循 ICT 的相邻比较规则:每个摆动点最初被视为短期,在被周围摆动点确认后升级为中期。 主要特点: 精准的 ICT 结构逻辑,已确认的摆动点不会重绘 自适应摆动强度 — 根据时间框架自动调整(M1 至 MN1) 仅显示干净的文字标签 — 最大限度减少图表杂乱 可独立开关每种标签(STH、STL、ITH、ITL) 颜色和字体大小完全可自定义 最大摆动点数量限制,保持图表整洁 轻量且高性能 输入参数: Adaptive
FREE

Position Risk Calculator MT5
Description Position Risk Calculator MT5 is free. Drag the Entry, Stop Loss and Take Profit lines on the chart and read the lot size for the risk you chose. Lot, risk, R:R and margin sit in one floating panel.
Lot size from your risk - Risk as a percent of the account or as a fixed amount. Account size from balance, equity or a number you type. - Lot rounding: down (never above your risk), to the nearest step, or up. If rounding puts you over your risk, the risk t
FREE

ATR Volatility Monitor uses the Average True Range (ATR) to show, in one compact panel, how much the market is moving and whether that movement is high, normal or low for the current asset. It also draws an ATR trailing stop (chandelier stop) on the chart.
It is an information tool. It does not give buy or sell signals and it never opens, modifies or closes trades.
Panel
- ATR in price and in points.
- ATR as a percentage of price, to compare volatility between assets with very different pri
FREE

JT360 DNA Mini PnL Pointer V1.04 Public Компактно. Наглядно. Всегда перед глазами. JT360 DNA Mini PnL Pointer — это лёгкий индикатор для MetaTrader 5, который отображает суммарную текущую прибыль или убыток по всем открытым позициям текущего символа графика. Компактная индикация непосредственно на графике объединяет PnL относительно первоначального риска в формате R, тонкую мини-полоску и настраиваемую цветовую матрицу. Фирменные цвета JT360 — бирюзовый и пурпурный — выделяют крайние значения и
FREE

Innova Candle Clock
Countdown indicator for the close of the current candle in MetaTrader 5.
The indicator shows the time left until the current candle closes. It works on all timeframes, from M1 to MN1. It reads the broker server time, so the countdown keeps running even when no ticks arrive.
A counter next to the price shows the remaining time. A separate panel shows the countdown for several timeframes at the same time.
Before the close, the counter changes color and can raise an alert. T
FREE

Pattern Chief Starter is the free version of Pattern Chief. It draws the classic chart patterns on your chart - each with a clear plan: neckline, measured target, invalidation level and R:R.
The chart stays clean. Every label sits in a tidy column to the right of the last candle, with a thin line pointing to its price level, so nothing covers the candles at any zoom.
CHART PATTERNS (chart timeframe) - Head & Shoulders and Inverse Head & Shoulders (including the smaller right shoulder variant)
FREE
MetaTrader市场是独有的自动交易和技术指标商店。
阅读MQL5.community用户备忘更多地了解我们提供给交易者的独特的服务:复制交易信号,自由职业者开发的自定义应用程序,通过支付系统完成的自动付款和MQL5云网络。
