 MetaTrader 5
 Experts
 Indicateurs
 Bibliothèque
 Utilitaires
 Widgets
 Règles
Regardez les tutoriels vidéo de Market sur YouTube
Comment acheter un robot de trading ou un indicateur
Exécutez votre EA sur
hébergement virtuel
hébergement virtuel
Test un indicateur/robot de trading avant d'acheter
Vous voulez gagner de l'argent sur Market ?
Comment présenter un produit pour qu'il se vende bien
Indicateurs techniques gratuits pour MetaTrader 5 - 70
 Les signaux provenant des indicateurs techniques jouent un rôle crucial dans l'ouverture et la clôture des transactions sur les marchés boursiers et les marchés forex. L'essence des indicateurs est une transformation mathématique du prix d'un symbole financier visant à prévoir les changements de prix futurs. Testez les indicateurs techniques pour mieux prédire le comportement du marché et en tirer profit.
Quickview The Quickview indicator instantly highlights asset variations, delivering crystal-clear market insights at a glance. Effortlessly track multiple assets with visual simplicity, enabling quicker, smarter, and more confident trading decisions daily. ️ Key Features Real-Time Asset Tracking: Instantly monitor multiple assets simultaneously, never missing a critical market move. Flexible and Intuitive Display: Personalize your view, displaying assets exactly as you want—clear, concise, c
FREE
Take control of your trading workspace with the Switcher Dashboard – a smart and efficient tool that auto-detects all open charts (Forex, VIX, stocks) and turns them into neatly organized, color-coded buttons for instant chart switching. Key Features: One-click chart navigation – Seamlessly switch between charts with a single click. Trend visualization – Instantly identify bullish or bearish conditions with clear color cues. Flexible layout options – Choose from 4 customizable views (left, righ
FREE

Not everyone can write an indicator. But anyone can have an idea. The indicator Universal Main Window Free MT5 , which takes as an input parameter the formula by which the indicator line will be drawn, will help to implement it. This indicator is intended for use in the main chart window.
All indicators of the series Universal :
Main window Separate window Free MT4 Universal Main Window Free MT5 Universal Main Window Free MT5 MT4 Universal Separate Window Free MT5 Universal Separate Window Fre
FREE

Dynamic Theoretical Stop
Histogram indicator that dynamically analyzes the theoretical Stop levels in real time.
Operation :
The DTS - Dynamic Theoretical Stop does a mapping of fractals in previous candles and suggests two levels of Stop: For purchase and for sale.
Suggested reading :
It is necessary to make the definition of Maximum Stop in points in the Trading Plan. In this way, the trader can decide the best entry point by analyzing the theoretical stop levels:
Stop for sales: Shown a
FREE

The forex spread is the difference between a forex broker's sell rate and buy rate when exchanging or trading currencies . Spreads can be narrower or wider, depending on the currency involved, the time of day a trade is initiated, and economic conditions.
Forex Spread WatchDog :
This Forex indicator ensures that you are getting the best spreads while trading, and guards against broker spread widening.
FREE

TS Time Remaining - Indicador de Cuenta Regresiva para Velas en MetaTrader 5 El TS Time Remaining es un indicador gratuito diseñado para la plataforma MetaTrader 5 que permite a los traders visualizar en tiempo real el tiempo restante de la vela actual. Esta herramienta es especialmente útil para aquellos operadores que trabajan con estrategias basadas en la acción del precio y patrones de velas japonesas, ya que les permite anticiparse al cierre de la vela y tomar decisiones con mayor precisión
FREE
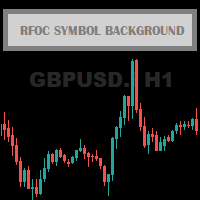
The RFOC Symbol Background was created to display the name of the asset and the current timeframe in the background of the chart.
Displaying the name of the asset at the bottom of the chart is often used by traders who are designing the screen for spectators, making it easier to identify the asset and the timeframe during a class, for example.
It is available for the user to select the font size (small, medium or large) and select the color for better viewing according to the background color
FREE

Expert Advisors often use a channel around standard MAs. The indicator builds such a channel and has three buffers: MA, MA Channel Top and MA Channel Bottom.
Now with the help of this single indicator you can plot a channel around the MA on the chart similar to similar Envelopes or Bollinger Bands.
There are a lot of strategies for using it: on the breakout of borders or on the bounce from them.
FREE
Индикатор отображает изменение баланса В правом нижнем углу окна.
Отображаются следующие периоды Сегодня Вчера 3 дня Неделя 10 дней Месяц 3 месяца Полгода Год Все время Есть возможность выставить расчетное время. Удобно пользоваться для расчетов прибыли/убытков с определенного часа.
Будет полезен например ночным скальперам. Данные совпадают с расчетами отчета в терминалее.
FREE
This is a free helper indicator for MT5 that will help traders setup their constant volume charts depending on their trading style. It will calculate the number of ticks that your constant volume chart should have depending on the following trading styles: Scalper Active Day trader Day trader Swing trader Position trader Instruction video attached.
Enjoy!
FREE
This indicator shows the value of returns in the selected time frame
They are calculated as logarithm of returns , rather than price or raw returns. For small returns, arithmetic and logarithmic returns will be similar. The benefit of using returns, versus prices, is normalization. It is possible measures all variables in a comparable metric despite originating from price series of unequal values
Inputs You can display data both as a Histogram or a Line It's also possible to display the a
FREE
La barre Time End de MMD est un simple indicateur qui indique le nombre de secondes restantes dans les trois intervalles sélectionnés. Selon la méthodologie MMD, le moment où un mouvement de prix directionnel se produit est important. Cet indicateur vous permet d'utiliser cette relation plus efficacement dans le trading Forex et Futures.
Descriptif des fonctionnalités :
Time Frame 1 Period - définissant le premier intervalle de temps Time Frame 1 Color - spécifiant la couleur pour le premier
FREE

นี่คือคําอธิบาย Trend SAR Fusion PRO MT5 (เวอร์ชัน Stable) จากโค้ดที่คุณใช้
แนวคิดของอินดิเคเตอร์ อินดี้ตัวนี้ = รวม 3 อย่าง EMA10 (เร็ว) → จับโมเมนตัม EMA100 (ช้า) → จับเทรนหลัก SAR (จุดดอท) → ใช้เข้า/ออก สรุป: "ใช้ SAR เป็นตัวเข้า แต่ให้ EMA คัดกรองว่าเข้าเทรนจริงไหม" วิธีดูสัญญาณ (สำคัญสุด) เทรนขึ้น EMA10 > EMA100 จุด SAR อยู่ "ใต้ราคา" จะเห็น จุดเขียว
เข้า BUY ได้ เทรนลง EMA10 < EMA100 จุด SAR อยู่ "เหนือราคา" จะเห็น จุดแดง
เข้า SELL ได้ ช่วงเปลี่ยนเทรน ม
FREE

*Used by MeditionSeed EA. Meditation is a practice in which an individual uses a technique – such as mindfulness, or focusing the mind on a particular object, thought, or activity – to train attention and awareness, and achieve a mentally clear and emotionally calm and stable state.[1][2][3][4][web 1][web 2] Plant a Meditation Seed to have wonderful future.
FREE
The Choppery notifier is an indicator that has been developed and tested for the purpose of alerting you that a candle is about to form, it takes away the trouble of having to play a guessing game as to when next a candle will form after a trend, therefore most of the time it eliminates the thought of having to predict which direction price will begin to move at. This indicator can be used in any timeframe, a notification will be sent out to you via email when price moves. you can start at a min
FREE
RCH FX Spread + Bar Close Countdown Indicator
What This Indicator Does
A simple, professional tool that displays real-time spread information and bar closing countdown directly
on your MT5 charts.
Key Features
• Real-time spread display - Shows current spread in pips or points
• Bar close countdown timer - Exact seconds remaining until current bar closes
• Customizable alerts - Audio notification before bar closes
• Fully adjustable display - Position, colors, fonts, and sizing options
• Works o
FREE

(Special New Year promotion - free price!) The indicator displays the actual 'Scale in points per bar' (identical to the manual setting in the Terminal, see screenshot)
in the upper right corner of the chart.
The displayed value changes INSTANTLY whenever the chart scale is changed! (This is very convenient when planning screenshots).
In Settings: Change language (Russian/English), font size of the displayed text, text label offset coefficient from the graph corner, equally in X and Y directi
FREE

**Measure Utility (R-Meter) — Journal de trades MFE/MAE et tableau de performance**
Arrêtez de chercher l'indicateur "parfait". Votre véritable avantage, ce sont les données — et cet outil les mesure pour vous.
Measure Utility est un indicateur léger, uniquement de mesure, qui enregistre automatiquement chaque trade et affiche votre performance réelle en direct sur le graphique. Il n'envoie, ne modifie ni ne clôture jamais d'ordres : il se contente d'observer et de rapporter, et reste donc to
FREE

Привет. Сегодня представляем индикатор корреляции - SynchroWindowTomson. Индикатор в одном окне показывает движение нескольких инструментов, по отношению друг к другу, удобно определять направление и изменение, особенно когда вы работаете с целым портфелем разных инструментов и нужно определить какой из них тянет результат назад и движется в другую сторону. Так же видны точки разворота спреда.
FREE
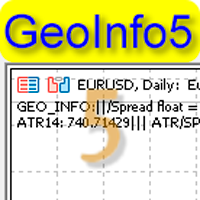
GeoInfo5 is one of the most informative indicators, it displays basic information about a trading instrument in a compact form. The version for the Meta Trader 4 terminal has gained wide popularity among traders. The indicator is free and will always be free. The launch version is now available for MetaTrader 5 as well.
displays information about the main parameters of the tool in a brief form in the line in the upper left corner of the chart: Spread, Swap for Buy order, Swap for Sell order, c
FREE

Display the date, time and price according to the movement of the mouse cursor on the chart This is useful for discretionary trading.
It is an indispensable tool for verifying and studying past market prices and trades. Characteristic Date,Time and Price are displayed.
The value follows the movement of the mouse.
You can change the color of the text. Please refer to the video on youtube. For MT5 only.
FREE

Fimathe Indicator The Fimathe Indicator is a tool for MetaTrader 5 designed to help traders identify support, resistance, neutral zones, and price channels. It features an interactive interface for drawing and managing support and resistance levels, generating take-profit channels and neutral zones, and providing visual and sound alerts for breakouts. Key Features Support and Resistance Lines: Dynamic and draggable lines to identify key levels. Reference Channel: Creates a channel between su
FREE

IDNR4 — Indicator Description (English)
The IDNR4 (Inside Day Narrow Range 4) is a volatility-compression pattern that identifies potential breakout conditions. It combines two concepts: NR4 (Narrow Range 4)
The current bar has the smallest high–low range compared to the previous three bars. Inside Bar (ID)
The current bar’s high and low are fully contained within the range of the previous bar. Signal Logic
• When the bar is NR4 only , it is highlighted as a normal contraction pattern.
• Wh
FREE

Arrêtez de deviner. Tradez avec précision.
QTS Super Hybrid Platinum n'est pas qu'un simple indicateur ; c'est un système de trading complet conçu pour les scalpeurs et les day traders exigeants en matière de précision et de sécurité. Combinant la puissance de l'analyse de l'action des prix institutionnelle (SNR) et du momentum de tendance (triple EMA), cet outil filtre le bruit du marché pour ne vous proposer que des configurations à forte probabilité.
Pourquoi QTS Super Hybrid Platinum ? No
FREE

Hollow Candles MA – Indicateur de Tendance Professionnel pour Hollow Candles Hollow Candles MA est un indicateur de suivi de tendance clair et efficace, spécialement conçu pour les graphiques Hollow Candles. Il compare le prix de clôture avec une moyenne mobile rapide et affiche clairement la tendance actuelle du marché en colorant les bougies : DodgerBlue = Tendance haussière (Close ≥ Fast MA) Rouge = Tendance baissière (Close ≤ Fast MA) Cet indicateur aide les traders à identifier visuellement
FREE

Nebryx BandPulse Matrix Professional Bollinger Bands Volatility Context Indicator for MetaTrader 5
PRODUCT OVERVIEW Nebryx BandPulse Matrix is a clean volatility-context indicator built around Bollinger Bands. It is designed for traders who want more than a standard band overlay. The indicator combines classic Bollinger Bands with volatility squeeze detection, expansion confirmation, band-walk trend context, stretch/overextension markers, and a compact chart status label.
The product focuses
FREE

Horizontal lines on the chart alternate between solid and dashed styles, representing areas of interest based on significant highs and lows from different timeframes, creating potential confluence between market structures. The indicator is designed to assist each participant in their own market studies, giving users the flexibility to combine the indicator with their personal trading system and analysis methods . The lines should not be used as standalone entry triggers . Instead, they are inte
FREE

Anchored VWAP — 5 draggable anchors with deviation bands Volume-weighted average price anchored to user-defined points on the chart. Drop an anchor where you want the VWAP to start — earnings, swing high/low, session open, any event — and the indicator recalculates from that bar forward. This indicator is available free of charge. What it does: Up to 5 independent anchors, each with its own VWAP line and color, running simultaneously on the same chart 2 configurable σ deviation bands (default ±1
FREE

Its Free For Only This Month After That You Will Have To Pay 100$ (You Have Only 5 Days) The Zoner: Precision Daily Range & First Red Candle Zone Indicator for MT5 Stop Guessing Market Direction. Trade Like a Professional. Are you tired of buying rigid, over-optimized trading robots that fail the moment market volatility shifts? Do you waste valuable minutes every morning drawing manual boxes, calculating daily high-low ranges, and searching for key institutional reaction zones?
Meet The Zon
FREE

ICT Dynamic Killzones — Custom Timezone Edition Cet indicateur dessine sur le graphique des boîtes de sessions de style ICT (Killzones), ainsi que les niveaux Previous Day High (Plus Haut du Jour Précédent) et Previous Day Low (Plus Bas du Jour Précédent). Il est conçu pour fonctionner sur les timeframes M1, M5 et M15. Sessions Couvertes L’indicateur prend en charge les sessions de trading suivantes, chacune avec sa propre couleur et étiquette configurables : Asia Session (Session Asie) London
FREE

Account Info Panel puts the numbers you check most often into one small panel on the chart, so you do not have to switch to the Trade tab.
What it shows - Balance and equity. - Floating P/L of open positions. - Closed today: profit, swap, commission and fees of deals closed since the start of the server day. Deposits and withdrawals are excluded. - Margin used and free margin. - Margin level, highlighted when it falls below 200%. - Today's drawdown: how far equity is below its level at the star
FREE

Day and Week Separators draws vertical lines at the start of each day, week and month on intraday charts, with an optional day-of-week label at each line. It is a small visual aid that makes it easier to see where one trading day ends and the next begins.
How it works - Day, week and month separators each have their own switch, colour and line style. - When several periods start on the same bar, only the strongest line is drawn: month over week, week over day. - The trading day can start at the
FREE

Opening Range Levels marks the high, low and middle of the opening range, the first minutes of a session you choose, and carries those levels through the rest of the day.
How it works - You set the window and its time zone: New York (default 09:30-10:00), London, Tokyo or your broker's server time. - US and UK daylight saving are applied automatically. Your broker's server offset is detected from the terminal; most brokers shift their clock with US daylight saving, which is the default, and a f
FREE

Spread and Swap Info shows the trading costs and timing details of the current symbol in a small panel, so beginners can check them without opening the symbol specification.
What it shows - Spread in points, with "(fixed)" when the broker quotes a fixed spread. - Swap long / short with the right unit for the symbol's swap mode: points, a currency (base, margin or account currency), percent per year, or "reopen". When swaps are disabled or both are zero it shows "Swap: none". - Triple swap day,
FREE

Anchored Periodic VWAP with Deviation Bands A lightweight, interactive VWAP indicator that restarts every Day, Week or Month, with a built-in on-chart control panel. Overview Anchored Periodic VWAP plots the Volume Weighted Average Price and resets it automatically at the start of each Daily, Weekly or Monthly period. Around the VWAP it draws two pairs of standard-deviation bands, so you can see at a glance where price is trading relative to the period’s “fair value”. You can switch the anchor p
FREE

This indicator automatically detects harmonic price patterns on your chart, both bullish and bearish, and shows them as soon as they form, including potential patterns that are still developing. For every pattern it draws the Potential Reversal Zone (PRZ), and for completed patterns it also draws two take-profit and two stop-loss levels.
Supported Patterns: Gartley, Bat, Butterfly, Crab, Deep Crab, Shark and Cypher. Each pattern can be switched on or off individually.
Key Features: Completed
FREE
Le Schaff Trend Cycle (STC) est un outil d'analyse technique conçu pour aider les traders à identifier les tendances et les inversions potentielles sur le marché. Il combine des éléments d'analyse de cycle et de moyennes mobiles, ce qui le rend particulièrement utile pour prédire les mouvements de prix dans divers instruments financiers, y compris le forex. Caractéristiques Clés Nature Prédictive : Le STC est connu pour sa capacité à fournir des signaux précoces sur des changements potenti
FREE
L'indicateur RSI Channel Binary est un outil spécialisé conçu pour le trading d'options binaires, tirant parti de la puissance de l' Indice de Force Relative (RSI) . Le RSI est un oscillateur de momentum qui varie de 0 à 100 , aidant les traders à identifier les conditions de surachat et de survente sur le marché. Dans l'indicateur RSI Channel Binary, les signaux clés suivants sont utilisés : Signal d'achat (CALL) : Une option CALL est indiquée lorsque le RSI dépasse le niveau de 30 .
FREE
L'indicateur Pattern ADX RSI est un outil de trading puissant conçu pour améliorer la prise de décision en combinant les forces de trois composants distincts : les signaux de motifs de prix , l'Indice de Force Relative (RSI) et l'Indice Directionnel Moyen (ADX) . Cet indicateur attend l'émergence de signaux de motifs spécifiques sur le marché, puis applique des mécanismes de filtrage basés sur les lectures de RSI et d'ADX pour confirmer la qualité du signal avant d'exécuter des trans
FREE
Le Trend ADX RSI Volumes est un indicateur technique avancé qui combine l'Average Directional Index (ADX), l'Indice de Force Relative (RSI) et les informations de volume pour fournir une analyse complète des tendances du marché. Cet indicateur est conçu pour aider les traders à identifier non seulement la force d'une tendance, mais aussi sa direction et sa validité. Caractéristiques Clés de l'Indicateur Mesure de la Force de la Tendance : L' ADX quantifie la force d'une tendance sur une
FREE
Le Trend ADX est une implémentation spécialisée de l'Average Directional Index (ADX) qui se concentre sur l'identification et la confirmation des tendances du marché. En utilisant l'ADX ainsi que ses indicateurs directionnels, le Trend ADX aide les traders à déterminer la force d'une tendance et à prendre des décisions éclairées. Caractéristiques Clés du Trend ADX Mesure de la Force : Le Trend ADX quantifie la force d'une tendance, permettant aux traders de savoir quand entrer ou sortir de
FREE
Flux Binary FX est un outil puissant conçu spécifiquement pour le trading d'options binaires et de forex. Cet indicateur innovant utilise une approche unique pour identifier des tendances significatives sur le marché, fournissant des signaux clairs pour améliorer vos stratégies de trading. Caractéristiques Principales : Détection de Tendance Flux : L'indicateur génère des flèches sur le graphique qui indiquent la présence d'une tendance flux. Cette fonctionnalité permet aux traders d'identif
FREE
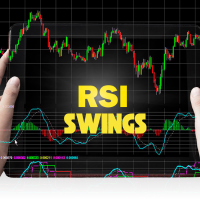
L'indicateur RSI Swings est un outil puissant conçu pour MetaTrader 5 (MT5) qui combine les principes de l'indice de force relative (RSI) avec les niveaux de prix hauts et bas pour améliorer les décisions de trading. Cet indicateur innovant aide les traders à identifier les points de retournement potentiels sur le marché en analysant les fluctuations de prix en conjonction avec les lectures du RSI. Caractéristiques Clés Analyse des Hauts et Bas : L'indicateur RSI Swings se concentre sur le
FREE
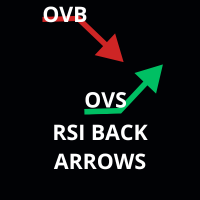
L'indicateur Flèches de Retour RSI est un outil puissant conçu pour les traders qui s'appuient sur l'Indice de Force Relative (RSI) afin d'identifier les éventuelles retournements de marché. Cet indicateur met en évidence lorsque le RSI sort des zones suracheté ou survendu , fournissant des signaux visuels clairs pour orienter les décisions de trading. Caractéristiques Principales : Indices Visuels : L'indicateur marque des flèches sur le graphique lorsque le RSI revient dans une zon
FREE
BB Out Arrows est un indicateur puissant et intuitif conçu pour MetaTrader 5 (MT5) qui améliore les stratégies de trading en utilisant les Bandes de Bollinger. Cet indicateur signale les opportunités de trading en affichant des flèches lorsque qu'une bougie se ferme en dehors des Bandes de Bollinger, mais avec une couche supplémentaire de précision grâce à un filtre de pourcentage de mèche. Caractéristiques Principales : Intégration des Bandes de Bollinger : Utilise les Bandes de Bollinger
FREE
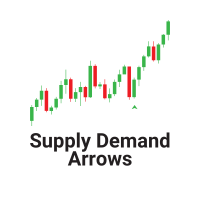
L'indicateur "Supply Demand Arrows" pour MetaTrader 5 (MT5) est un outil de trading puissant conçu pour aider les traders à identifier les zones critiques de l'offre et de la demande sur le marché. En marquant visuellement ces zones avec des flèches, l'indicateur améliore la précision des transactions et la prise de décision. Caractéristiques Clés Identification des Zones d'Offre et de Demande : L'indicateur met efficacement en évidence les zones clés d'offre et de demande sur le graphique
FREE

SMC Structure Map draws market structure, order blocks, fair value gaps and liquidity sweeps the same way every time: only from closed candles, with fixed rules you can read. What you see on history is exactly what you would have seen live — nothing is redrawn later. Application instructions Market structure Confirmed swing highs and lows labelled HH / HL / LH / LL (equal highs / lows as EQH / EQL). BOS (continuation) and CHoCH (change of character) when a candle closes beyond the active swing
FREE
What kind of day is it: a trend day, a range day, a reversal, an inside or an outside day? Day Type Map names every day on your chart, shows what today is so far, and how this symbol's past days were split between the six types. On gold over the last 250 days, 32% were range days, 17% trend-up days and 16% reversals. Free, clear, and checked against a separate implementation. What it does Each recent day is underlined and named in its own colour: trend up, trend down, range, reversal, inside or
FREE

Hello, traders. Ever stared at your chart wondering what really happened between those highs and lows? Well, allow me to introduce myself. I'm Inspector, your market structure detective
My job you ask? To investigate price action so you don't have to piece together every move yourself. I identify swings, classify market structure, measure retracements, and track how market behavior evolves, turning a busy chart into a clearer picture of what's happening.
Curious about a particular price move?
FREE

Votre lot peut risquer plus que le pourcentage que vous avez fixé. True Risk affiche le risque réel de votre prochain trade avant que vous ne l'ouvriez. Le problème Les courtiers arrondissent chaque lot à l'inférieur selon un pas et ne descendent jamais sous le lot minimum. Sur un petit compte, le lot minimum à lui seul peut représenter plusieurs fois votre plan. Avec 300 dollars et un stop sur l'or à 25 dollars, 0.01 lot risque déjà 25 dollars, soit 8.3 pour cent et non le 1 pour cent que vous
FREE

SX Sessions draws the Asia, London and New York sessions as clean boxes on your chart, with the daily open and the high and low of the previous day. The session times follow the clock changes in summer and winter by themselves, so the boxes stay in the right place all year.
What you get: - Asia, London and New York boxes from the session high to the session low, with a light fill and the session name - The running session is drawn with a dashed border and grows with the price - Asia: its size
FREE

BOA Swing Levels trouve les plus hauts et plus bas de swing sur l'unité de temps choisie et montre où la prochaine cassure peut commencer, où se trouvent ses objectifs et son stop, et à quelle fréquence ces objectifs ont été atteints dans l'historique de votre symbole. NIVEAUX Les niveaux sont trouvés sur les barres clôturées de l'unité de temps des niveaux (M15 par défaut) par un canal de prix de N barres : un swing se termine quand le prix sort du canal de l'autre côté, et son extrême devie
FREE

Volume Profile for MetaTrader 5 Get a clearer picture of market activity with Volume Profile for MetaTrader 5. The indicator shows how trading volume is distributed across different price levels, helping you spot areas where the market has been most active and where price may find potential support or resistance. Customize the profile to fit your trading style. Choose specific time ranges to focus on a session, trading day, or selected period, and adjust the colors to match your chart. Flexible
FREE

UT Bot Alerts Nexus là một chỉ báo tiên tiến, tối ưu hóa về mặt hình ảnh được thiết kế cho XAUUSD và các cặp forex lớn, dựa trên logic cốt lõi huyền thoại "UT Bot Alerts" (ban đầu do khái niệm QuantNomad / Quantower sáng lập). Nó kết hợp các cơ chế theo dõi cấp tổ chức với tỷ lệ biến động động của ATR để cung cấp trực quan hóa biểu đồ rõ ràng, có thể hành động. ️ Logic cốt lõi & Tính năng: Bộ lọc dừng ATR dừng: Sử dụng phép tính RMA/Wilder ATR chính xác để lọc các nhiễu thị trường và nắm bắt cá
FREE

QuantEdge Account Monitor montre l'état réel de votre compte dans un petit panneau. Il est gratuit et en lecture seule : il n'ouvre, ne modifie et ne ferme jamais aucun trade. Ce que vous voyez, en direct Equity, solde, profit latent et nombre de positions ouvertes Résultat du jour, de la semaine et du mois, en argent et en % du solde au début de la période (trades clôturés + latent) Drawdown depuis le pic d'equity, avec une barre de progression vers votre seuil d'alerte Drawdown maximal des tra
FREE

Willy R 4 DEMA – Multi-Timeframe Trend & Precise Entry Indicator Predict Overall Price Direction and Pinpoint Precise Entry Points with a Single Indicator! Willy R 4 DEMA is a powerful hybrid technical indicator built on the synergy of two classic momentum and trend tools: the Williams %R (%R) oscillator and the Exponential Moving Average (EMA) , enhanced further with Double Exponential Moving Average (DEMA) lines across multiple timeframes. Finding the sweet spot between long-term trend direct
FREE

Strategy Lab Gann Swing Signals (free indicator, MT5)
Backtest figures below are simulated. Past results do not guarantee future results.
What it does - Builds a classic Gann swing chart: a swing turns after 2 (adjustable) higher highs or lower lows. - Draws an arrow when a bar CLOSES beyond the last swing top (buy) or swing bottom (sell). - Every signal shows a Stop Loss just beyond the opposite swing, plus TP1 / TP2 / TP3 at 1x, 2x and 3x the stop distance. - Optional Gann 1/8 octave levels
FREE

VEO PRO – Vortex Elasticity Oscillator measures one thing well: how far price has stretched away from its adaptive equilibrium, and what the current impulse is doing about it.
All values are computed on closed bars. Nothing repaints.
What you see - State histogram: NEUTRAL, CHARGE (energy building) or RELEASE (energy being released). - Footer: state, bias, impulse phase and age, events, exhaustion and resumption, and the Chase Veto status. - Stretch (S): distance from a Kalman-filtered equilib
FREE

Étiquettes de Structure ICT — STH / STL / ITH / ITL Indicateur professionnel de structure de marché ICT qui identifie et étiquette automatiquement les Short Term Highs (STH), Short Term Lows (STL), Intermediate Term Highs (ITH) et Intermediate Term Lows (ITL) sur le graphique. Comment ça marche L’indicateur détecte les points de swing fractals et les classe selon la véritable méthodologie ICT : STH — Short Term High (Haut de Court Terme) STL — Short Term Low (Bas de Court Terme) ITH — Intermedia
FREE

Position Risk Calculator MT5
Description Position Risk Calculator MT5 is free. Drag the Entry, Stop Loss and Take Profit lines on the chart and read the lot size for the risk you chose. Lot, risk, R:R and margin sit in one floating panel.
Lot size from your risk - Risk as a percent of the account or as a fixed amount. Account size from balance, equity or a number you type. - Lot rounding: down (never above your risk), to the nearest step, or up. If rounding puts you over your risk, the risk t
FREE

ATR Volatility Monitor uses the Average True Range (ATR) to show, in one compact panel, how much the market is moving and whether that movement is high, normal or low for the current asset. It also draws an ATR trailing stop (chandelier stop) on the chart.
It is an information tool. It does not give buy or sell signals and it never opens, modifies or closes trades.
Panel
- ATR in price and in points.
- ATR as a percentage of price, to compare volatility between assets with very different pri
FREE

JT360 DNA Mini PnL Pointer V1.04 Public Компактно. Наглядно. Всегда перед глазами. JT360 DNA Mini PnL Pointer — это лёгкий индикатор для MetaTrader 5, который отображает суммарную текущую прибыль или убыток по всем открытым позициям текущего символа графика. Компактная индикация непосредственно на графике объединяет PnL относительно первоначального риска в формате R, тонкую мини-полоску и настраиваемую цветовую матрицу. Фирменные цвета JT360 — бирюзовый и пурпурный — выделяют крайние значения и
FREE

Innova Candle Clock
Countdown indicator for the close of the current candle in MetaTrader 5.
The indicator shows the time left until the current candle closes. It works on all timeframes, from M1 to MN1. It reads the broker server time, so the countdown keeps running even when no ticks arrive.
A counter next to the price shows the remaining time. A separate panel shows the countdown for several timeframes at the same time.
Before the close, the counter changes color and can raise an alert. T
FREE
Pattern Chief Starter is the free version of Pattern Chief. It draws the classic chart patterns on your chart - each with a clear plan: neckline, measured target, invalidation level and R:R.
The chart stays clean. Every label sits in a tidy column to the right of the last candle, with a thin line pointing to its price level, so nothing covers the candles at any zoom.
CHART PATTERNS (chart timeframe) - Head & Shoulders and Inverse Head & Shoulders (including the smaller right shoulder variant)
FREE
Le MetaTrader Market offre un lieu pratique et sécurisé pour acheter des applications pour la plateforme MetaTrader. Téléchargez des versions démo gratuites de Expert Advisors et des indicateurs directement depuis votre terminal pour les tester dans le testeur de stratégie.
Testez les applications dans différents modes pour surveiller les performances et effectuez un paiement pour le produit que vous souhaitez en utilisant le système de paiement MQL5.community.

Vous manquez des opportunités de trading :
- Applications de trading gratuites
- Plus de 8 000 signaux à copier
- Actualités économiques pour explorer les marchés financiers
Inscription
Se connecter
Vous acceptez la politique du site Web et les conditions d'utilisation
Si vous n'avez pas de compte, veuillez vous inscrire