 MetaTrader 5
 专家
专家
 指标
指标
 程序库
程序库
 实用工具
实用工具
 窗口小部件
窗口小部件
 规则
规则
适用于MetaTrader 4的新EA交易和指标 - 302
 EA交易自动执行市场交易,而指标可使您更准确地分析报价并预测价格行为。
通过这些应用程序,您将能够更明智地在MetaTrader 4执行交易,抓住更多的交易机会。
EA交易自动执行市场交易,而指标可使您更准确地分析报价并预测价格行为。
通过这些应用程序,您将能够更明智地在MetaTrader 4执行交易,抓住更多的交易机会。 
https://www.youtube.com/watch?v=UxrZ02V4jns
PARAMETERS EMA_1 = Periode MA 1 (Small MA period) EMA_2 = Periode MA 1 (Big MA period ) Start Trade : Hour Start Trade (only for the first open, does not apply to averaging) Stop Trade : Hour Stop Trade (only for the first open, does not apply to averaging) TF : M5, Only Pair EURUSD Lots : Lots / volume orders / Start Lot Martingale : True/ False Multiplier : Multiplier value of lot, You can use a small multiplier of 1.2 1.5 1.7 while Take Profit is

这个指标用变色柱子来显示趋势。简单易用。 使用方法: 如果柱子从青色变成紫红色,意味着趋势向上了。 如果柱子从紫红色变成青色,意味着趋势向下了。 参数: MaPeriods: 移动均线周期。 f1: 内层通道扩展系数。 f2: 外层通道扩展系数。 Popup Window Alert Email Alert Mobile Push Alert
报警: 当趋势发生改变后,从多头改成空头,或者空头改成多头 当价格从下向上穿越最上边的外层通道时,报警平多单 当价格从上向下穿越最下边的外层通道时,报警平空单 MT5版本: Gamma Bands
简单易用,回调是加仓做多,反弹是加仓做空.可以根据内层通道设置较小的止损,可以达到以以小博大的目的. 我们知道,没有完美的指标,需要配合你的策略,最终是依赖资金管理. 盈亏比和胜率就像鱼和熊掌不可兼得, 也就是盈亏比和胜率你只能搞定其中之一.

PipSense CBS (Candlestick Breakout System) is a fully automated trend following strategy with stop-loss that you can use to backtest a 10-year of data with modelling quality of at least 90%. It uses only an entry analysis based on the proprietary candlestick breakout system to detect price breakout movement. The success secrets of the Expert Advisor if backtested correctly are the combination of the entry method with the Money Management and multiple exit strategies. Once opportunity level is de

Advanced Trend Finder follow trend. Color change trend changed.
Works in EURUSD/GBPUSD/XAUUSD/USOIL/US500/USDJPY/USDCAD/JP225/USDTRY/USDMXN and all pairs
Best timeframes 5M/15M/1H/4H/DAILY
Signal on close of a bar.
DOES NOT repaint. DOES NOT repaint. DOES NOT repaint. DOES NOT repaint.
DOES NOT recalculate. DOES NOT recalculate. DOES NOT recalculate. DOES NOT recalculate Settings SoundOn : true/false EmailOn : true/false PushNotificationOn : true/false
ver 1.1 update notes:
Added Alert Arr

Smart Recovery is a fully automated Expert Advisor. This Expert Advisor is based on the Money Flow Index (MFI) and Trend Following Strategies. The Money Flow Index used to evaluate oversold and overbought market conditions. MFI values of 80 and over indicate overbought conditions, meanwhile, values of 20 and below indicate oversold conditions. For this indicator, it has been applied to be more efficient by modifying to be consistent with the current market conditions. This algorithm uses re

close all profitable orders The set contains scripts for different purposes, facilitating work in the MetaTrader 4 terminal. If necessary, a screen is provided for some scripts. Before working on a real account, check (on a demo account) whether the required script responds to your tasks (for example, there is a script for opening five orders at the same time, by default the lot is set to 10; so that you do not accidentally open five positions with a total volume of 50 lots - be attentive))) Use
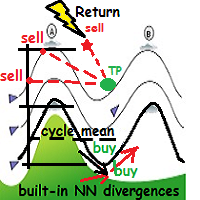
WindReturn is a fully automated solution to exploit the particular market tendence of the price to return, periodically and cyclically, to its own mean. This algo-solution is the result of years of research through charts and market theories with particular attention to dynamic behavior of currency pairs "ripples", encapsulating the observations in a technical art form.
Technical details WindReturn will mainly focus to profit in the short term trend ,but also in the "hot zones" where the pric

Space Grid is a fully automated Expert Advisor. Space Grid was developed and tested specially on eur/usd on a 5 minute timeframe . The backtest was performed with 99.90% quality data and shows excellent results. Tested with multiple spread levels, long swap and short swap included. It is essential to do the every tick backtest. Recommendations Symbol : EUR/USD Timeframe : 5 minute.
Parameters comment : comment of the order. magic_number : unique number for each chart start_lot : number o

The diamond top and bottom are reversal patterns. It represents a rally to a new high with a drop to a support level followed by a rally to make a new high and a quick decline, breaking the support level to make a higher low. The bounce from the higher low is then followed by a rally, but making a lower high instead. Once this behavior is identified, prices then break the trend line connecting the first and second lows and start to decline further. You can find MT5 version hier
Indicator shows

A signal will be formed when the needle stick is shaped like a needle. and you can set it in SHADOW. EA is good for TF5 with shadow 2 or 3 pips, and use martingale 1.5 - 2. Even better if the market is experiencing flats. This EA is only good for using the EURUSD pair and using the martingale system with a distance of TP 10-15 pips, sustainable with pipsteep 40 - 50 pips to open a martingale position if needed

这是一个交易辅助工具箱,并不是全自动交易的机器人 W10 系统请保持 100%的缩放比,如果超过这个值。按钮内的字体将超出按钮边框 常规: 一键下单、一键挂单、一键反手,自动设置止盈止损。 一键平仓、一键平多单(空单)、一键删除挂单。 一键反手、一键锁单、设置自动追踪止损。 根据画线追踪止损 非农: 消息突破单,可在非农或者其他重大消息时使用,在消息行情爆发前在当前价格上方 挂BUYSTOP,下方挂SELLSTOP。订单自动设置止盈止损。 划线下单: 支持最多四根做多趋势线或者做空趋势线并存。价格到达趋势线自动开单。 支持每根下单趋势线设置不同的仓位。 每根下单趋势线可以设置不同的止损趋势线、止盈趋势线。 支持止损止盈趋势线进行止损止盈追踪移动。 支持趋势线的“时效性”,如果价格运行到开单(止损、止盈)趋势线的右方仍未订单成交,则价格将永远不会接触到趋势线,策略失效。如需要请延长趋势线 杂项: 支持历史订单轨迹显示,可在图表显示历史记录中所有订单的下单轨迹,显示开仓价、平仓价、单量。 支持实时点差显示 支持平台信息显示,杠杆,一个点的价值,一手保证金,仓息,是否支持EA等等
FREE
Робот Standard Oscilators в своей работе использует широкий набор стандартных индик а торов MT4. Торговые решения принимаются на основе комплексного анализа показаний индикаторов. Без мартингейла. Без сетки ордеров — в любой момент времени может быть открыта только одна сделка. Робот создан строго для пары EurUsd, для таймфрейма H1. Торговые решения принимаются после закрытия очередной свечи. Для минимизации неизбежной в определенных условиях просадки и восстановления из нее в роботе реализован

Price Action EA for scalping. Open trades by bar height when bar height meet complex math calculations. Timerame is fundamentally M1 and works all forex symbols. Percentage trailing system. Time limitation. Autolot by percentage of balance. Settings by ea automatically. Close safety by time in minutes and close your order after x minute even if it is not in profit or loss by you. Set stoploss and takeprofit values automatically market price. Every major settings can be set automatically by robo

THEWINNERTURTLE EXPERT ADVISOR MT4 This EA is based on price action and RSI indicator to trade EURUSD currency pair on M15 timeframe. THEWINNERTURTLE is a price action swing system working for a long-term profit as showed by backtesting. THEWINNERTURTLE identifies price movement to easily find buy and sell opportunities and places automatically trades based on defined parameters. THEWINNERTURTLE does not use neither martingale nor averaging of losing positions. SETTINGS THEWINNERTURTLE is a long

Trend Line PRO 指标是一个独立的交易策略。 它显示趋势变化,交易的入口点,以及自动计算三个级别的止盈和止损保护 Trend Line PRO 非常适合所有元交易者符号:货币,金属,加密货币,股票和指数 该指标用于真实账户交易,这证实了该策略的可靠性 您可以在这里找到使用 Trend Line PRO 和真实信号的机器人: https://robomarket.org/product-category/signals/ 目前,Trend Line PRO指标的售价为75美元。 促销后价格为 149 美元 。
趋势线专业的优点 永远不要重绘它的信号; 将其作为独立策略的可能性; 它有三个自动水平止盈和止损水平 该指标具有iCustom信号缓冲区,允许您基于它创建交易机器人 具有通知功能 该指标已证明其在真实账户交易中的有效性
如何设置和优化趋势线PRO指标: 通过更改幅度参数以及 TP 和 SL 水平,将重点放在指标面板上的利润上 您可以使用以下方式自动优化指标参数: Optimizer Utility 详细说明(ENG): 这里
趋势线PRO指标如
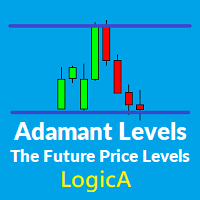
該指標繪製的水平非常“堅定”且性質強烈。
這些水平在一生中充當強烈的價格拒絕水平,從不重新粉刷。
為了將我所有的邏輯級別整合到您的交易系統中,需要以1個月的訂閱價格訂購6個月的所有邏輯級別。
希望這會有所幫助。
免責聲明:如果您正在尋找一個花哨,色彩鮮豔,引人注目的指示,請遠離。
沒有考慮價格可以保持,反彈或突破的水平,任何交易者都不能成為一個好交易者。
這些水平幫助交易者以更便宜的價格進入市場。它們可以是支撐阻力,需求供給,支點,斐波納契水平等。
經過多年對價格圖表的研究和分析,我發現很少有復雜的算法和邏輯來找出未來可能的價格行為。
在某些價格點上應用這些邏輯和算法,我達到了價格可以反彈或突破的水平。
我將它們命名為“Adamant Levels”。
是的,它們本質上是堅定的和靜態的。
價格被這些水平吸引並擊退。
這些是未來的價格行為水平,交易者可以通過更高的風險回報率進入市場。
大多數觸發點如價格模式,圖表模式,收斂和分歧,趨勢線故障等都出現在這些“堅定的水平”上。
所以等待在這些級別上發生觸發並進入。
特別注意不同堅定程度的融合
特別注意RS
该EA将使用独特的不平衡对冲策略将您的亏损交易变成赢家。一旦初始交易进入预定义数量的点数的负数区域,回收机制就会启动:它将在当前价格之上和之下放置有限数量的另类交易,直到所有这些都可以用很小的净利润结清。 [ 用户指南 | 安装指南 | 更新指南 | 故障排除 | 常见问题 | 所有产品 ]
特征
易于使用和监督
使用图表按钮轻松交易 完全可定制的职位管理 控制和预先计算的风险敞口 实施许多自动进入策略 交易微型账户从$ 1,000起 按外汇时段过滤交易
如何开始 将EA加载到任何图表和时间表 编辑设置,直到风险可以接受为止 使用图表按钮或启用入场策略进行交易
让EA工作并预定利润 重复! 如果市场长期保持平稳,复苏将在少数情况下失败。如果失败,则会导致计算的损失。
使用技巧 使用图表按钮加载EA并进行交易 请勿使用同一交易品种交易任何其他EA
每个交易品种只进行一次初始交易-绝不进行两次或多次交易- 如果未显示“购买/出售”按钮,则表示EA忙 EA可以同时独立交易许多交易品种 但是要小心:永远不要在同一符号上两次加载EA 无需设置其他幻数即可交易不同的交易品种 从VPS进
该EA使用顺序和受控mar来追回亏损交易:它以不断增加的手数进行连续交易,直到收回初始交易,再加上少量利润。它提供了一个完整的无忧交易框架,从管理初始交易到恢复交易。请注意,EA实施a交易,这意味着它将承担余额损失,并在以后追回。 [ 用户指南 | 安装指南 | 更新指南 | 故障排除 | 常见问题 | 所有产品 ]
特征 易于使用和监督
使用图表按钮轻松交易
控制和预先计算的风险敞口 实施许多自动进入策略 能够使用自定义指标进行交易 所有订单都设置了止损 交易微型账户从$ 1,000起 按外汇时段过滤交易 符合NFA / FIFO
如何开始 将EA加载到任何图表和时间表 编辑设置,直到风险可以接受为止 使用图表按钮或...开始交易 从输入启用输入策略 让EA处理交易并预定利润 重复! 在少数情况下,恢复将失败。如果失败,则会导致计算的损失。
使用技巧 使用购买或出售按钮加载EA并进行交易 切勿在同一时间强行买卖。每个交易品种进行一次初始交易 如果未显示“购买/出售”按钮,则表示EA忙 EA可以同时独立交易许多交易品种 但是要小心:永远不要在同一符号上两次加载EA 无需设置
该EA使用平均数将您的亏损交易变成赢家。一旦您的初始交易移至负数区域,恢复机制将启动并以固定的价格间隔向同一方向下达连续的市场订单,所有这些都将以合并利润或大约盈亏平衡的方式关闭。该机制与NFA / FIFO规则兼容并被美国经纪人接受。 [ 用户指南 | 安装指南 | 更新指南 | 故障排除 | 常见问题 | 所有产品 ]
特征
使用图表按钮轻松交易 完全可定制的职位管理 控制和预先计算的风险敞口 实施许多自动进入策略 可以使用自定义指标进行交易
交易微型账户起价$ 1000 按外汇时段过滤交易
平均过程是完全可定制的,间隔和手数可以从一个交易块增加到下一个交易块。
如何开始 将EA加载到任何图表和时间表 编辑设置,直到风险可以接受为止 使用图表按钮进行交易或启用进入策略 让EA处理交易并预定利润 重复! 在大多数情况下,恢复将成功,而在少数情况下,恢复将失败。不利于您的交易的强劲趋势将导致EA亏损。
使用技巧 使用图表按钮加载EA并进行交易 请勿使用同一交易品种交易任何其他EA
每个交易品种只进行一次初始交易-绝不进行两次或多次交易- 如果未显示“购买/出售”按钮,则
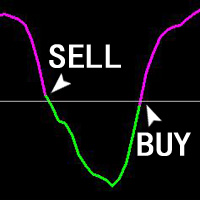
这款智币狙击指标分析系统使用了强大的内部循环调用指标自己的外部指标,然后,再前后周期调用分析。
本指标分析系统的数据计算非常复杂(前后循环周期调用),所以减小了信号的滞后性,而达到提前预测的准确性。
本指标可以用在MT4上的所有周期,最适合15分钟、30分钟、1小时、4小时的周期使用。
做多单:
当出现紫色线,并且紫色线在0轴上方,即可下单做多(买涨单)!
做空单:
当出现绿色线,并且绿色线在0轴下方,即可下单做空(买跌单)!
注意:
如果下单后出现了相反信号,最好的办法是立即平仓止损,并且再反向做单!
因为下单后出现反信号,这个时候持仓单的亏损会很小,所以止损掉也不会有很大损失!
我们下单盈利需要抓大波段,这款指标有很强的抓大波段的能力!而且滞后性非常小!

该指标在图表上显示利润区域,显示局部趋势的开始和结束 利润区PRO是完美的所有元交易者符号:货币,金属,加密货币,股票和指数
利润区PRO指标的优点:
输入信号而不重绘 该指标的算法允许您找到进入交易(购买或出售资产)的理想时刻,这为100%的交易者增加了交易的成功。 该指标有两个利润水平,允许您以保证收入部分平仓。 该指标分析交易的比例 该指标显示您的盈利/亏损交易的统计数据,以便您更好地了解Profit Zone PRO的交易总数中有多少确定了正确的交易方向 利润区PRO指标有信号缓冲区,允许您基于它创建交易机器人 通知到手机。 您可以轻松地坚持将消息发送到您的手机,不要错过一个强劲趋势的开始 最低存款额。 Minimum100的最低存款金额足以与Profit Zone PRO指标一起工作(对于外汇对和初始手数0.01),它是 易于安装和使用。 元交易的基本知识足以开始使用该指标并获利
Profit Zone pro指标如何工作 ? 在指示信号以向上或向下箭头的形式出现后,等待信号形成的当前蜡烛的结束 同方向开仓 设置离进场价格最近的极端的止损水平 在价格向信号移动

The indicator helps to identify possible rollbacks and reversals. Shows the direction of the price movement and is painted in the appropriate color. Allows you to conduct trend and counter trend trading It works on all timeframes, on any currency pairs, metals and cryptocurrency Can be used when working with binary options Distinctive features Does not redraw; Simple and clear settings; It works on all timeframes and on all symbols; Suitable for trading currencies, metals, options and cryptocurr
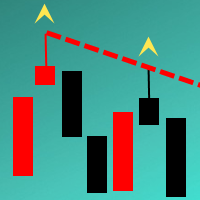
The Indicator automatically draws trend lines on the specified timeframe ( Trend lines period parameter). The lines are drawn based on the last two known fractals of the specified period. A peculiarity of this Indicator is that the lines are drawn with accuracy up to 15 minutes. It allows analyzing the chart on smaller timeframes without loosing the precision of drawing the lines in relation to the extrema of the prices. It is suitable for an intraday and medium term trading. The minimum timefr

Taurus All4
Taurus All4 is a high-performance indicator, it will tell you the strength of the trend, and you will be able to observe the strength of the candle. Our indicator has more than 4 trend confirmations.
It is very simple and easy to use.
Confirmation Modes Candle Trend Confirmations: When the candle switches to light green the trend is high. When the candle switches to light red the trend is reverting down. When the candle changes to dark red the trend is low. Trendline Trend Confirm

Технический индикатор Forex ForexMarshalsTrend - это уникальный, эксклюзивный и прорывной финансовый инструмент, основанный на сложном математическом алгоритме колебаний стоимости конвертации цены, который способен прогнозировать дальнейшие изменения цены. Индикатор относится к группе трендовых индикаторов. Он предоставляет возможность принимать правильные решения о своевременном входе или выходе из рынка и в своих настройках указывает, следует ли открывать длинную или короткую позицию для получ

Advisor is an improved and enhanced version of ParabolicSarPro . It has a large number of adjustable parameters. Advisor Parameters:
Lots - lot size; Percentage of free money - percentage of free funds for opening each new transaction (works when Lots = 0); Slippage - slippage (maximum permissible price deviation in points); Magic - a unique identifier (it is necessary to do it differently, if several advisers are running in one terminal); MaxSpread - maximum spread for opening a trade (for

The strategy of the adviser is based on the theory of falsals: a fractal is a set that has the property of self-similarity (an object that exactly or approximately coincides with a part of itself, that is, the whole has the same shape as one or more parts).
A trading expert analyzes four fractal orders of price formations - one fractal order down, the fractal order of the current timeframe and two orders of fractals higher than the timeframe.
Recommended trading tools for the default settings

This adviser can be used without optimization. To get started, you only need to install the desired risk (or the size of the lot) and regularly withdraw profit. For a start, you can install the trial version of the Expert Advisor Hunter bot PriceLines Lite , which will work on a real account with a minimum lot (and therefore with minimal risk). In this, the main version, all settings are available. EA is designed for fully automated trading. It spelled out the function of protection against most

An expert advisor which tries to take quick trades based on a combination of the latest Stochastic oversold/overbought status and Kagi chart transitions. It closes at minimum amount of profit depending on your risk appetite. Trade position size is also gradually increased automatically depending on risk parameters. Although you can use this on any time frame and symbol, The expert is designed specifically to trigger trades based on the 1 minute time frame and it is optimized for the EURUSD symb

DYJ StrongCurrency EA是基于各种技术指标,移动平均线和枢轴的完整交易系统。这些元素中的每一个都可以通过定义的规则和系数进行评估(取决于指标),为DYJ StrongCurrency EA提供了无限优化的方案。DYJ StrongCurrency EA通过评估数据创建一个趋势强度和入场信号列表显示,它显示所有货币对的数据。根据每个货币对趋势强弱获得入场信号。列表数据包括Symbol,LastEntryies,LastPercent。其中LastEntryies,LastPercent内容显示入场价格,时间,货币对趋势百分比。趋势强度大于70%时,认为是强货币对;该工具适用于外汇市场,指数,金属的数据。 EA默认是任何时间都能交易。3段工作时间参数是日内范围的。 例如,如果要设置从19:00 PM到05:00 AM的工作时间,则必须定义两个不同的时间间隔,例如19:00至23:59和00:00至05:00。 EA的新闻交易是基于经典StrongCurrency趋势策略的。您只需要从EA属性进行新闻时间和入场周期配置,其余部分由机器人自动处理。 例如设置新闻时间是19:5

PipSense Ichimoku is a fully automated trend following strategy that you can use to backtest a 10-year of data with modelling quality of at least 90%. It uses only an entry analysis based on the Ichimoku Indicator with a proprietary settings to detect price breakout movement. The success secrets of the Expert Advisor if backtested correctly are the combination of the entry method with the Money Management and multiple exit strategies. Once opportunity level is determined, it will open trades rig

UniversalIndicator is a universal indicator. A great helper for beginners and professional traders. The indicator algorithm uses probabilistic and statistical methods for analyzing the price of a trading instrument. The indicator is set in the usual way. Advantages of the indicator works on any time period works with any trading tool has a high probability of a positive forecast does not redraw Indicator Parameters LengthForecast = 30 - the number of predicted bars

【分析大师】 简介 分析大师是一款强大的MT4交易数据,交易策略统计分析软件,可以为用户体提供直观的账户表现,同时具有复盘交易轨迹的功能。 可以有效帮助用户做基础的盈亏统计,并直观看到自己的交易是否稳定,自己的交易策略是否需要调整。 使用方法 将其拖入任意货币对图表中,即可展示其效果。 如果统计数据不全,请检查历史交易记录是否完全显示,因为程序是从历史记录中读取并转化成可视数据图像的。 功能 根据历史盈亏,将交易成绩可视化,直接查看盈亏曲线。 统计不同币种历史盈亏及交易单量,方便我们总结什么品种好盈利,什么品种容易亏损。 可以复盘交易轨迹在K线图标上,方便观察交易策略。 显示每日/每周/每月交易盈亏数据,方便查看账户收益率。
如果遇到问题,可以咨询我,为你提供使用帮助。
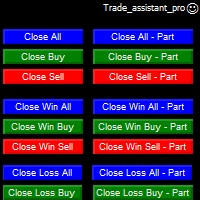
Trade Assistant helps in order management. Just run EA, set up your settings and open a store. EA automatically set = Target Profit, Stop Loss, Trailing Stop / Break Even, Close Trade after + "X" pips (Volume Size "X"%), Delete Pending Orders After "X" Seconds. See the buttons on the chart. He works to close trade, close partialli trade and delete orders
parameters: Set button - close partially (close all part) Volume Size "X"% More settings Enable / Disable Target Profit Target profit Enable
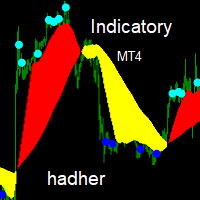
Indicatory is an indicator uses price action and averaging movement to trigger it's signals buy signal when the blue sun completely sunset's under the yellow clouds Sell signals when the aqua sun completely rise's over the red clouds you could call the indicator to any EA code for auto trading ,optimizing,sell signal index buffer number is (2) buy signals index buffer number is (3)... try to avoid weak signals which occur at the end of clouds ,strong signals occur's when there is a wid

TIMES TRAVEL IN THE TRADE
Now you have found what you were looking for !!
The Times is based on the probabilistic approach.
This EA has been working for years, is a very complex research project with the ultimate goal of creating a perfect trading robot.
This project has several updates!
This robot does not work with Grid or Martingale / Obs: There is a martingale option in it, but we do not use it, it is only for those who want to be at high risk!
The EA comes with fixed Stoploss and fix

The indicator is designed for opening trades for a long period. he is set up to get as many points from each trade as possible. he uses the scalping method... you can trade on any currency pairs indicator is already you can trade at any time of the day but the preferred time of trading during the European American session. currency pairs eur / jpy, eur / usd currency pairs with high volatility then the results are much better.

With this indicator you'll have a general reading of the market's range using Gann's calculating modes. Gann's swing is used to have a quick reading to the market latest movements at first glance. The foundation of this swing calculation is in the count of candles in relation to the break-up and break-down of the price. When the price breaks-up the last maximum, the swing will get traced if a certain number of candles is exceeded from the last minimum. It can be used a "pure Gann" or not: If set

Over Arrow - уникальный авторский индикатор, имеющий возможность отображения сигналов в направлении основной тенденции, или против нее. Over Arrow подходит для любого таймфрейма, валютной пары, но лучше всего использовать его на средних временных периодах, таких как М30, Н1, Н4. Сигналы индикатора не пропадают ни при каких условиях. Отличительной особенностью является наличие фильтра тенденции, при активации которого, сигналы будут появляться только в направлении основного движения.
Параметры
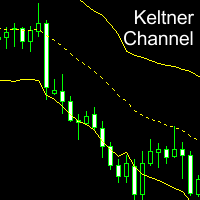
Keltner Channel is a well known indicator that not in MT4's indicators default lineup (You can get this from your broker somehow). This indicator helps you to define trend and sometimes overbought/oversold prices during flat trend. Input Description: EMAperiod: Moving Average period used for indicator. Must be higher than 1. ATRperiod: Average True Range period used for indicator. Must be higher than 1. multiplier: Multiplier used for determine channel's wide. Must be higher than 0 but may not b
FREE

This EA is a free version of Tiger Grid which is available here: https://www.mql5.com/en/market/product/33835
Tiger Grid EA is an expert advisor using trading strategy which has been developed by using machine learning concepts. It has passed 14 years of backtest of real tick data and real variable spread (with commission) from 2004 to 2018. The entries are usually accurate and in case if the trend signal has a delay the positions will be managed by a smart grid system. This system uses a gr
FREE
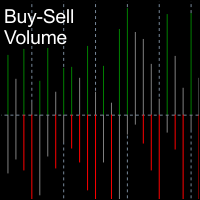
BuySell Volume is an indicator that approximates Buy and Sell volumes based on price movement. Input Description: applied_model: Choose the applied model. In low reversal mode, price is considered receive low bearish pressure during bullish candle's creation (high bearish pressure on high reversal model. In other words, Bullish Marubozu candles has really high Buy Volumes in low reversal model than in high reversal one.
Output Description: Buy and Sell Volume: Determines how many Buy and Sell vo
FREE
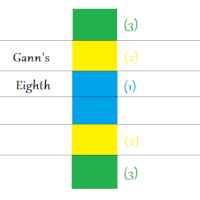
This indicator will let you have at disposal Gann's Eighth, with few clicks!! Gann's Eighth were used by this great Trader to obtain the maximum fluctuation price and the possible inversion points of it. Gann have always given importance to the number 8 in his studies, an it is the reason why we find the retracement points as 0.25(10/8=1.25). Other than the number 8, also the numer 3 had is own importance in Gann, number founded in the eighth division, infact we have three eighth describing the

NIGHTCRUSHER is a fully automated expert advisor, designed for scalping on quite market situation.
The Lite - Version is limited to minimal Lot per Pair and dont has lot mulitplier and dynamic function you can also run different strategies like swing trading or grid different Trade Entry Signals different Exit Strategies included (MA Cut / Signal Change / Trailing TP) clever Risk & Money management - Balance based - Longrun trades tracking You can also use a Grid function or Lot multipier, if ne
FREE

Советник основан на принципе трейдеров "Трэнд-ваш друг". В работе используется только наличие трэнда и направление цены. Алгоритм советника очень простой и настроен на максимальное нахождение в рынке во время трэнда и флэта. Для более комфортной работы в советнике используются некоторые функции,которые сглаживают непредсказуемые последствия рынка. умножение объема,в случае неудачного закрытия предыдущей позиции. слежение за ценой с помощью "Trailing Stop". возможность ограничения работы в опре

MHA News Trader v1.0 This Is a News Trader EA that has many similarities to other News traders. Strategy is placing two pending order some seconds before releasing high impact economic news on investing.com and removing remaining pending order some seconds after news releasing time and there are some extra features like trailing Stop , hidden trailing stop , recovery loss and lot multiplier. But what is very important it's choosing proper setting of parameters in proper broker. The EA is tested

TigerGrid EA MT4
TigerGrid EA robot is a fully automated robot for Forex trade. TigerGrid EA is based on the price actions and support and resistance, combine numerous indicators ,that It provides the possibility the best entries of the trade . This system uses a grid of orders . A new order is added into the grid only if the EA notice a potential reversal trend. The grid size is limited for more safety It can be used in any time frame but we recommend H1 . Do not believe in any backtest re
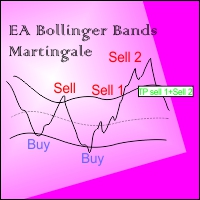
EA BB Martingale If the price touches the upper Bands then OP SELL. However, if the price rises again from the previous order, OP SELL will return with a larger Lot, if it goes down to the previous price then Close all sell transactions together (of course this profit has been calculated ), Conversely if the price touches the Lower Bands then OP BUY
This EA can run in two different directions (Buy will be counted separately from Sell orders) #Recomend Start Balance $1000 Flat movement is very
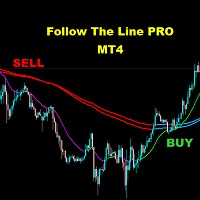
FOLLOW THE LINE (PRO VERSION) This powerful indicator is the full and complete version of my free indicator called "Follow The Line". IT IS BASED ON the popular maxim that: "THE TREND IS YOUR FRIEND" It gives alarms and alerts of all kinds. IT DOES NOT REPAINT and can be used for all currency pairs and timeframes.
AVOID FALSE SIGNALS:
BUY ONLY when price closes above the green line and the green line is above the blue channel.
SELL ONLY when price closes below the pink line and the pink line i
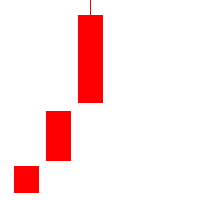
Outline A strategy based on K-line shape requires only three K-lines. Grasping opportunities quickly when the market is emotional can not only get into the market as soon as possible, but also make great profits. Understand the market through three K-lines. Parameter Lots: The basic position at the time of placing an order is 0.1 by default. SlipPage: Consider the impact of sliding points in trading,Default 3 base points.

Trading Hours:
useTradingHours = false; - if it is true, the system opens trades only in defined time;
StartTime = "06:00"; - start time of trading;
StopTime = "18:00"; - end time of trading;
GMT_Offset = 0; - GMT offset;mnvnmkvbb
Trading Days:
Monday = true;
Tuesday = true;
Wednesday = true;
Thursday = true;
Friday = true;
Saturday = true;
Sunday = true;
View settings:
showMenu = true; - if true, EA shows on graph information about open trade


The Wolfalizer Indicator combines the functionality of the Engulfing Stochastic along with the ConsecutiveRSI and adds alerts along with more detailed output to the journal. This Indicator will alert you when RSI or Stochastics cross into oversold or overbought. You can set the oversold and overbought levels for RSI and Stochastics separately. You can pick if you want an engulfing candle to appear on the cross or set a number of consecutive candles you would like to see. Interesting Inputs i
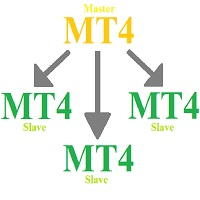
MHA Local Trade Copier
It's an EA to copy trade from one MT4 account to another MT4 account. Also you can copy trades from
single master account to multiple slave accounts. Only you should run master and slave accounts at same PC or VPS. Master account could use main password or investor password, but slave accounts needs to login by main password.
Using this copier you can copy trades between different brokers with different symbol suffix.
For example if broker of master account has EURUSDi

Djuba Breakout System
Djuba Breakout System is a fully automated breakout trading system.
Features
1. 100% Free
2. 100% automated trading system
3. No Martingale, No Grid
4. Trade with SL & TP
Recommendations
1. Pairs: EURUSD, GBPUSD
2. Timeframe: H1
Parameters
1. Lots: default lots. ignored if LotsFor1K > 0
2. LotsFor1K: lots per 1000 USD
3. MaxOrders: please set to 10
4. TestGmtOffset: the GMT offset for the backtest
FREE

22.12.2020 New version is released. Bug fixed and exit by MA removed.Improved fully automated Expert Advisor without martingale. Follow the trend. Checking important trade levels.
It is complex calculated to catch right trend strategy. Special candles, custom indicator and maths are used for entries. Live Results shown at here https://www.mql5.com/en/signals/669290 Default settings recomended for EURUSD m1/m5 gmt +3(or +2 winter time) . Click here for the symbol sets you can make testing .
Grid Manual是一个交易面板,用于处理订单网格。 该实用程序是通用的,具有灵活的设置和直观的界面。 它不仅可以在亏损方向上设置订单网格,还可以在盈利方向上设置订单网格。 交易者不需要创建和维护订单网格,实用程序会这样做。 打开一个订单就足够了,Grid manual会自动为它创建一个订单网格,并伴随它直到非常关闭。 完整说明和演示版 此處 。 该实用程序的主要特性和功能: 伴隨以任何方式打開的訂單,包括從移動終端打開的訂單。 適用於兩種類型的網格:“限制”和“停止”。 使用兩種方法計算網格間距:固定和動態(基於 ATR 指標)。 允許您更改未結訂單網格的設置。 顯示圖表上每個網格的盈虧平衡水平。 顯示每個網格的利潤率。 允許您一鍵關閉網格中的盈利訂單。 讓您一鍵關閉每個訂單網格。 允許您對訂單網格應用追踪止損功能。 允許您在訂單網格上應用將訂單網格的止損轉移到盈虧平衡水平的功能。 相對於訂單網格的盈虧平衡水平自動重新排列止盈(僅在限價網格模式下,距離取決於所選的計算類型:“保守”或“激進”)。 最多可管理 20 個訂單網格,每個網格最多可包含 100 個訂單。

Breakout Pro 黄牛解决方案 该指标是 RPTrade Pro Solutions 系统的一部分。
Breakout Pro Scalper 解决方案是使用价格行为、动态支撑和阻力的每日趋势指标。 它旨在供任何人使用,即使是绝对的交易初学者也可以使用它。 从不重新粉刷。 指示是从接近到接近给出的。 设计为单独使用,无需其他指标。 在一天开始时为您提供趋势和潜在的获利。 特定图表根据历史数据向您显示潜在利润。
它是如何工作的 Breakout Pro Scalper 解决方案使用结合价格行为和动态支撑和阻力的突破策略。 分析夜间趋势和波动性以在第二天使用。 通过该分析确定突破限制(蓝色和深橙色线)以及止盈 由于图表上的图表,可以立即检查策略和设置的“成功”。 OnChart 图表允许立即查看策略中是否存在任何“漏洞”,并最终选择另一个更适合的时间帧或符号。 实时从蜡烛收盘到蜡烛收盘,趋势指标等待信号条件有效,然后通过箭头显示(绿色表示买入,橙色表示卖出) 红色点划线显示了止盈和最终止损的位置。 交易是一一指示的,永远不会同时进行两笔交易。 大多数交易(80%)在白天完成

自动执行 ACB 突破交易流程 ACB Breakout Arrows EA 会分析当前图表上的突破信号,并通过内置的 ACB Breakout Arrows 和 ACB Trade Filter 逻辑管理交易。将 EA 加载到需要监控的品种和时间周期图表,启用自动交易,然后根据测试计划设置仓位、交易时段、筛选器和退出规则。 所需指标和依赖项已经嵌入 EA,无需另行下载。这些指标面板不会显示在图表上。EA 会显示自己的交易操作,并在启用 Logging 后把运行信息记录到平台 Journal 中。 在开仓前确认入场条件 Signal Sensitivity 控制突破需要达到的强度,只有满足条件时箭头逻辑才会接受信号。Bars for SL 控制在止损方法使用指标价位时所参考的 K 线数量。 启用 ACB Trade Filter 后,EA 可以要求箭头、柱状图和趋势状态保持一致: 买入确认: 向上箭头、绿色柱状图和看涨趋势。 卖出确认: 向下箭头、红色柱状图和看跌趋势。 混合状态: 灰色柱状图和横盘趋势会阻止新的入场。 控制仓位大小和退出方式 仓位大小: 选择固定手数,或根据 Risk

该系统是两种策略的组合,一种互补。主策略使用虚拟交易线来打开它的订单,另一种策略打开一个或多个订单以在价格超出预定范围时实现盈利。
虚拟交易线也基于交易通道,也可以在计算的通道线之上或之下进行交易。第二个策略也使用相同的通道,但添加了其他交易条件来打开交易。对于第二个策略,在价格移出通道后,MACD 指标用于确认交易条件。
从 4.4 版开始,默认设置已更改为更好的设置,原始默认设置、适配设置(从 4.3 到 4.4)和其他 4.4 版的其他设置可以在帖子 #89 的“评论”部分找到。 货币对:欧元/美元。
时间范围:M 15。
参数 :
魔术 - 魔术数字。
手数 - 如果使用的手数是固定的且不使用自动手数管理,则手数大小;
Manage_Lot - true/false - 如果为 true,EA 将自动计算手数;如果为 false ,将使用固定手数;
Risk Percent - 用于自动手数管理,如果设置为 1,Manage Lot 设置为 true,它将为账户净值的每 100 美元打开 0.01 手数。
硬止损 - 是一种正常的止损,以点数设置,基于挂单放

基于具有标准参数的MACD指标波
在最后两个MACD波上分别对正面和负面交易斐波纳契水平,
如果负波浪在MACD指标上结束,则颜色为绿色,
如果正波在MACD指标上结束,那么颜色为红色。
Wave的终止标准是两个滴答,MACD的符号不同。
在最近四次MACD波浪中绘制趋势线。 与专家合作很好 Figures MACD https://www.mql5.com/ru/market/product/42031 更多截图:
https://www.mql5.com/ru/charts/10581596/audusd-h1-alpari-international
https://www.mql5.com/ru/charts/10631979/usdjpy-m1-alpari-international
https://www.mql5.com/ru/charts/10628704/gbpusd-m15-alpari-international
杯子和手柄模式是类似于杯子和手柄的技术价格结构,其中杯子呈“ U”形,并且手柄略有向下漂移。图案的右侧-手柄-小于左侧-杯形,并且从顶部回撤不超过50%。它既可以是延续模式,也可以是逆转模式。 [ 安装指南 | 更新指南 | 故障排除 | 常见问题 | 所有产品 ] 清除交易信号 可自定义的颜色和尺寸 实施绩效统计 可自定义的尺寸和图案特征 显示适当的止损和获利水平
它是不可重涂和不可重涂的 它实现了电子邮件/声音/视觉警报
输入参数
幅度:幅度表示替代价格点之间的最小柱线量。要找到大图案,请增加幅度参数。要查找较小的模式,请减小幅度参数。 杯子平整度比率:此参数描述杯子的顶部相对于杯子大小的“平整度”。较高的值将发现更严格的模式,但频率较低。较低的值将找到更多的模式。 最小句柄回撤:模式句柄中需要的最小百分比回撤。 最大。回撤:模式句柄中可能的最小百分比回撤。 最大历史柱数:指标在图表中加载时要评估的过去柱数。 显示统计信息:显示或隐藏统计信息显示板和效果数据。 显示止损/止盈水平:显示或隐藏止损和止盈水平。
绘图选项:看涨或看跌的线条和标签的颜色和大小以及字体大小。 突破:突破

Close all Positions by one click with Fast system strategy, work with every pairs. By the way you can set to "Close all Sell", "Close all Buy" and Close all Orders on a Common Setting. This is a MetaTrader 4 Expert Advisor, Not working on MetaTrader 5.
Thank You FxGangster Powered by TheFxInvestment.com Twitter : @FxGangsterClub Email : Admin@TheFxinvestment.com
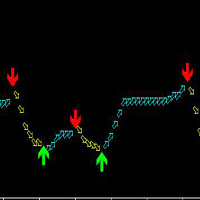
这款指标适合MT4上的任何品种,也适合任何周期,但是最适合的周期是30分钟和4小时,使用简单,箭头出现绝对不改变,不漂移,不会马后炮。 这款指标的原理是根据ATR和自定义MA,再加上混合计算,研发出来的,准确率高。 买涨:看绿色向上的箭头; 买跌:看红色向下的箭头; 箭头出现即可立即下单! 建议两个周期一起看,会更准确,也就是先参考大周期的趋势(大周期里面的大箭头走过后),再看小周期的箭头! 下面是更好的使用方法: 智币A使用!两个周期一起看更准确,比如,你看5分钟箭头做单,就先看看15分钟上是不是相同趋势(也就是相同箭头中),如果是相同就做单,大周期上不同就不要做单!: 如果15分钟当前是向上箭头后,5分钟周期出现向上箭头就做多单(买涨); 如果15分钟当前是向下箭头后,5分钟周期出现向下箭头就做空单(买跌); 如果看1分钟做单,就再看看5分钟周期;。如果看15分钟做单,就再看看1小时周期;。如果看30分钟或1小时做单,就再看看4小时周期;。如果看4小时做单,就再看看日图!。 更多好用的指标网址: https://www.mql5.com/en/users/zhengqiuyang/
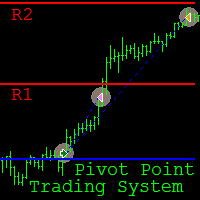
Pivot Point Trading System is a fully automated Expert Advisor (EA) designed for intraday trading on the M15 time frame . The main currency pair is GBP/USD , however it can be used on other pairs, provided that the input parameters are selected through optimization in the strategy tester. The EA implements trading strategies based on the breakout and rebound from the Pivot Point levels . The principle of the EA consists in order opening in the direction of the breakout of the Pivot Point level (

This indicator was tested on the basis of real statistics for all market indicators according to indicators for 3 months of trading. trade forecasts for usd / jpy on the m30 time frame were received on our statistics! if you have any questions, please contact us in private messages or in discussions under this indicator and we will figure it out and help
any questions will arise personal messages or in discussions under this indicator As soon as the blue points appear, we open a deal to increa

Swing & Price Action Trader ( SPA Trader) How to trade with SPA Trader? SPA Trader is a very special tool for both Automatic and Semi-Automatic trading . It works as an Indicator and Expert Advisor to trade fully automatic, if trader sets it to true and by false setting , then it will trade when trader enter into the position via SPA Trader manually, but the money management and risk management functions remain automatically to manage the opened positions for trader... The SPA Trader is the

Arrow indicator showing market trends The histogram shows the direction of movement, and the arrows indicate favorable points for opening positions. Can be used on any currency pairs, metals and cryptocurrency Suitable for working with binary options
Distinctive features Defines a change in trend; Works on all timeframes and on all symbols; Suitable for trading currencies, metals, options and cryptocurrency (Bitcoin, Litecoin, Ethereum, etc.) Suitable for manual trading and for developing advis

The Extreme Breakout EA Lite is a fully automated multi currency Expert Advisor that trades time based breakouts and has various options to improve performance. The Extreme Breakout EA Lite trades using pending orders and has the option to enter using market orders if required. Lite version is limited to 0.01 lots without money management.
View More Products - https://www.mql5.com/en/users/robots4forex/seller#!category=1
Monitoring Signals - https://www.mql5.com/en/signals/author/robots4forex?o
FREE

Grid Zone is an automated expert advisor. The system uses filtering measurements from trend signals to create buy zones and sell zones. Trading signals are processed by allocating them into the design zone. The system will automatically calculate the grid distance or the user can set it manually. The key is that it works well in all market conditions, either trend or sideways. The system has automatic management in terms of limited orders. The system can automatically manage delete pending orde
您知道为什么MetaTrader市场是出售交易策略和技术指标的最佳场所吗?不需要广告或软件保护,没有支付的麻烦。一切都在MetaTrader市场提供。
