Bar Size Pro
- Göstergeler
- Makarii Gubaydullin
- Sürüm: 2.0
- Etkinleştirmeler: 20
Calculates the price change on each timeframe: floating or last closed bars.
My #1 Utility: includes 65+ functions | Contact me if you have any questions | MT4 version
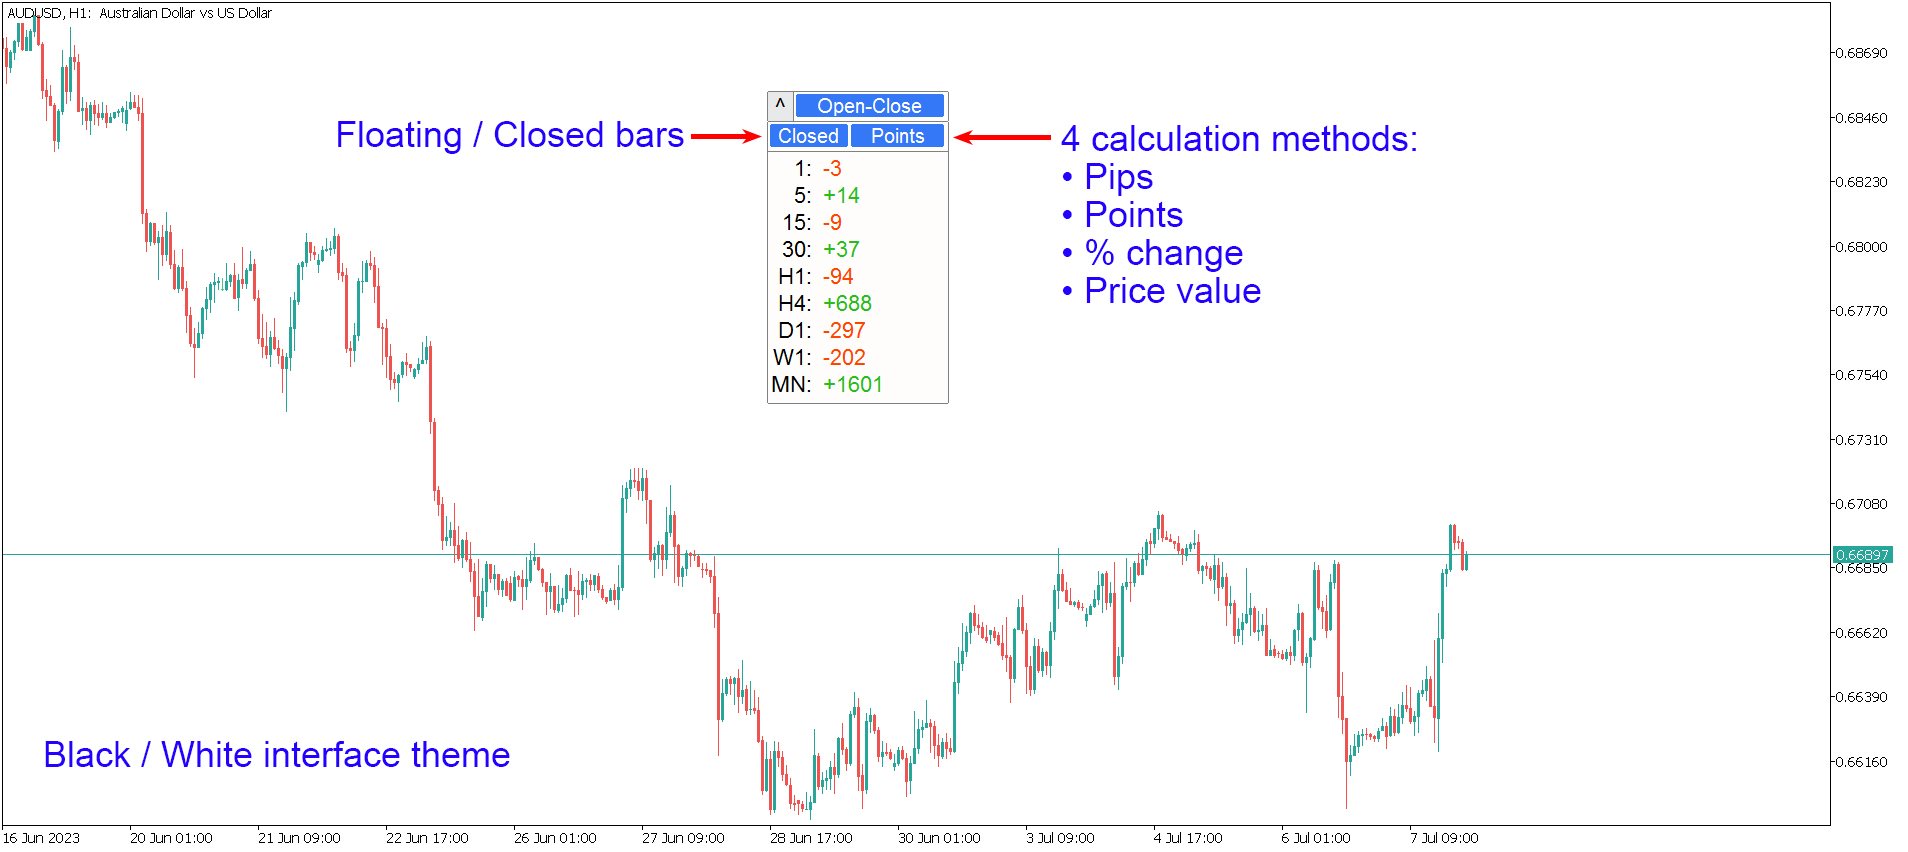
You can select the shift of the calculated basr:
- Floating (current) bars;
- The last closed (previous) bars;
The type of price value can be selected using the blue switch on the top row:
- Pips;
- Market points;
- Percentage value (%);
- Price value;
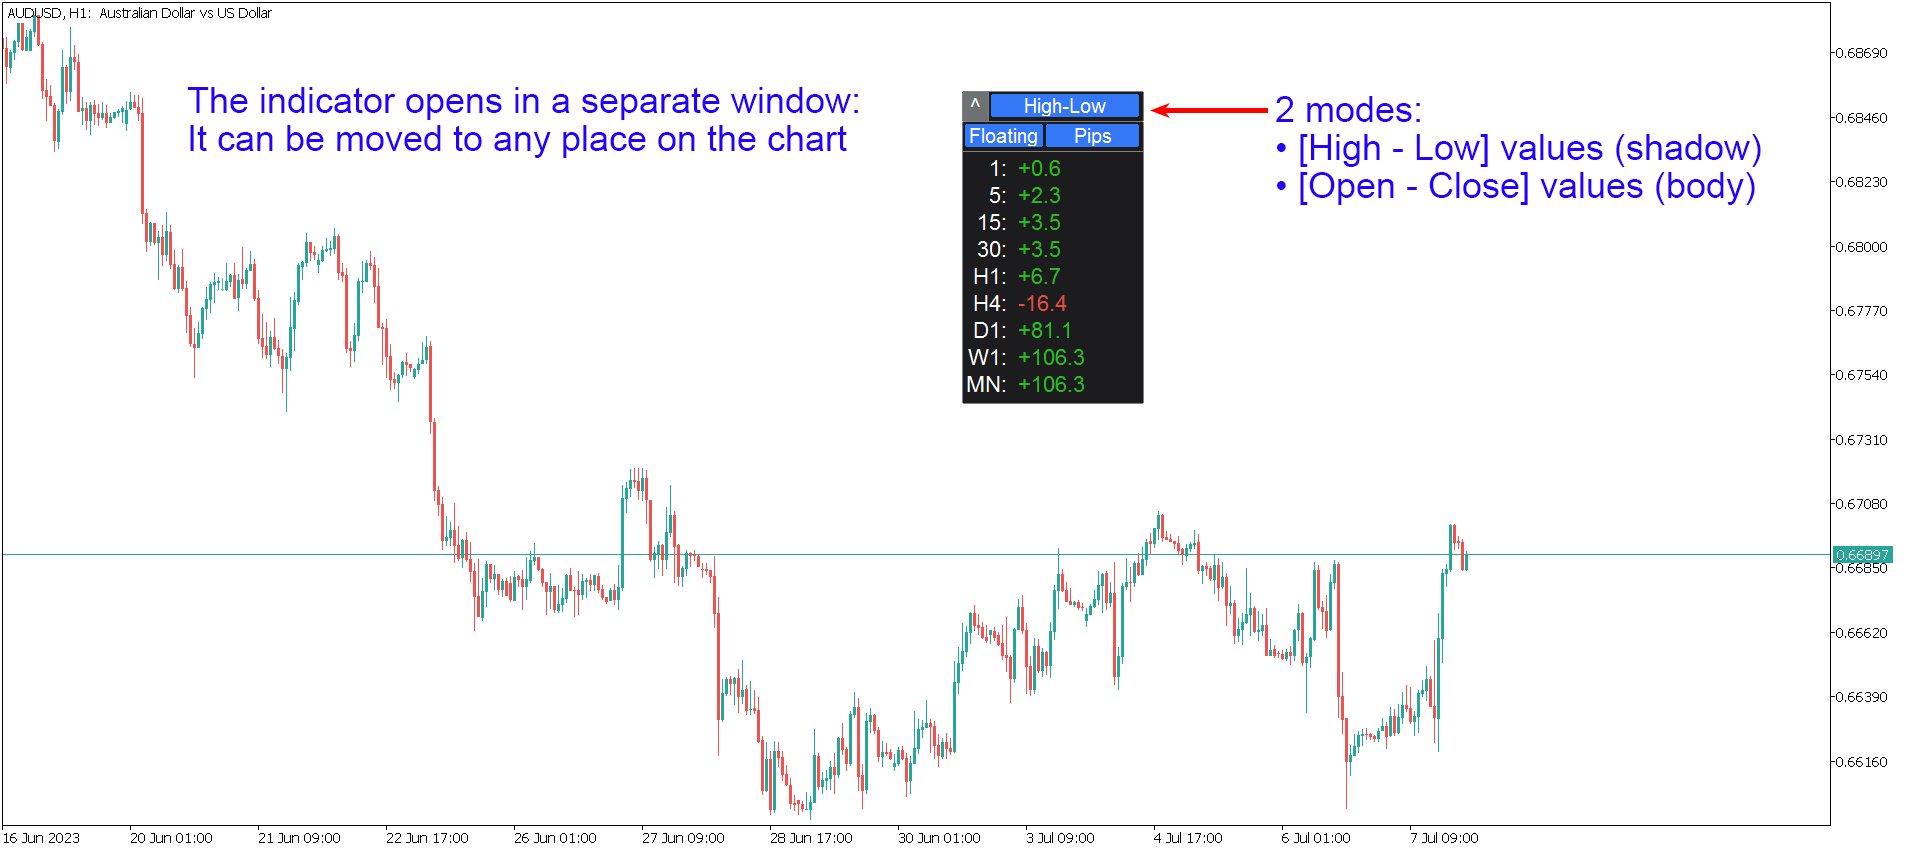
The method of calculating the bar size can be selected using the blue button:
- Body: (Open - Close) prices;
- Shadow: (High - Low) prices;
The utility is displayed in a separate window on the chart:
- The window can be moved to any place on the chart: drag anywhere;
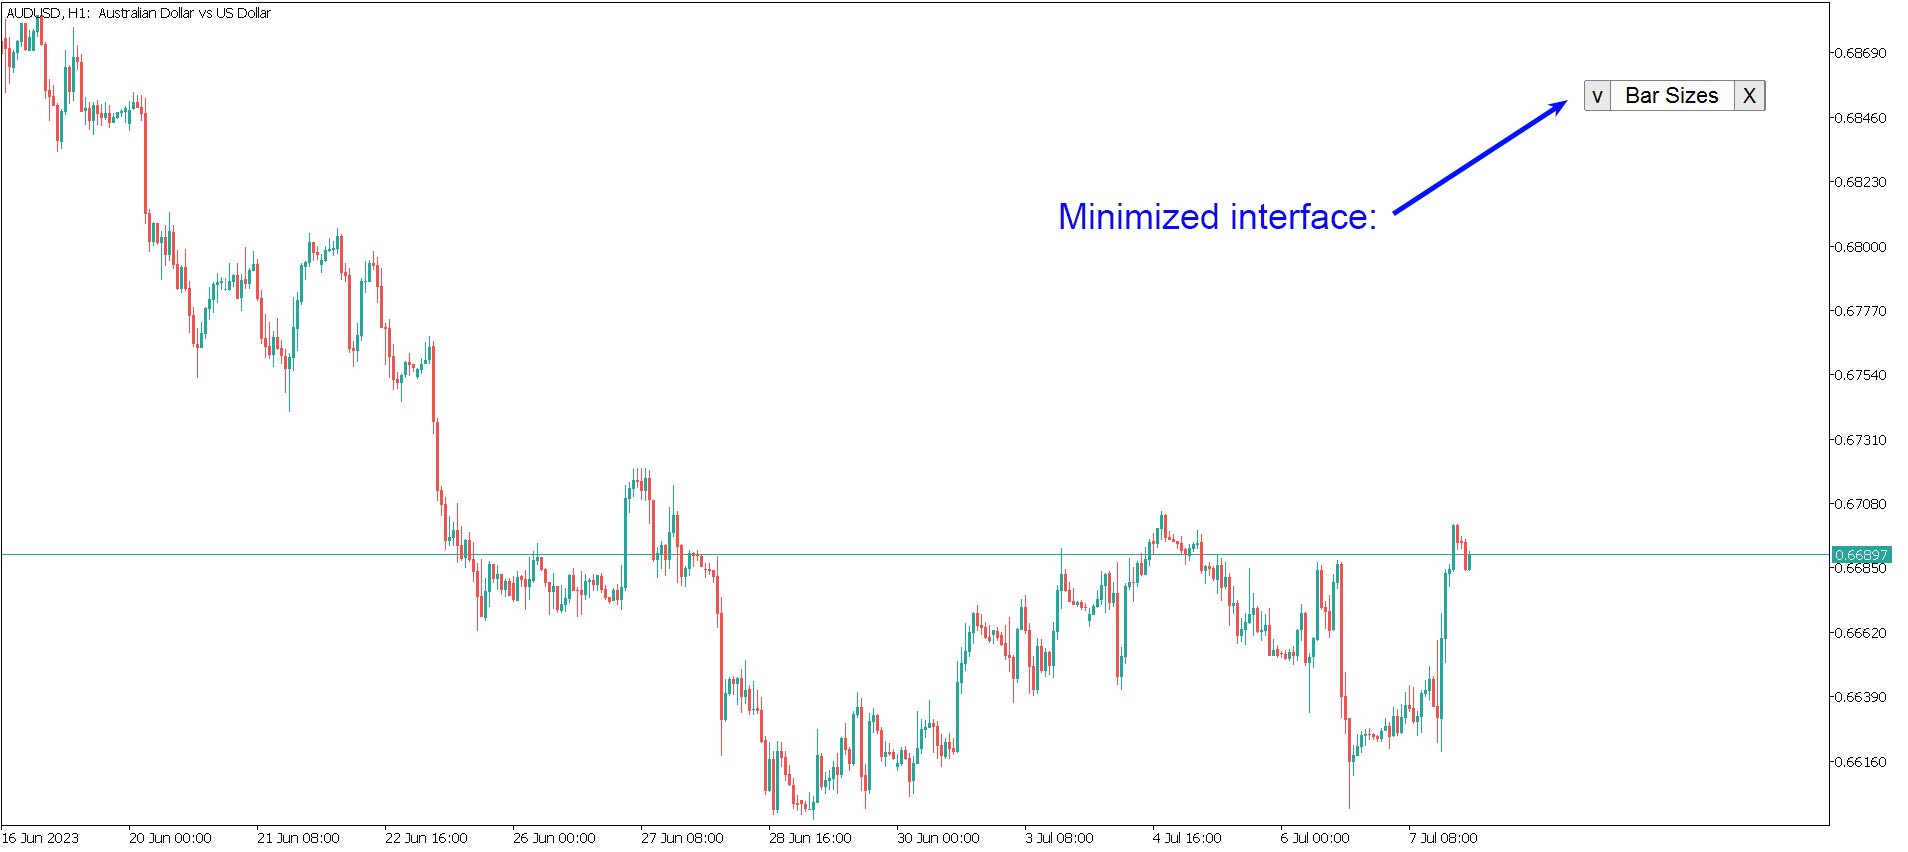
- The interface can be minimized using the "^" button;
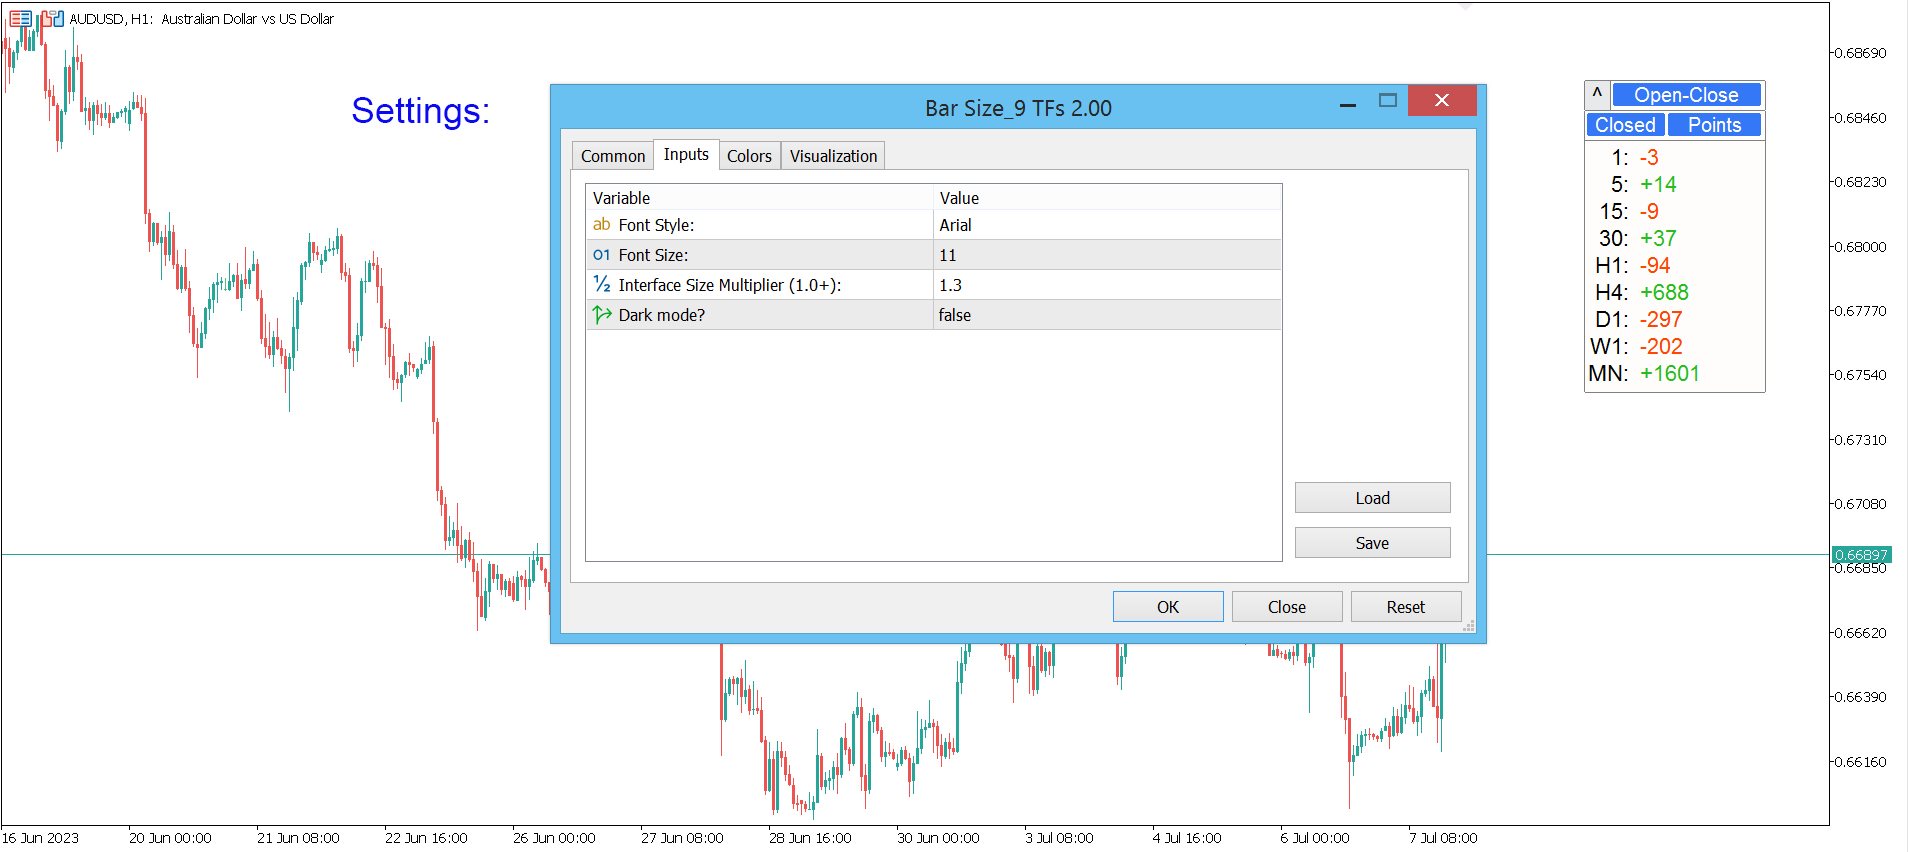
In the settings of the indicator, you can configure:
- Dark / Light interface theme;
- Interface Size Multiplier;
- Font size and style;
The program file must be placed in the "Indicators" directory.