Binary Platinum Signal

A good and reliable tool if you follow the rules of money management.

does not redraw Developed according to its own strategy on a unique algorithm.

The indicator is completely sharpened for binary options very easy to use Just add it to the chart and you can start trading Perfect for both beginners and experienced traders.

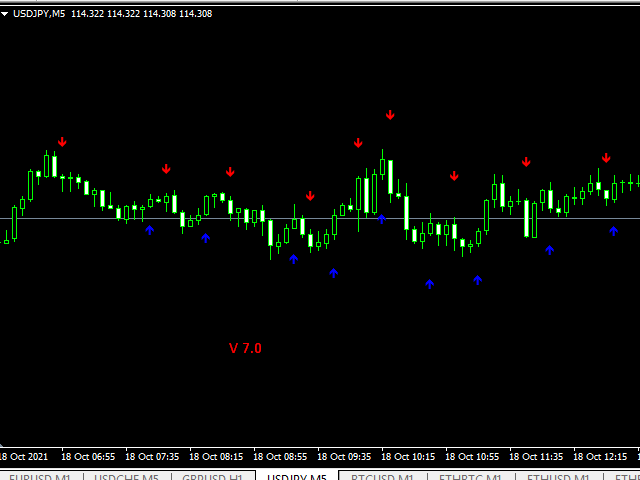
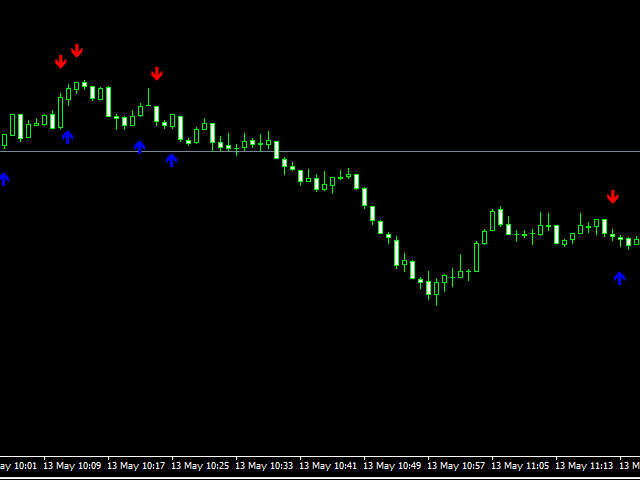
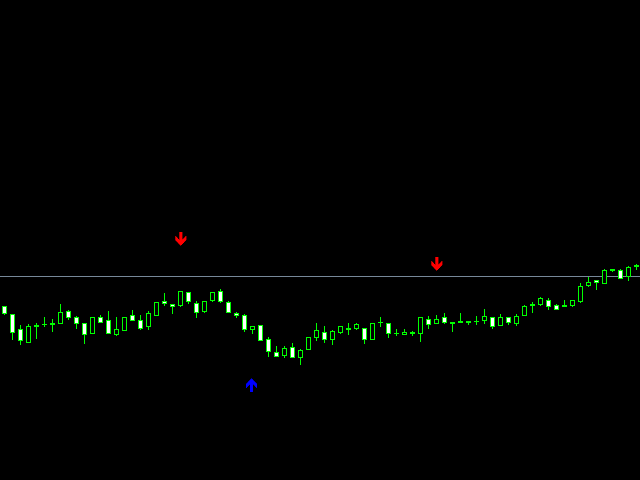
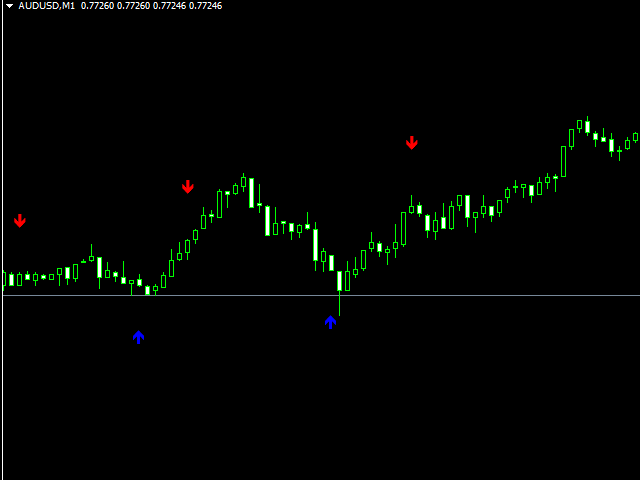
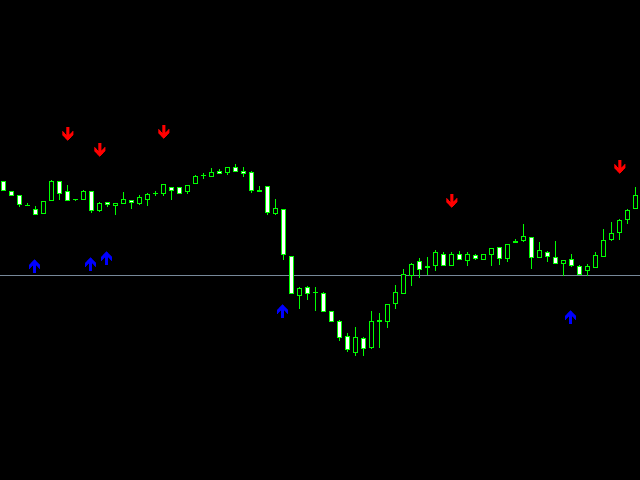
The signals are simple and straightforward. Up arrow buy. Down arrow for sale. Recommended time of expiration is from 1-2 candles. For one transaction, no more than 3% of the deposit.


depending on the trading time of the currency pair and market volatility

With this tool, you can be sure of what you are doing.

Önerilen ürünler
The indicator allows you to trade binary options. The recommended time frame is М1 and the expiration time is 1,2,3 minutes. The indicator suitable for auto and manual trading. A possible signal is specified as a arrows above/under a candle. You should wait until the candle closes! Arrows are not re-painted Trade sessions: TOKYO section (Half-end) Currency pairs: USD/JPY Working time frame: M1 Expiration time: 1,2,3 minutes. The indicator also shows good results when using the martingale strateg
FREE
Gösterge, tarihsel olanlarla karşılaştırılabilecek güncel teklifler oluşturur ve bu temelde bir fiyat hareketi tahmini yapar. Gösterge, istenen tarihe hızlı navigasyon için bir metin alanına sahiptir. Seçenekler: Sembol - göstergenin göstereceği sembolün seçimi; SymbolPeriod - göstergenin veri alacağı dönemin seçimi; GöstergeRenk - gösterge rengi; Ters - doğru tırnakları tersine çevirir, yanlış - orijinal görünüm; Sonraki, tarihi girebileceğiniz ve 'enter' tuşuna basarak hemen atlayab
Market Profile 3
Hussien Abdeltwab Hussien Ryad
3 (2)
Market Profile 3 MetaTrader 4 indicator  — is a classic Market Profile implementation that can show the price density over time, outlining the most important price levels, value area, and control value of a given trading session. This indicator can be attached to timeframes between M1 and D1 and will show the Market Profile for daily, weekly, monthly, or even intraday sessions. Lower timeframes offer higher precision. Higher timeframes are recommended for better visibility. It is also possible t
FREE
SMC Venom Model BPR göstergesi, Akıllı Para (SMC) konseptinde çalışan yatırımcılar için profesyonel bir araçtır. Fiyat grafiğinde iki temel modeli otomatik olarak belirler: FVG   (Adil Değer Açığı), ilk ve üçüncü mum arasında boşluk bulunan üç mumun birleşimidir. Hacim desteğinin olmadığı seviyeler arasında bir bölge oluşturur ve bu da sıklıkla fiyat düzeltmesine yol açar. BPR   (Dengeli Fiyat Aralığı), bir "köprü" oluşturan iki FVG modelinin birleşimidir - bir kırılma bölgesi ve fiyatın düşük
Ugenesys AI MT4
Odaine Ramon Mcmillan
5 (1)
uGenesys AI - 90% Accurate Daytrading Indicator Introducing the ultimate forex trading indicator system, uGenesys AI, powered by cutting-edge AI technology and advanced analytical techniques, including Time-Series Analysis and Genetic Algorithms. Our AI-powered trading system leverages the power of time-series analysis to identify trends and patterns in historical price data, allowing traders to make informed predictions about future market movements. By analyzing vast amounts of data, our syst
VR Cub
Vladimir Pastushak
VR Cub , yüksek kaliteli giriş noktaları elde etmenin bir göstergesidir. Gösterge, matematiksel hesaplamaları kolaylaştırmak ve bir pozisyona giriş noktalarının aranmasını basitleştirmek için geliştirildi. Göstergenin yazıldığı ticaret stratejisi uzun yıllardan beri etkinliğini kanıtlamaktadır. Ticaret stratejisinin basitliği, acemi yatırımcıların bile başarılı bir şekilde ticaret yapmasına olanak tanıyan büyük avantajıdır. VR Cub, pozisyon açılış noktalarını ve Kâr Al ve Zararı Durdur hedef sev
Indicator Description GOLD TITAN KING SIGNAL INDICATOR High-Precision Gold Scalping Buy/Sell Signals – Manual Trading Assistant Overview The Gold Titan King Signal Indicator is a manual trading assistant tool designed for high-frequency scalping on Gold (XAUUSD) and other major pairs. It generates clear BUY/SELL signals with precise entry levels, along with adjustable Stop Loss and Take Profit levels displayed directly on the chart. ️ This tool is NOT an EA. It does not execute trades
Blahtech Market Profile
Blahtech Limited
4.53 (15)
Was: $249  Now: $99   Market Profile defines a number of day types that can help the trader to determine market behaviour. A key feature is the Value Area, representing the range of price action where 70% of trading took place. Understanding the Value Area can give traders valuable insight into market direction and establish the higher odds trade. It is an excellent addition to any system you may be using. Blahtech Limited presents their Market Profile indicator for the MetaTrader community. Ins
The new update makes this indicator a complete tool for studying, analyzing and operating probabilistic patterns. It includes: On-chart Multi-asset percentage monitor. Configurable martingales. Twenty-one pre-configured patterns , including Mhi patterns and C3. An advanced pattern editor to store up to 5 custom patterns. Backtest mode to test results with loss reports. Trend filter. Hit operational filter. Martingale Cycles option. Various types of strategies and alerts. Confluence between patte
Volume Compair
Thiago Pereira Pinho
Professional Cumulative Delta & Volume Median Indicator Track   real buying/selling pressure   with this powerful volume analysis tool. The   Volume Compare Indicator   combines   Cumulative Delta   and   Volume Medians   to help you identify institutional activity, imbalances, and potential reversals. Key Features: Cumulative Delta Histogram   – Visualizes net buying vs. selling volume in real-time. Buy/Sell Volume Medians   – Horizontal lines showing average buy & sell volume levels. Smart Vo
Forex Gump
Andrey Kozak
2.4 (5)
Forex Gump is a fully finished semi-automatic trading system. In the form of arrows, signals are displayed on the screen for opening and closing deals. All you need is to follow the instructions of the indicator. When the indicator shows a blue arrow, you need to open a buy order. When the indicator shows a red arrow, you need to open a sell order. Close orders when the indicator draws a yellow cross. In order to get the most effective result, we recommend using the timeframes H1, H4, D1. There
"Auto FIBO Pro" Crypto_Forex göstergesi - ticarette harika bir yardımcı araçtır! - Gösterge, Fibo seviyelerini ve yerel trend çizgilerini (kırmızı renk) otomatik olarak hesaplar ve grafikte yerleştirir. - Fibonacci seviyeleri, fiyatın tersine dönebileceği önemli alanları gösterir. - En önemli seviyeler %23,6, %38,2, %50 ve %61,8'dir. - Ters scalping veya bölge ızgara ticareti için kullanabilirsiniz. - Auto FIBO Pro göstergesini kullanarak mevcut sisteminizi geliştirmek için birçok fırsat vardı
Trend Ray
Andriy Sydoruk
The indicator shows the potential trend direction by cyclical-wave dependence. Thus, all the rays of the intersection will be optimal rays, in the direction of which the price is expected to move, taking into account the indicator period. Rays can be used as a direction for potential market movement. But we must not forget that the approach must be comprehensive, the indicator signals require additional information to enter the market.
Night ghost
Dmitriy Kashevich
Night Ghost - İkili opsiyonlar için ok göstergesi. Bu, gelecekte sizin için güvenilir bir yardımcıdır! - Grafikte yeniden çizim yok -Tüm döviz çiftlerinde harika çalışıyor! -%90'a varan gösterge doğruluğu (Özellikle geceleri) -Uzun süre kurulum yapmaya gerek yok (İkili Opsiyonlar için mükemmel kurulum) - Geç olmayan sinyaller - Mevcut mum üzerinde bir sinyalin görünümü -M1 dönemi için mükemmel (Artık Yok!) - Göz dostu mum rengi (Kırmızı ve Mavi) -Yüklü Uyarı Onunla çalışmak: - Mavi
TWO PAIRS SQUARE HEDGE METER INDICATOR Try this brilliant 2 pairs square indicator It draws a square wave of the relation between your two inputs symbols when square wave indicates -1 then it is very great opportunity to SELL pair1 and BUY Pair2 when square wave indicates +1 then it is very great opportunity to BUY pair1 and SELL Pair2 the inputs are : 2 pairs of symbols         then index value : i use 20 for M30 charts ( you can try other values : 40/50 for M15 , : 30 for M30 , : 10 for H1 ,
VR Grid
Vladimir Pastushak
5 (3)
VR Izgara göstergesi, kullanıcı tanımlı ayarlarla grafiksel bir ızgara oluşturmak için tasarlanmıştır . Standart ızgaradan farklı olarak, VR Izgarası dairesel seviyeler oluşturmak için kullanılır. Kullanıcının seçimine bağlı olarak tur seviyeleri arasındaki adım isteğe bağlı olabilir. Ek olarak, diğer göstergeler ve yardımcı programlardan farklı olarak VR Grid, zaman dilimi değiştiğinde veya terminal yeniden başlatıldığında bile ızgaranın konumunu korur . Ayarlar, set dosyaları, demo versiyonlar
FREE
Supply and Demand Indicator + FREE Currency Strength Meter ADD-ON Looking for a powerful tool that can help you identify the most reactive zones in the forex market? Our supply and demand indicator for MetaTrader 4 and 5 is exactly what you need. With its advanced algorithms and real-time analysis, this indicator helps traders of all experience levels make informed trading decisions. The supply and demand indicator is a cutting-edge tool that helps traders identify areas where buyers and seller
Dr Trend
Vitalii Zakharuk
Dr Trend is a trend indicator for the MetaTrader 4 trading platform. This indicator allows you to find the most likely trend reversal points. You won’t find a proprietary indicator like this anywhere else. A simple but effective system for determining the Forex trend. From the screenshots you can see for yourself the accuracy of this tool. Works on all currency pairs, stocks, commodities, cryptocurrencies. Are you already tired of constant ups and downs? You shouldn’t fall victim to unstable m
Bu, bir mumun kapanış fiyatını tahmin eden bir göstergedir. Gösterge öncelikle D1 çizelgelerinde kullanılmak üzere tasarlanmıştır. Bu gösterge hem geleneksel forex ticareti hem de ikili opsiyon ticareti için uygundur. Gösterge, bağımsız bir ticaret sistemi olarak kullanılabilir veya mevcut ticaret sisteminize ek olarak hareket edebilir. Bu gösterge, mevcut mumu analiz ederek mumun gövdesi içindeki belirli güç faktörlerini ve önceki mumun parametrelerini hesaplar. Böylece gösterge, piyasa hareket
TMA AI Bands
Monique Ellen Miranda Dos Santos
TMA AI Bands göstergesi, dinamik üst ve alt bantlar ile grafiğe doğrudan çizilen net alım/satım okları içeren Üçgensel Hareketli Ortalama (TMA) temellidir. Adaptif optimizasyon için entegre AI özelliği sunar ve yeniden boyama yapmaz, fiyat bantlara dokunduğunda hassas tersine dönüş sinyalleri sağlar. * Pariteler: Tüm döviz pariteleriyle çalışır * Önerilen zaman dilimleri: D1 / W1 / MN * Yapılandırılabilir harici değişkenler:   * TimeFrame – hesaplama periyodu   * HalfLength – ortalamanın y
We present you the indicator "Candle closing counter", which will become your indispensable assistant in the world of trading. That’s why knowing when the candle will close can help: If you like to trade using candle patterns, you will know when the candle will be closed. This indicator will allow you to check if a known pattern has formed and if there is a possibility of trading. The indicator will help you to prepare for market opening and market closure. You can set a timer to create a pre
The main idea of this indicator is rates analysis and prediction by Fourier transform. Indicator decomposes exchange rates into main harmonics and calculates their product in future. You may use the indicator as a standalone product, but for better prediction accuracy there is another related indicator - FreqoMaster - which uses FreqoMeterForecast as a backend engine and combines several instances of FreqoMeterForecast for different frequency bands. Parameters: iPeriod - number of bars in the ma
Profesyonel trader’lar ve değerlendirme hesapları (Prop) için Risk Yönetimi ve Limit İzleme Göstergesi Bu araç, risk yönetimi ve limitlere ilişkin bilgileri grafikte yalnızca görüntüler ve karar verme sürecinde odaklanmanıza yardımcı olur. Gösterge hiçbir işlemi açmaz/kapatmaz/değiştirmez ve Uzman Danışmanlar (EA) ile çakışmaz. Özellikler Günlük ve toplam drawdown izleme Günlük ve toplam drawdown’ı Bakiye (Balance) veya Özsermaye (Equity) bazında hesaplar ve gösterir (ayar yapılabilir). Tanımla
Super Reversal Pattern
Parfait Mujinga Ndalika
Super Reversal Pattern Indicator Unlock the power of advanced pattern recognition with our Super Reversal Pattern Indicator. Designed for traders seeking precision and reliability, this indicator identifies one of the most effective reversal patterns in technical analysis, offering a significant edge in your trading strategy. Key Features: Non-Repainting Accuracy: Enjoy the confidence of non-repainting technology. Once a Super Reversal Pattern is detected, it remains static, providing consiste
BoxChart MT4
Evgeny Shevtsov
4.4 (5)
The market is unfair if only because 10% of participants manage 90% of funds. An ordinary trader has slim changes to stand against these "vultures". This problem can be solved. You just need to be among these 10%, learn to predict their intentions and move with them. Volume is the only preemptive factor that faultlessly works on any timeframe and symbol. First, the volume appears and is accumulated, and only then the price moves. The price moves from one volume to another. Areas of volume accumu
This is a new strategy for SUPPLY DEMAND areas It is based on a calculation using the tick volume to detect the big price action in market for both bear /bull actions this smart volume action candles are used to determine the supply and demand areas prices in between main supply and demand lines indicate sideway market  up arrows will be shown when prices moves above the main supply and the secondary supply lines Down arrows will be shown when prices moves below the main demand and the secondary
Noize Absorption Index MT4
Ekaterina Saltykova
5 (1)
Noize Absorption Index - is the manual trading system that measures the difference of pressure between bears forces and bulls forces. Green line - is a noize free index that showing curent situation. Zero value of index shows totally choppy/flat market.Values above zero level shows how powerfull bullish wave is and values below zero measures bearish forces.Up arrow appears on bearish market when it's ready to reverse, dn arrow appears on weak bullish market, as a result of reverse expectation. S
QuantumEdge Trader
Hossam Ali Ahmed Ali
QuantumEdge Trader v1.0 AI-Powered Precision Signals for Serious Traders QuantumEdge Trader is a smart and reliable indicator that delivers accurate BUY and SELL signals using advanced market analysis and trend detection. Designed for M1 to M60 timeframes, it's ideal for scalping and intraday strategies. --- Key Features: No Repaint – Signals never change after appearing Smart trend filters to reduce noise Adjustable sensitivity and alerts Perfect for XAUUSD, EURUSD, and m
Introduction It is common practice for professional trades to hide their stop loss / take profit from their brokers. Either from keeping their strategy to the themselves or from the fear that their broker works against them. Using this indicator, the stop loss / take profit points will be drawn on the product chart using the bid price. So, you can see exactly when the price is hit and close it manually.  Usage Once attached to the chart, the indicator scans the open orders to attach lines for t
For sure, this indicator has become very popular amongst traders. Through coding this indicator will give you the most accurate levels possible for your trading analysis. We have also added in the ability for you to receive alerts when the price breaks above or below a Support or Resistance lines! HOW TO USE The red rectangles represent your resistance/supply zone. The green rectangles represent your support/demand zone.  BONUS FEATURES We coded this indicator with the ability to switch between
Bu ürünün alıcıları ayrıca şunları da satın alıyor
Pulse Scalping Line - an indicator for identifying potential pivot points. Based on this indicator, you can build an effective Martingale system. According to our statistics, the indicator gives a maximum of 4 erroneous pivot points in a series. On average, these are 2 pivot points. That is, the indicator shows a reversal, it is erroneous. This means that the second signal of the indicator will be highly accurate. Based on this information, you can build a trading system based on the Martingale
Miraculous Göstergesi – Gann Dokuz Kareye Dayalı %100 Tekrarlamayan Forex ve İkili Araç Bu video, Forex ve İkili Opsiyon traderları için özel olarak geliştirilmiş son derece doğru ve güçlü bir ticaret aracı olan Miraculous Göstergesi 'ni tanıtıyor. Bu göstergeyi benzersiz kılan, efsanevi Gann Dokuz Karesi ve Gann Titreşim Yasası 'na dayanmasıdır; bu da onu modern ticarette mevcut en hassas tahmin araçlarından biri yapmaktadır. Miraculous Göstergesi tamamen tekrarlamaz ; yani mum kapandıktan son
F-16 Uçak Göstergesini tanıtıyoruz, ticaret deneyiminizi devrimleştirmek için tasarlanmış son teknoloji bir MT4 aracı. F-16 savaş uçağının eşsiz hızı ve hassasiyetinden ilham alan bu gösterge, finansal piyasalarda eşi benzeri olmayan performans sunmak için ileri algoritmalar ve son teknoloji teknolojileri bir araya getirir. F-16 Uçak Göstergesi ile gerçek zamanlı analiz sunarak yüksek doğruluklu ticaret sinyalleri üretirken rekabetin üzerine çıkacaksınız. Dinamik özellikleri, farklı varlık sınıf
Meravith
Ivan Stefanov
5 (1)
Gösterge, her noktadan hacmi analiz eder ve bu hacim için piyasa tükenme seviyelerini hesaplar. Üç çizgiden oluşur: Boğa hacmi tükenme çizgisi Ayı hacmi tükenme çizgisi Piyasa trendini gösteren bir çizgi. Bu çizgi, piyasanın boğa mı yoksa ayı mı olduğunu yansıtacak şekilde rengini değiştirir. Piyasayı istediğiniz herhangi bir başlangıç noktasından analiz edebilirsiniz. Bir hacim tükenme çizgisine ulaşıldığında, bir sonraki analize başlamak için yeni bir nokta belirleyin. Herhangi bir şeyi analiz
" Dynamic Scalper System " göstergesi, trend dalgaları içinde işlem yapmak için scalping yöntemi için tasarlanmıştır. Başlıca döviz çiftleri ve altın üzerinde test edilmiştir, diğer işlem araçlarıyla uyumluluğu mümkündür. Ek fiyat hareketi desteğiyle trend boyunca pozisyonların kısa vadeli açılması için sinyaller sağlar. Göstergenin prensibi. Büyük oklar trend yönünü belirler. Küçük oklar şeklinde scalping için sinyaller üreten bir algoritma trend dalgaları içinde çalışır. Kırmızı oklar yüksel
Gold Channel is a volatility-based indicator, developed with a specific timing algorithm for the XAUUSD pair, which consists of finding possible corrections in the market. This indicator shows two outer lines, an inner line (retracement line) and an arrow sign, where the theory of the channel is to help identify overbought and oversold conditions in the market. The market price will generally fall between the boundaries of the channel. If prices touch or move outside the channel it is a tradi
OrderFlow Absorption – MT4 için Profesyonel Delta ve Absorpsiyon Sinyal Göstergesi OrderFlow Absorption ile gerçek emir akışı analizinin gücünü keşfedin – MetaTrader 4 için nihai delta histogramı ve absorpsiyon sinyal göstergesi. Fiyat hareketlerinin arkasında gerçekte neler olduğunu görmek isteyen traderlar için tasarlanan bu araç, piyasayı hareket ettiren gizli alım/satım baskısını ve absorpsiyon olaylarını ortaya çıkarır. Özellikler Delta Histogramı Görselleştirme:   Alım ve satım baskısını a
The Hurricane Indicator
Paul Nicholas Clevett
5 (1)
Currently switched to the 4 hour chart - but use other time frames for confirmation. :-)  I change my main time frame based on the market movement at the time. The Hurricane Forex Indicator is a multi time frame indicator that includes such things as Trade Notifications, Trade Calculator, Momentum Indicator, risk reward and much more. We have a free Trade room for our users as well. Please check out the video for full details of how this indicator works as it has over 15 years worth of developme
Everyone who purchases the Scalping signals M1 indicator receives a FREE BONUS — a fully automated Expert Advisor that trades based on the indicator’s signals. The indicator shows the arrows — the robot can execute the trades for you, following all signals and risk-management rules. Scalping signals M1 – a ready-made trend-following entry system for M1 Scalping signals M1 is an indicator that turns your chart into a clear action map: a colored trend channel shows the direction of the market, and
BinaryIndicator is a highly accurate indicator for trading binary options. It shows excellent results in scalping. This indicator is based in multifactor analysis of trend indicators, as well as confirmation oscillators, which in the end gives an increased accuracy of signals. Advantages of the indicator Increased accuracy of signals. Excellent results when trading binary options with a short expiration time from M30 to M1 . It works on any timeframes. Works with any trade symbols. Parameters
Shows price reversal points with arrows. Works on all timeframes and all currency pairs. Suitable for both scalping and long-term trading. When the blue arrow appears, you need to open a buy order. When the red arrow appears, you need to open a sell order. Recommended timeframes M5, M15, H1, H4. The indicator shows the best results on GBPUSD, XAUUSD, EURUSD, USDJPY, AUDUSD, USDCHF, EURGBP, EURJPY, EURCHF and other major pairs. This indicator is well suited for intraday scalping because it show
Scalpetronix Indicator — the signal core of the Scalpetronix robot. This indicator implements the algorithms and signals on which the Scalpetronix Expert Advisor operates. All entries of the robot are generated based on these calculations: a combination of exponential moving averages, trend filtering via ADX, volatility normalization through ATR, and bar structure analysis. Advantages of the indicator works on a multi-level EMA system (fast and slow) with a dynamic threshold; eliminates weak si
This indicator is a multifunctional technical analysis tool based on the combination of an adaptive exponential moving average and volatility filters calculated through the Average True Range (ATR). It is designed to accurately identify the current price direction, highlight key trend reversal areas, and visualize potential turning zones. The algorithm is built upon the dynamic construction of a trend ribbon using two levels of volatility — outer and inner ranges. The outer boundaries serve as i
Rtc ML Ai | Predictor CORE MACHINE LEARNING ENGINE Adaptive ML Market Predictor – Multi-Bar Trend & Candle Forecast What This Indicator Does This indicator is a  real-time market prediction engine  designed to analyze price behavior and estimate  future market tendencies . Unlike conventional indicators, this system  does not rely on static parameters or historical curve-fitting , but adapts its internal state dynamically during live market operation. Instead of using static rules, the indic
FFx Engulfing Setup Alerter gives trade suggestions with Entry, Target 1, Target 2 and StopLoss. Below are the different options available: Entry suggestion - pips to be added over the break for the entry 3 different options to calculate the SL - by pips, by ATR multiplier or at the pattern High/Low 3 different options to calculate the 2 TPs - by pips, by ATR multiplier or at Risk/Reward Offset the dashboard - any place on the chart Remove the suggestion once the price reached the SL line Lines
FFx InsideBar Setup Alerter gives trade suggestions with Entry, Target 1, Target 2 and StopLoss. Below are the different options available: Entry suggestion - pips to be added over the break for the entry Minimum candle size - to avoid too close buy/sell entry suggestions 3 different options to calculate the SL - by pips, by ATR multiplier or at the pattern High/Low 3 different options to calculate the 2 TPs - by pips, by ATR multiplier or at Risk/Reward Offset the dashboard - any place on the c
FFx OutsideBar Setup Alerter gives trade suggestions with Entry, Target 1, Target 2 and StopLoss. Below are the different options available: Entry suggestion - pips to be added over the break for the entry. 3 different options to calculate the SL - by pips, by ATR multiplier or at the pattern High/Low. 3 different options to calculate the 2 TPs - by pips, by ATR multiplier or at Risk/Reward. Offset the dashboard - any place on the chart. Remove the suggestion once the price reached the SL line.
FFx PinBar Setup Alerter gives trade suggestions with Entry, Target 1, Target 2 and StopLoss. Below are the different options available: Entry suggestion - pips to be added over the break for the entry Minimum candle size - to avoid too small candles 3 different options to calculate the SL - by pips, by ATR multiplier or at the pattern High/Low 3 different options to calculate the 2 TPs - by pips, by ATR multiplier or at Risk/Reward Offset the dashboard - any place on the chart Remove the sugges
Automatic, live & interactive picture of all trendlines. Assign push, email and sound alerts to the lines of your choice and be informed about price rollback, breakout, rollback after breakout, number of rollbacks, line expiration by double breakout. Correct, drag or delete the lines and interactively tune the line system. https://youtu.be/EJUo9pYiHFA . Chart examples https: //www.mql5.com/en/users/efficientforex Price Interaction Events All events are effective immediately and only after one
The purpose of this new version of the MT4 standard indicator provided in your platform is to display in a sub-window multiple timeframes of the same indicator with its divergences. See the example shown in the picture below. But the display isn't like a simple MTF indicator. This is the real display of the indicator on its timeframe. Here's the options available in the FFx divergences indicator: Select the timeframes to be displayed (M1 to Monthly) Define the width (number of bars) for each tim
The purpose of this new version of the MT4 standard indicator provided in your platform is to display in a sub-window multiple timeframes of the same indicator with its divergences. See the example shown in the picture below. But the display isn't like a simple MTF indicator. This is the real display of the indicator on its timeframe. Here's the options available in the FFx divergences indicator: Select the timeframes to be displayed (M1 to Monthly). Define the width (number of bars) for each ti
The FFx Dashboard MTF alerter will show you on a single chart all the timeframes (M1 to Monthly) with their own status for the indicator. 2 Alert Options: Single timeframe: each selected timeframe alert separately when a signal occurs Multi timeframes: all selected timeframes must agree for an alert to be triggered Both options have an input to select the timeframes to be used for the alert(s). How to Understand the Status: Green/Red square: histogram above/below 0 line Green square + Red bord
The FFx Dashboard MTF alerter will show you on a single chart all the timeframes (M1 to Monthly) with their own status for the indicator. 2 Alert Options: Single timeframe: each selected timeframe alert separately when a signal occurs Multi timeframes: all selected timeframes must agree for an alert to be triggered Both options have an input to select the timeframes to be used for the alert(s). How to understand the status: Green/Red square: RSI above/below 50 line Green square + Red border: R
The FFx Dashboard MTF alerter will show you on a single chart all the timeframes (M1 to Monthly) with their own status for the indicator. 2 Alert Options: Single timeframe: each selected timeframe alert separately when a signal occurs Multi timeframes: all selected timeframes must agree for an alert to be triggered Both options have an input to select the timeframes to be used for the alert(s). How to understand the status: Green/Red square: Stoch above/below 50 line Green square + Red border:
The FFx Dashboard MTF alerter will show you on a single chart all the timeframes (M1 to Monthly) with their own status for the indicator. 2 Alert Options: Single timeframe: each selected timeframe alert separately when a signal occurs Multi timeframes: all selected timeframes must agree for an alert to be triggered Both options have an input to select the timeframes to be used for the alert(s). How to understand the status: Green/Red square: Price above/below Cloud (Kumo) Green square + Red bo
The FFx Dashboard MTF alerter will show you on a single chart all the timeframes (M1 to Monthly) with their own status for the indicator. 2 Alert Options: Single timeframe: each selected timeframe alert separately when a signal occurs Multi timeframes: all selected timeframes must agree for an alert to be triggered Both options have an input to select the timeframes to be used for the alert(s). How to understand the status: Green/Red square: MA pointing Up/Down Green square + Red border: MA po
The FFx Dashboard MTF alerter will show you on a single chart all the timeframes (M1 to Monthly) with their own status for the indicator. 2 Alert Options: Single timeframe: each selected timeframe alert separately when a signal occurs. Multi timeframes: all selected timeframes must agree for an alert to be triggered. Both options have an input to select the timeframes to be used for the alert(s). How to understand the status: Green square: Price above PSAR Red square: Price below PSAR Options
Yazarın diğer ürünleri
Sniper MACD
Yaroslav Varankin
4.35 (17)
The "Sniper MACD" indicator is an improved version of the classic MACD, designed to enhance trading efficiency. It features additional filtering and multiple smoothing methods, allowing for more accurate signals. Features: Additional Filtering: Improves signal quality, reducing the likelihood of false triggers and increasing forecast accuracy. Multiple Smoothing: Reduces market noise, providing more reliable signals. Volume Integration: The built-in volume indicator helps assess market conditio
FREE
RVI Sniper Alert
Yaroslav Varankin
4.5 (4)
The Alert Arrows RVI indicator is an advanced version of the Relative Vigor Index (RVI), augmented with alert arrow functionality. It can identify potential support and resistance levels, providing traders with valuable insights into market dynamics. Key Features: Alert Arrows: Integrated alert arrows offer visual cues for potential trading opportunities. Additional Filters: Two extra filters are implemented to improve the indicator's readings, increasing the accuracy and reliability of signals
FREE
Revolution martingale
Yaroslav Varankin
5 (3)
Revolution Martingale is an indicator designed for trading binary options on the M5 timeframe. Features: M5 Timeframe: It is recommended to use the indicator on the M5 timeframe for optimal trading. Trade Entry: Trades should only be opened on the first candle after a signal appears. Signals: A blue diamond indicates a buying opportunity for upward movement, while a red diamond indicates a buying opportunity for downward movement. Configured for Effective Binary Options Trading: The indicator i
FREE
Mega Alert Level Indicator: A Simple Yet Valuable Tool The Mega Alert Level indicator provides sound, informational, push, and email notifications when the price of a currency pair touches or approaches standard support and resistance levels, as well as any other objects on the chart you select. Features: Notifications: Customize notifications to your preference—choose between Email, Popup, or Push. All settings are displayed in the upper right corner of the chart. Ease of Use: Simply attach th
FREE
Scalping Binary Option Pro is an arrow indicator that is completely free from repainting . Although it may work incorrectly in strategy testers, its signals remain relevant for real trading. Signals: A red arrow pointing down indicates a selling opportunity, while a green arrow pointing up indicates a buying opportunity. Settings: All you need to adjust are the colors of the signal arrows and the sound alert for signal notifications. Usage Recommendations: It is best to use the indicator on hig
Almas Wall Street is a professional arrow indicator with no repainting. Signals appear simultaneously with the formation of a candle. Trading Guidelines: Enter a trade for at least 2 candles or on the next candle after the signal for 1 candle. Screenshot 5 . A red arrow pointing down suggests considering sales, while a blue arrow suggests buying. All you need to configure are the colors of the signal arrows. It is recommended to apply this indicator in scalping on timeframes M1-M5. Signals occur
Brilliant Wall Street is a professional arrow indicator.  It is based on a mathematical calculation.  thanks to a special calculation algorithm that was developed by the best specialists  he is not late, moreover, he gives advanced signals.  -----------almost complete absence of redrawing------------.  signals appear with the advent of the candle.  It is recommended to enter a trade for at least 1-2 candles on the next candle, but you can also use a signal...  The red down arrow indicates that
This is a dial indicator for trading from the level of support resistance  --- complete lack of redrawing ---  He is able to determine the levels of support resistance  Finds the best entry points and shows them with arrows.  If a trend is forming, the indicator will always notify with a arrow signal.  buy signal blue arrow for sale red arrow  This signaling tool can also be used on a sideways market.  The main thing is that it is volatile.!!!!!!  Good percentage of correct indicator predictio
I n the tester does not work, see how it works in the video; sorry for the inconvenience. UTB is done for real-time work quotation when trading. indicator draws resistance support levels Also, when a level appears, an arrow appears where to open a deal. You will not miss any desired level approach. The indicator showed good results on all graphs and time frames. recommended settings step 1800 p.s traders selling from wall street also use resistance support levels in their analytics how do tra
Mega Level
Yaroslav Varankin
Esta es una de las modificaciones de los canales Keltner. Ayuda a identificar puntos de entrada y salida lógicos. Ayuda a determinar un posible movimiento de precios. Crea canales equidistantes que se convierten en niveles de soporte y resistencia dinámicos. Facilita enormemente el análisis del mercado visual. El indicador es un multi-tiempo multi-tiempo muestra buenos resultados.
trading indicator, which automatically recognizes equal levels of support and resistance and otorova content and resistance and poison indicator uses elder system can be applied to any financial instruments and on any timeframes. the same indicator draws to. it is perfect for scalping as its essence is to trade in the channel. The indicator has many parameters that allow it to be conveniently customized. indicator settings filter - it filters the market noise that is, we get more accurate channe
Bad Boys
Yaroslav Varankin
The Bad Boys indicator is a arrow indicator percentage (of positive trades) of correct forecasts of the indicator, even during news releases, the indicator was tested on a real account and showed a good result of correct forecasts. Settings allow you to customize the color of the arrows. volatility period indicator period the number of bars for which the market analysis will be carried out price is the method when a signal will appear when opening when closing a candle, etc. volatility allows yo
Dream Wall Street   It represents the visualization of support resistance levels. the indicator marks the levels that are formed on a candle whose tick volume exceeds the average volume; it is perfect as it is without filters for scalping by level it can also be used as an addition to an existing trading system. The indicator can be used as a filter. It is already set up to configure anything for you. Settings allow you to customize the light levels
The Divergent Accuracy indicator is designed to identify discrepancies on the price chart of a currency pair. The Divergent Accuracy indicator recognizes bullish and bearish divergences, and can also output a signal that a divergence has been detected... In addition to identifying divergences, the indicator works with overbought and oversold levels, and also shows arrows to enter the market...
Premium Volume
Yaroslav Varankin
The premium loudness indicator draws on the chart of a currency pair based on data on the price level in the back period in the input parameters of the indicator in the form of a histogram. The width of the histogram at this level means, conditionally, the number of transactions conducted on it If the broker provides real volume data, Cannot be received For example, the range H1 can be specified as H1, H4, D1, W1, MN1. For M1, it is recommended to use periodic settings for M5 values.
Premium Volume Lite The Premium Volume Lite indicator plots the distribution of deals according to price levels in the form of a histogram on a chart of a currency pair. The width of the histogram at this level means, conditionally, the number of transactions carried out on it. If the broker provides data on real volume, the indicator can show the distribution over it. Ranges can be equal only to standard timeframes not lower than the current one. о periods value is current then the indicator wi
The Invisible Sniper arrow indicator is built on the use of candlestick analysis. The indicator finds the “Absorption” reversal candlestick patterns on the price chart and, depending on the figure, bullish or bearish absorption, gives a signal to enter in the form of blue arrows to buy, red to sell. in the indicator Invisible Sniper implemented sound and text alert..
Big Scalper Pro комбинированный осциллятор, отображающий на ценовом графике  Сигналы на вход отображаются в виде стрелок соответствующего цвета, а также дублируются текстовым сообщением. есть звуковые и текстовые алерты push уведомления уведомления на email все это можно включить и выключить в настройках индикатора настройки период это период г л авного индикатора в период это период дополнительного индикатора волатильности
Dawn In Trading indicator is a new ray of light in trading! This indicator has been tested on a real chart in real trading; All statistics about this indicator from real trading on the market! From the screenshots you can see the profitability of quality and the number of signals of this tool, you can also check it in the tester! As soon as a blue arrow appears, open a deal to increase, when a red arrow appears, open a deal to fall! Signals appear when you open a new candle and do not redraw, t
It is possible to trade on any basic asset, but the experts holding testing give preference to currency pair USD/JPY, EUR/USD. Optimum time for work is considered European, the American session. with the standard settings which are already perfected to an ideal At emergence of a blue arrow under a candle the option UP is acquired. At emergence of a red arrow the option DOWN is acquired. It should be noted one feature of the indicator: the signal is formed on the current bar, but it is worth
Boss New
Yaroslav Varankin
boss ! Trading opportunities can be used in any underlying asset, but experts in conducting tests prefer the currency pair USD / JPY. The most favorable time for work is the European, American session. When the blue arrow appears, a red option under the candle is acquired UP. When the red arrow appears, the option DOWN is acquired. It is recommended to avoid trading during strong news releases
This indicator was tested on the basis of real statistics for all market indicators according to indicators for 3 months of trading. trade forecasts for usd / jpy on the m30 time frame were received on our statistics! if you have any questions, please contact us in private messages or in discussions under this indicator and we will figure it out and help any questions will arise personal messages or in discussions under this indicator As soon as the blue points appear, we open a deal to increa
The indicator is designed for opening trades for a long period. he is set up to get as many points from each trade as possible. he uses the scalping method... you can trade on any currency pairs indicator is already  you can trade at any time of the day but the preferred time of trading during the European American session. currency pairs eur / jpy, eur / usd currency pairs with high volatility then the results are much better.
Venom
Yaroslav Varankin
Venom indicator is a new type of indicator for scalping with high accuracy of correct predictions in the indicator you can select the indicator signal does not redraw, does not disappear, you can trust it 100% When a red blue arrow appears under the candlestick, an UP option is purchased. When red arrows appear, the DOWN option is purchased. the indicator is based on our new development, if there is an order with a large amount that opens in the direction we need, according to the analysis of th
the indicator showed excellent results in the scalping trade, and the same excellent results in the trading of exact instruments led to the fact that of these indicators showed themselves perfectly during the exit from the news with an  during low volatility,  This instrument has been tested for more than 1 month. What can we say about the number? It is reliable, accurate, at any time of trading. Atom Pro Maximum, this indicator showed excellent results in scalping trading. The accuracy of this
Fast rollback
Yaroslav Varankin
can recognize candlestick patterns he also recognizes the lows and highs of the price for a certain time. MTF works on all currency pairs in futures and sulfur, cryptocurrency does not redraw. his work can be seen in the test. you can trade at any time of the day but the preferred trading time during the European American session ----------------------------------------------------------------------------------------------------------------------------------------------------------
Multi-timeframe indicator perfectly determines when there will be a rollback from the level ideal for binary options. of correct true signals Forex Stop Loss trading can be dragged behind the line thereby moving the deal to breakeven there is a signal in the indicator. The indicator showed excellent results during testing. Test in the test and make sure it is accurate. For any questions, suggestions, please always communicate with you.
Zero linea
Yaroslav Varankin
multi-timeframe indicator. Ideal for both the Forex market and binary options. Good accuracy of this tool the indicator showed excellent results during testing. test it in a tester and make sure it is accurate.... complete lack of redrawing. You can choose absolutely any instrument. the indicator will provide many profitable and accurate signals. advantages of the indicator: advanced signals. high signal accuracy. frequency of occurrence of signals.
Revolution Martingale Pro indicator for binary options! at the time of opening and the appearance of the signal! Blue diamond is shopping up. A red diamond is an option down. The indicator is already set to trade in binary options. ----------- protection is set against hitting on (steps - martingale knees) protection of several minuses under the row. ------------------------------------------- (Redrawing possible)
Binarium
Yaroslav Varankin
indicator for binary options! open a deal only for 1 - candle The indicator is already set to trade in binary options. The indicator is ideal for trading on martingale since he very accurately combines what the next candle will be if you are trading in a martingale money management, this is the indicator that you were looking for; it is just created for you and your trading style p.s it is much better than relying on the color of the candle as some not very experienced traders do (therefore, the
Filtrele:
İnceleme yok
İncelemeye yanıt