• Genel bakış
  • İncelemeler
  • Yorumlar (49)
  • Yenilikler

Advanced Currency Strength28 MT5

Yeni Başlayanlar veya Uzman Tüccarlar için En İyi Çözüm!

Bu Gösterge benzersiz, yüksek kaliteli ve uygun fiyatlı bir ticaret aracıdır çünkü bir dizi tescilli özellik ve yeni bir formül ekledik. Sadece BİR grafik ile 28 Forex çifti için Döviz Gücünü okuyabilirsiniz! Yeni bir trendin veya scalping fırsatının tam tetik noktasını belirleyebildiğiniz için ticaretinizin nasıl gelişeceğini hayal edin?

Kullanım kılavuzu: buraya tıklayın

Bu ilk olan, orijinal! Değersiz bir özenti klonunu almayın.

Özel 
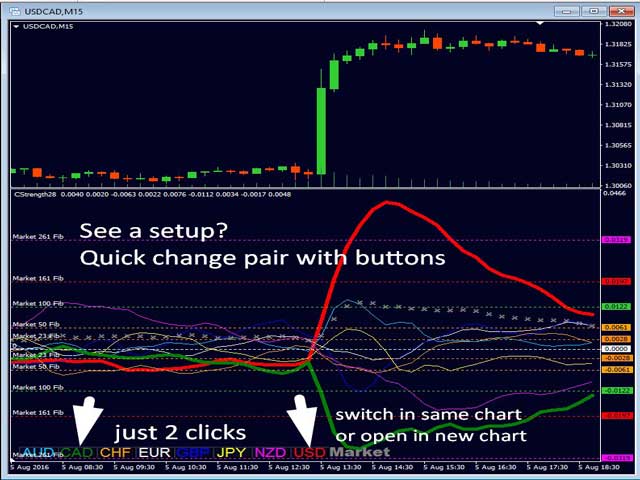
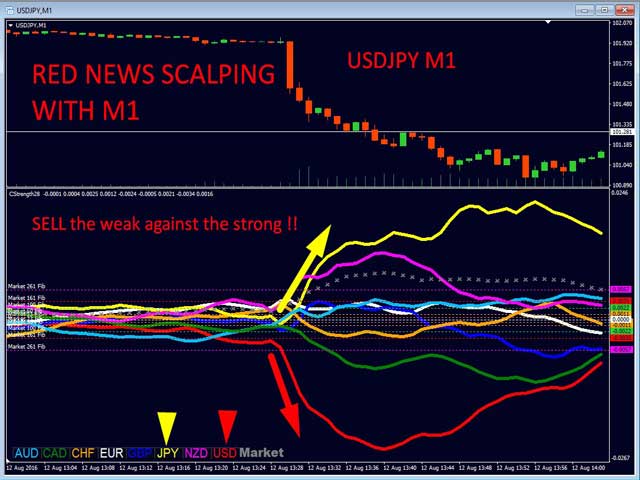
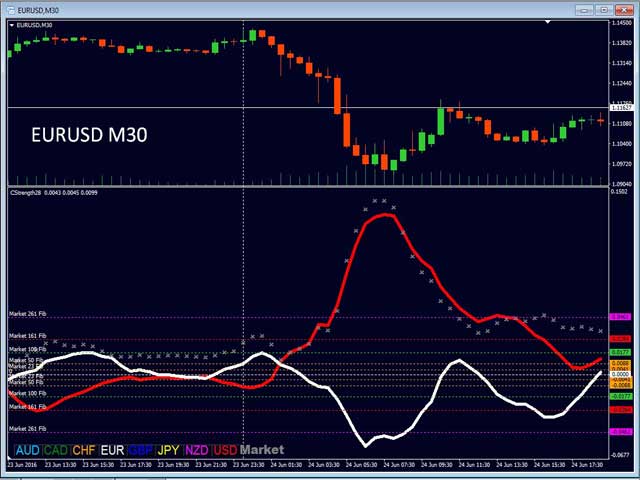
  1. Güçlü döviz momentumunu göstermek için alt penceredeki oklar GAP işlemlerinizi yönlendirecektir!
  2. Baz veya teklif para birimi aşırı satım / aşırı alım bölgesinde (dış piyasa Fibonacci seviyeleri) olduğunda bireysel grafiğin ana penceresinde uyarı işaretleri.
  3. Para birimi gücü dış aralıktan geri düştüğünde geri çekilme / tersine dönme uyarısı.
  4. Çapraz formasyon için özel uyarı

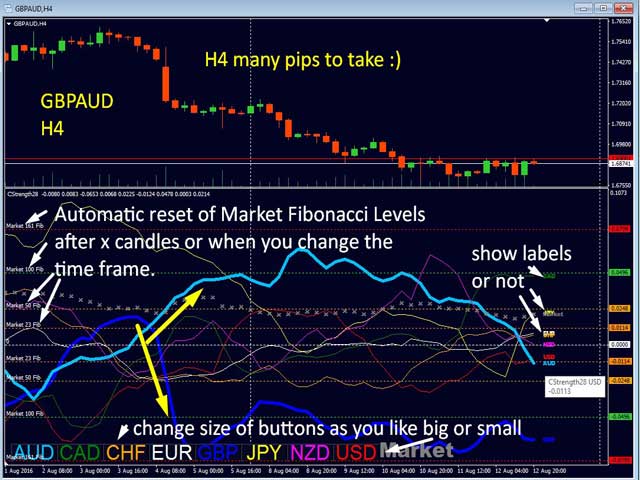
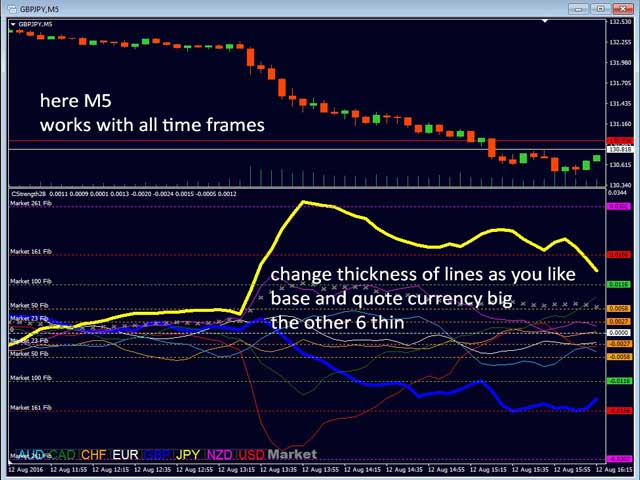
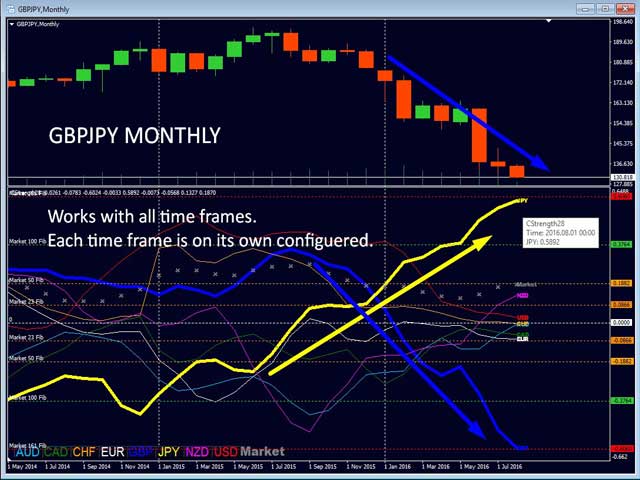
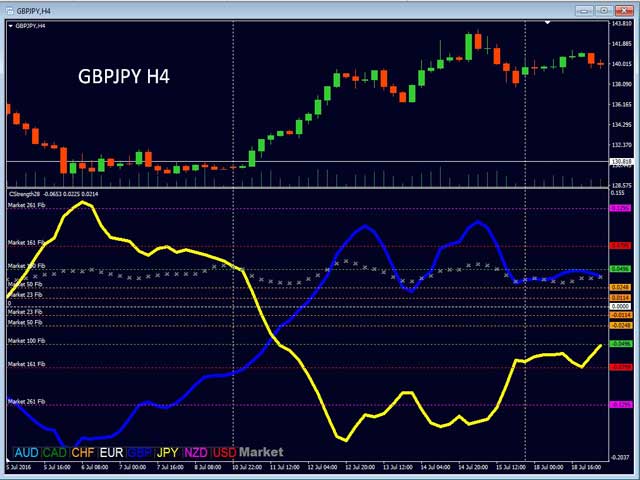
TRENDİ hızlı bir şekilde görmek için çoklu zaman çerçevesi seçeneği mevcuttur! Para birimi gücü çizgileri tüm zaman dilimlerinde çok pürüzsüzdür ve genel eğilimi belirlemek için daha yüksek bir zaman dilimi kullanırken ve ardından kesin girişleri belirlemek için daha kısa zaman dilimlerini kullanırken güzel bir şekilde çalışır. Dilediğiniz zaman dilimini seçebilirsiniz. Her zaman çerçevesi kendi başına optimize edilmiştir.

Yeni temel algoritmalar üzerine inşa edilen bu sistem, potansiyel alım satımların belirlenmesini ve onaylanmasını daha da kolaylaştırır. Bunun nedeni, bir para biriminin gücünün veya zayıflığının artıp artmadığını ve geçmişte nasıl performans gösterdiğini grafiksel olarak göstermesidir. Bu özellikler, yalnızca güçlü ve zayıf para birimlerinin hangileri olduğunu belirlemenizi kolaylaştırmak için değil, aynı zamanda size ne zaman işlem yapacağınızı, ne zaman işlem yapmayacağınızı ve ne zaman kar alacağınızı göstermek için tasarlanmıştır.

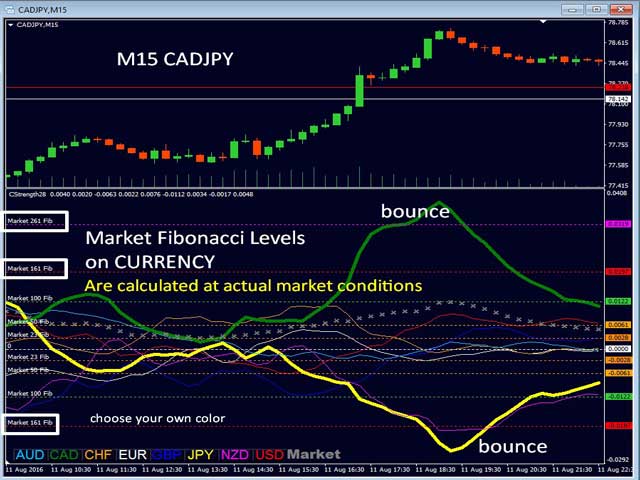
Gelişmiş Para Birimi Gücü28 Göstergesi 28 döviz çiftinin tamamında çalışır. Bu yeni bir formüldür ve çok yeni özellikleri, mevcut piyasa faaliyetlerine uyum sağlayan Piyasa Momentumu ve dinamik Piyasa Fibonacci Seviyeleridir! Piyasa Momentumu 9. çizgidir. Bu büyük bir avantajdır ve Forex ticaretinde yenidir. Piyasa momentumu ve dinamik Piyasa Fibonacci gibi tescilli özellikleri nasıl kullanacağınızı öğrendiğinizde, trendle ticaret yapmak isteyip istemediğinizi, bir trend devamı mı yoksa bir geri çekilme mi aradığınızı anlayabileceksiniz.

Tüm grafikler, tarihsel dinamik Piyasa Fibonacci seviyelerini temsil eden yeni tamponlara dayanmaktadır.


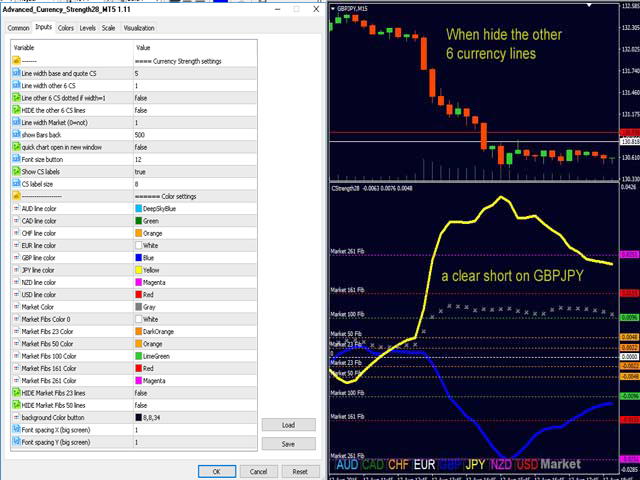
Gösterge parametreleri
Listenin tamamını görmek için buraya tıklayın.

=== Grafik ayarları

=== Uyarı ayarları

=== Uyarı ayarları CS çapraz

İpuçları 
  1. Benim şablonumu kullanın. Kılavuza bakın
  2. Göstergeyi kesmek istemiyorsanız "grafiği yeni pencerede aç" seçeneğini kullanın.
  3. Daha yüksek zaman diliminin trendi (para birimi GAP) içinde kalın.
  4. Ticaret kurulumu olarak para birimi çift GAP'ı arayın.
  5. ÖZEL: MT4 grafik geçmişini güncellemek için 7 destek grafiği açılacaktır (kılavuza bakın)! Bu işlev devre dışı bırakılabilir.
  6. Ticaret sistemi ve ticaret örnekleri için profildeki haberlerimi ve bloglarımı kontrol edin.

Herhangi bir sorunuz olursa size her zaman yardımcı olacağım.

Gelecekte size birçok yeşil pip diliyorum.

Otomatik olarak çevrildi! İngilizce Orijinal buraya tıklayın


Önerilen ürünler
Gösterge, piyasa analizi için en etkili araçlardan biri olan Fibonacci destek ve direnç seviyelerini otomatik olarak hesaplar ve çizer. Hesaplama, seçilen dönem ve zaman çerçevesi için ortalama fiyat verilerini kullanır. Bu süre için minimum ve maksimum hareketin başlangıcı ve sonu olarak alınır. Fibonacci seviyeleri, etrafında fiyat hareketinin yavaşlayabileceği veya tersine dönebileceği potansiyel referans noktalarını görmenizi sağlar, yani bunlar daha fazla hareketi tahmin etmek ve ayrıca sto
30 USD
"The trend is your friend" is one of the best known sayings in investing, because capturing large trendy price movements can be extremely profitable. However, trading with the trend is often easier said than done, because many indicators are based on price reversals not trends. These aren't very effective at identifying trendy periods, or predicting whether trends will continue. We developed the Trendiness Index to help address this problem by indicating the strength and direction of price trend
49 USD
Laguerre SuperTrend Clouds   adds an Adaptive Laguerre averaging algorithm and alerts to the widely popular SuperTrend indicator. As the name suggests,   Laguerre SuperTrend Clouds (LSC)   is a trending indicator which works best in trendy (not choppy) markets. The SuperTrend is an extremely popular indicator for intraday and daily trading, and can be used on any timeframe. Incorporating Laguerre's equation to this can facilitate more robust trend detection and smoother filters. The LSC uses the
30 USD
Premium seviye, %80'den fazla doğru tahmin doğruluğuna sahip benzersiz bir göstergedir! Bu gösterge en iyi Ticaret Uzmanları tarafından iki aydan uzun süredir test edilmiştir! Yazarın göstergesini başka hiçbir yerde bulamazsınız! Ekran görüntülerinden bu aracın doğruluğunu kendiniz görebilirsiniz! 1, sona erme süresi 1 mum olan ikili opsiyon ticareti için harikadır. 2 tüm döviz çiftleri, hisse senetleri, emtialar, kripto para birimleri üzerinde çalışır Talimatlar: Kırmızı ok görün
1 100 USD
Support & Resistance indicator is a modification of the standard Bill Williams' Fractals indicator. The indicator works on any timeframes. It displays support and resistance levels on the chart and allows setting stop loss and take profit levels (you can check the exact value by putting the mouse cursor over the level). Blue dashed lines are support level. Red dashed lines are resistance levels. If you want, you can change the style and color of these lines. If the price approaches a support lev
30 USD
Magic Finger can help you identify trends and trading opportunities clearly. The finger points to the open position signal, and the discoloration line is confirmed by the trend. If you are a day trader, you can choose to trade during a period of active trading, referring to the discoloration line as the basis for the next order, finger signal as a filter. If you are a trend trader, you can choose a period above H1, wait for the appearance of the finger signal in the key price area, and enter
188 USD
Noize Absorption Index - is the manual trading system that measures the difference of pressure between bears forces and bulls forces. Green line - is a noize free index that showing curent situation. Zero value of index shows totally choppy/flat market.Values above zero level shows how powerfull bullish wave is and values below zero measures bearish forces.Up arrow appears on bearish market when it's ready to reverse, dn arrow appears on weak bullish market, as a result of reverse expectation.
199 USD
PipFinite Trend PRO MT5
Karlo Wilson Vendiola
4.86 (652)
Breakthrough Solution For Trend Trading And Filtering With All Important Features Built Inside One Tool! Trend PRO's smart algorithm detects the trend, filters out market noise and gives entry signals with exit levels. The new features with enhanced rules for statistical calculation improved the overall performance of this indicator. Important Information Revealed Maximize the potential of Trend Pro, please visit www.mql5.com/en/blogs/post/713938 The Powerful Expert Advisor Version Automa
98 USD
How to use Pair Trading Station Pair Trading Station is recommended for H1 time frame and you can use it for any currency pairs. To generate buy and sell signal, follow few steps below to apply Pair Trading Station to your MetaTrader terminal. When you load Pair Trading Station on your chart, Pair Trading station will assess available historical data in your MetaTrader platforms for each currency pair. On your chart, the amount of historical data available will be displayed for each currency pai
280 USD
Ultimate Supply Demand MT5
Ramon Sobrevals Arce
5 (2)
After working during many months, with the help of Neural Networks, we have perfected the ultimate tool you are going to need for identifying key price levels (Supports and Resistances) and Supply and Demand zones. Perfectly suitable to trigger your trades, set up your future actions, decide your Take Profit and Stop Loss levels, and confirm the market direction. Price will always move between those levels, bouncing or breaking; from one zone to another, all the remaining movements are just mark
79 USD
Automatic Fibonacci Tool Fibonacci retracements is a popular instrument used by technical analysts to determine potential Support and Resistance areas. In technical analysis, this tool is created by taking two extreme points (usually a peak and a minimum) on the chart and dividing the vertical distance by the key Fibonacci coefficients equal to 23.6%, 38.2%, 50%, 61.8%, and 100%. Our Automatic Fibonacci Tool is programmed to make thigs easier. Using this tool, there is no need to explicitly set
30 USD
Price reach indicator. It also serves as the perfect term for supports and resistance. I use it in two experts. The basic tool for professional trading. The indicator analyzes the last 500 bar and uses this to determine the levels ( but it doesn't predict the future ) . Personally, I use it on TF H1.  It is very simple. Four lines on chart and that's all. Only two input parameters.  Thousands of indicators. Why this? Is good ? No! Is very good. Please test the indicator prior to purchasing. You
49 USD
This is a Lite version of my Binary Wave Advance Oscillating indicator:  https://www.mql5.com/en/market/product/90734 It reduces the less useful indicators, while keeping it's predictive modifications to make each indicator within better than their stock counter part. I reduced it and made it simpler, in the hopes it would be less overwhelming and more approachable. Contains: ADX Chaikin Money Flow Index Each have separate smoothing controls to tame faster periods, as well as the Main has it's o
30 USD
Cumulative delta indicator As most traders believe, the price moves under the pressure of market buying or selling. When someone redeems an offer standing in the cup, the deal is a "buy". If someone pours into the bid standing in the cup - the deal goes with the direction of "sale". The delta is the difference between purchases and sales. A cumulative delta - the difference between the cumulative sum of purchases and sales for a certain period of time. It allows you to see who is currently contr
50 USD
Tunafish EA
Ismaele Daniele Lodetti
Tunafish EA is the most efficient EA on my profile. I spent a lot of time and effort to make this software sophisticated with possibilities of high potential returns while keeping the drawdown below 25%. The algorithms of the robot provide investors of any level of training with an investment opportunity that is both safe and aggressive. Tunafish EA imitating the work of the brain, capable of learning and adapting to changing conditions and predicting situations. When applied to trading in fina
69 USD
Modified Rainbow
Rafael Alejandro Rey Alves
Modified Rainbow   The Modified Rainbow indicator is intended to work in different scenarios. The indicator uses a combination of technical indicators to detect buy or sell opportunities (different Moving Averages and other technical indicators). The indicator works with any currency pair, stocks, cryptocurrencies and synthetic indices. The indicator can be used for both traditional trading and binary options. The indicator works with any time frame, from M1 to MN. When the blue arrow
30 USD
Trend Line Map indicator is an addons for   Trend Screener Indicator . It's working as a scanner for all signals generated by Trend screener ( Trend Line Signals ) . It's a Trend Line Scanner based on Trend Screener Indicator.  If you don't have Trend Screener Pro Indicator,   the Trend Line Map Pro will not work.     LIMITED TIME OFFER : Trend Line Map Indicator is available for only 50 $ and lifetime. ( Original price 125$ ) By accessing to our MQL5 Blog,  you can find all our premium indica
50 USD
This MT5 indicator has been designed to be used on any currency pair and any time frame . It has the scalper and swing trader in mind.  The indicator looks for short-term high-probability reversals in price and will indicate to you to go long (buy) or short (sell) if you see a green or red arrow next to the current candlestick respectively. The indicator provides the best trading opportunities to you during the active trading hours of London and New York, but it will continue to give signals al
199 USD
MetaTrend M5
Vahidreza Heidar Gholami
5 (1)
Meta Trend Indicator is an efficient way to forecast and detect the trend in any market. It reveals the trend, support and resistance levels, volatility and the maximum potential target, all in one indicator. To adapt to the price and to decrease consecutive trend failures, the internal trend detector algorithm studies the market and dynamically chooses the right values for the internal parameters. This indicator is a perfect trend filter for any strategy or expert advisor. Features Super Adapti
99 USD
This Indicator comes handy for everyone who uses Support and Resistance zones when trading. It will not only show you all major Supp/Res zones on the chart, but it will also notify you in a case of possible entry signal. Thanks to its customization possibilities, it will be the only indicator you will need when it comes down to trading Supp and Resistance zones.  !! If you decide to purchase the product, please contact me for further support and useful tips !! 
57 USD
Tired of plotting support and resistance lines? This is a multi-timeframe indicator that detects and plots supports and resistance lines in the chart with the same precision as a human eye would. As price levels are tested over time and its importance increases, the lines become thicker and darker, making price leves easy to glance and evaluate. [ Installation Guide | Update Guide | Troubleshooting | FAQ | All Products ] Boost your technical analysis Customizable timeframe selection Read pri
99 USD
Advanced Bollinger Bands Scanner is a multi symbol multi timeframe volatility scanner that monitors and analyzes the Bollinger Bands indicator from one chart. This panel scans the Bollinger bands indicator in up to 28 configurable instruments and 9 timeframes for price overbought/oversold, price consolidation, and consolidation breakout  with a deep scan feature to scan all market watch symbols (up to 1000 instruments!).    Download Demo here  (Scans only M1 and M6) Settings description   her
50 USD
Gold instrument scanner is the chart pattern scanner to detect the triangle pattern, falling wedge pattern, rising wedge pattern, channel pattern and so on. Gold instrument scanner uses highly sophisticated pattern detection algorithm. However, we have designed it in the easy to use and intuitive manner. Advanced Price Pattern Scanner will show all the patterns in your chart in the most efficient format for your trading. You do not have to do tedious manual pattern detection any more. Plus you
732 USD
An indicator of pattern #31 ("Long Island") from Encyclopedia of Chart Patterns by Thomas N. Bulkowski. The second gap is in the opposite direction. Parameters: Alerts - show alert when an arrow appears   Push - send a push notification when an arrow appears (requires configuration in the terminal) GapSize - minimum gap size in points ArrowType - a symbol from 1 to 17 ArrowVShift - vertical shift of arrows in points   ShowLevels - show levels ColUp - color of an upward line ColDn - color of a
30 USD
SBA scalping v75
Umri Azkia Zulkarnaen
ini adalah indikator khusus digunakan untuk trading di binary.com dengan pair volatility 75. indikator ini sangat simpel dan mudah digunakan baik untuk yang sudah profesional atau pun yang baru dalam dunia trading terutama yang baru di market volatility 75.indikator ini lebih bertujuan untuk scalping trader dan menggunakan timeframe M1 sebagai acuan untuk entry. adapun jika ingin mempelajari lebih lanjut bisa menghubungi di telegram  https://t.me/shadowbreakerfx . untuk SOP lengkap silahkan klik
110 USD
Volality Index scalper indicator  Meant for Volality pairs such as Volality 10, 25, 50, 75 and 100 The indicator works on all timeframes from the 1 minute to the monthly timeframe the indicator is non repaint the indicator has 3 entry settings 1 color change on zero cross 2 color change on slope change 3 color change on signal line cross Orange line is your sell signal Blue line is your buy signal.
35 USD
Double HMA MTF for MT5
Pavel Zamoshnikov
5 (2)
This is an advanced multi-timeframe version of the popular Hull Moving Average (HMA) Features Two lines of the Hull indicator of different timeframes on the same chart. The HMA line of the higher timeframe defines the trend, and the HMA line of the current timeframe defines the short-term price movements. A graphical panel with HMA indicator data from all timeframes at the same time . If the HMA switched its direction on any timeframe, the panel displays a question or exclamation mark with a tex
30 USD
Crypto to MT5
Rajesh Kumar Nait
Crypto.com'dan MT5'e Crypto.com websocket'ten Metatrader 5'e Canlı Şamdan Akışı OHCLV (Açık Yüksek Düşük Yakın Gerçek Hacim) Canlı Oran Verisi  tüccarlar, eğer bir dakikalık grafikte OHLC verileri doğru değilse, teknik tablo çalışmasında yanlış analiz verebilir, Bu ürün, manuel analizde yardımcı olabilecek gerçek zamanlı olarak doğru veriler verdiğini garanti eder diğer kripto ürünüme profilimden bakabilirsin https://www.mql5.com/en/users/rajeshnait/seller 1. OHLCV Verileri 2. Çoklu
30 USD
Alpha Trend MT5
Evgeny Belyaev
5 (1)
Alpha Trend MT5 is a trend indicator for the MetaTrader 5 platform; it has been developed by a group of professional traders. The Alpha Trend MT5 indicator finds the most probable tendency reversal points, which allows making trades at the very beginning of a trend. This indicator features notifications, which are generated whenever a new signal appears (alert, email, push-notification). This allows you to open a position in a timely manner. Alpha Trend does not redraw, which makes it possible t
35.90 USD
Alpha Binary Pro
Rafael Alejandro Rey Alves
1 (1)
The Alpha Binary Pro indicator is intended to work in different scenarios. This indicator uses a combination of technical indicators to detect buy or sell opportunities. The indicator works with any currency pair, stocks, cryptocurrencies and synthetic indices. The indicated can be used for both traditional trading and binary options. The indicator works with any time frame, from M1 to MN. When the blue arrow is pointing upwards this indicates that the signal is to buy. When the red
30 USD
Bu ürünün alıcıları ayrıca şunları satın alıyor
Advanced Supply Demand MT5
Bernhard Schweigert
4.36 (11)
Herhangi bir Acemi veya Uzman Tüccar için En İyi Çözüm! Bu gösterge benzersiz, yüksek kaliteli ve uygun fiyatlı bir ticaret aracıdır çünkü bir dizi tescilli özelliği ve yeni bir formülü bir araya getirdik. Bu güncelleme ile çift zaman dilimi dilimlerini gösterebileceksiniz. Yalnızca daha yüksek bir TF gösteremeyeceksiniz, aynı zamanda TF grafiğini ve ARTIK daha yüksek TF'yi de gösterebileceksiniz: YUVARLAK BÖLGELERİ GÖSTERMEK. Tüm Arz Talebi tüccarları buna bayılacak. :) Önemli Bilgiler Açıkland
199 USD
Blahtech Supply Demand MT5
Blahtech Limited
4.45 (11)
Supply Demand uses previous price action to identify potential imbalances between buyers and sellers. The key is to identify the better odds zones, not just the untouched ones. Blahtech Supply Demand indicator delivers functionality previously unavailable on any trading platform. This 4-in-1 indicator not only highlights the higher probability zones using a multi-criteria strength engine, but also combines it with multi-timeframe trend analysis, previously confirmed swings and engulfing detecto
142 USD
Royal Wave Pro M5
Vahidreza Heidar Gholami
5 (2)
Royal Wave is a Trend-Power oscillator which has been programmed to locate and signal low-risk entry and exit zones. Its core algorithm statistically analyzes the market and generates trading signals for overbought, oversold and low volatile areas. By using a well-designed alerting system, this indicator makes it easier to make proper decisions regarding where to enter and where to exit trades. Features Trend-Power Algorithm Low risk Entry Zones and Exit Zones Predictions for Overbought and Over
129 USD
Market Profile defines a number of day types that can help the trader to determine market behaviour. A key feature is the Value Area, representing the range of price action where 70% of trading took place. Understanding the Value Area can give traders valuable insight into market direction and establish the higher odds trade. It is an excellent addition to any system you may be using. Blahtech Limited presents their Market Profile indicator for the MetaTrader community. Inspired by Jim Dalton’s
142 USD
Royal Scalping Indicator M5
Vahidreza Heidar Gholami
5 (8)
Royal Scalping Indicator is an advanced price adaptive indicator designed to generate high-quality trading signals. Built-in multi-timeframe and multi-currency capabilities make it even more powerful to have configurations based on different symbols and timeframes. This indicator is perfect for scalp trades as well as swing trades. Royal Scalping is not just an indicator, but a trading strategy itself. Features Price Adaptive Trend Detector Algorithm Multi-Timeframe and Multi-Currency Trend Low
149 USD
Introduction to X3 Chart Pattern Scanner X3 Cherart Pattern Scanner is the non-repainting and non-lagging indicator detecting X3 chart patterns including Harmonic pattern, Elliott Wave pattern, X3 patterns, and Japanese Candlestick patterns. Historical patterns match with signal patterns. Hence, you can readily develop the solid trading strategy in your chart. More importantly, this superb pattern scanner can detect the optimal pattern of its kind. In addition, you can switch on and off individu
250 USD
Offer 249 down from 350 for the next 3 copies. then back to 350 $ Are you tired of using outdated indicators that leave you guessing where to set your profit targets? Look no further than the AK CAP Opening Range Breakout Indicator. This powerful tool is backed by a US patent and has already helped countless traders pass funded challenges like FTMO. We use it daily on our prop traders and internal funds, and now it's available to you as well. The calculation behind the indicator is incredibly
249 USD
Yeni Nesil Otomatik Arz ve Talep Bölgeleri. Her Grafikte Çalışan Yeni ve Yenilikçi Algoritma. Tüm Bölgeler Piyasanın Fiyat Hareketine Göre Dinamik Olarak Oluşturulmaktadır. İKİ TÜR UYARI --> 1) FİYAT BİR BÖLGEYE ÇIKTIĞINDA 2) YENİ BİR BÖLGE OLUŞTURDUĞUNDA Bir tane daha işe yaramaz gösterge almazsın. Kanıtlanmış Sonuçlarla eksiksiz bir Ticaret Stratejisi elde edersiniz.     Yeni özellikler:     Fiyat Arz/Talep Bölgesine ulaştığında uyarılar     Yeni bir Arz/Talep Bölgesi olu
149 USD
God win spike system
Israr Hussain Shah
1 (1)
• Non Repaint • DelayNo Lag •Pop Up notification • 98% Verified Accuracy • Real time arrows to catch spikes at least 4-8 bars We forward guide video how milk spikes  We also add in telegram group for better quality help  +see live trading results  https://youtu.be/DCG4CAWlg4I you will see an arrow signal and open trade for spike stop-loss of trade will be 8 or 10 candles if no spike exit you just need to follow spike arrow signals and for more good results follow inst
200 USD
Relative Cyclicality
Cristian Mihail Pauna
The Relative Cyclicality indicator defines the cycles of any price evolution. This indicator is computed by applying the "Cyclicality" mathematical transformation to the classic Relative Strength Index indicator made by J. Welles Wilder. The Relative Cyclicality defines very good entry and exit trading signals near the minimal and maximal points. It is better than RSI itself due to the unicity of the minimal and maximal points on a specific time interval. The Relative Cyclicality indicator can b
300 USD
The Price Cyclicality indicator defines the cycles of any price evolution. It shows clearly the ascending and descending intervals with asymptotic evolution near the minimal and maximal price values. The Price Cyclicality indicator can be used to generate automated entry signals near the minimal price values. Also, the Price Cyclicality indicator can be used to define limit conditions to generate automated exit signals near the maximal price values. The efficiency of this indicator was proved du
300 USD
Trade system "PAX Multi TMA/HMA 8" for MT5 it is a ready-made trading system for trading on any instrument and any timeframe. An experienced trader on one instrument can get a profit   from 100% to 400% per day . Completely ready for manual trading and use in robots. Not redrawn signals. It is convenient to work on any timeframe. Tested on metals, currency pairs, oil, international stocks, Russian stocks, cryptocurrencies, monetary and cryptocurrency indices. What the trading sy
144 USD
Fear and Greed MT5
Diego Arribas Lopez
5 (1)
MT4 Version   Fear and Greed MT5 Indicator Uncertain at the time of making the decision to realize total or partial profits? Fear and Greed MT5 provides great help with a high level of reliability when making such decistions. TRY IT FOR FREE NOW! Fear and Greed MT5 is the first indicator that offers information on the Fear and Greed level in the market for MT5. It has been developed to facilitate the decision-making at the time of entring a trade and taking total or partial profits. It shows pos
129 USD
Golden Spikes Detector
Batsirayi L Marango
5 (1)
Golden Spikes Detector This indicator is based on an advanced strategy primarily for trading spikes on Boom and Crash Indices. Complex algorithms were implanted to detect high probability entries only. It alerts on potential Buy and Sell entries. To trade spikes on the Deriv or Binary broker, only take Buy Boom and Sell Cash alerts. It was optimised for 5-minute timeframe. Features ·          Sends push notifications to mobile phone ·          Pop up and sound alerts on computer or laptop ·     
150 USD
WAPV Full MT5
Eduardo Da Costa Custodio Santos
## WAPV Full kullanarak profesyonelce çalışın ve takip edin büyük oyuncuların parası nerede Elinizde okumayı tek başına yapan bir araç olduğunu hayal edin. en iyi ticaret bölgelerini gösteren başlıca Piyasa Oyuncuları Fiyat ve Hacim analizine dayalı. WAPV Full, eksiksiz bir araçtır ve %100 R. Wyckoff'un operasyonel özelliklerine odaklanmıştır. Ticaret dalgalarındaki piyasa hareketlerini haritalamaya ek olarak, aynı zamanda Fiyat ve Hacmi okuyarak Pazar. Profesyonel Pazar, R. Wyckoff'un 3 yasası
199 USD
VTrende Pro
Andrey Dyachenko
VTrende Pro - MTF indicator for trend trading with a display panel for MT5 *** Videos can be translated into any language using subtitles (video language - Russian) Although the signals of the VTrende Pro indicator can be used as signals of a full-fledged trading system, it is recommended to use them in conjunction with the Bill Williams TS. VTrende Pro is an extended version of the VTrende indicator. Difference between Pro version and VTrende: - Time zones - Signal V - signal 1-2 waves
697 USD
TPA True Price Action indicator reveals the true price action of the market makers through 100% non-repainting signals strictly at the close of a candle! TPA shows entries and re-entries, every time the bulls are definitely stronger than the bears and vice versa. Not to confuse with red/green candles. The shift of power gets confirmed at the earliest stage and is ONE exit strategy of several. There are available now two free parts of the TPA User Guide for our customers. The first "The Basics"
168 USD
Rubdfx Fiyat Takibi Fiyat fiyat bağlılığını göstermek için kullanılır, fiyat neredeyse hiç kanal dışına çıkmaz ve çoğu zaman fiyat kanal limitlerine dokunduğunda tepki verir. Satış yapabileceğiniz en yüksek ve en düşük fiyatları belirler. ve sırasıyla satın al Scalping & swing ticareti için uygun Bir mum kapandıktan sonra görünen okları çizer. Oklar, sırasıyla düşüş ve yükseliş eğilimi için yükseliş veya düşüş baskısını gösterir. Bir ok gördüğünüzde, mumun bir okla kapanıp kapanmayacağını g
259 USD
Weis Wave with Alert MT5
Panagiotis Diamantopoulos
4.92 (13)
20% Off from 499$ to 399$, offer end 31/3/2023    https://youtu.be/RjSSW0byp-I ** NEW PLUTUS SIGNALS and ALL IN ONE ** Wychoff's UpThrust + Spring, Fake Breaks and Plutus  trading signals added (for more info visit    http://www.tradethevolumewaves.com  ) (for more info visit    http://www.tradethevolumewaves.com )   Different Wave Types,  choose what your cumulative Histogram diplays: Volume, Pips, Progressive Volume Rate, Time or Emphasized Volume Waves  ** IF YOU PURCHASE DO NOT FORGET TO CO
399 USD
This is arguably the most complete harmonic price formation auto-recognition indicator you can find for the MetaTrader Platform. It detects 19 different patterns, takes fibonacci projections as seriously as you do, displays the Potential Reversal Zone (PRZ) and finds suitable stop-loss and take-profit levels. [ Installation Guide | Update Guide | Troubleshooting | FAQ | All Products ] It detects 19 different harmonic price formations It plots primary, derived and complementary Fibonacci p
149 USD
This indicator is a perfect wave automatic analysis indicator for practical trading! The standardized definition of the band is no longer a wave of different people, and the art of man-made interference is eliminated, which plays a key role in strict analysis of the approach.=》Increase the choice of international style mode, (red fall green rise style) The  purchase discount is currently in progress! Index content: 1.Basic wave: First, we found the inflection point of the basic fluctua
188 USD
MetaBands M5
Vahidreza Heidar Gholami
5 (1)
MetaBands uses powerful and unique algorithms to draw channels and detect trends so that it can provide traders with potential points for entering and exiting trades. It’s a channel indicator plus a powerful trend indicator. It includes different types of channels which can be merged by the user to create new channels simply by using the input parameters. MetaBands uses all types of alerts to notify the user about market events. Features Supports most of the channel algorithms Powerful trend det
129 USD
The Volume by Price Indicator for MetaTrader 5 features Volume Profile and Market Profile TPO (Time Price Opportunity). Get valuable insights out of currencies, equities and commodities data. Gain an edge trading financial markets. Highest quality real-time and historical price data distributions. Versatile range selection methods. Drag and drop with time/price option. Unlimited segmentation. Session filtering with built-in presets for New York, London, Tokyo, Sydney and São Paulo. Composites w
149.95 USD
The best Tool to Catch Boom and Crash Spikes like a Pro!!! You want to become a constantly Boom and Crash Trader This is an advanced indicator used to catch Boom and Crash Indices spikes beforehand. It alerts on high probability entries with an amazing success rate. We recommend using a Virtual Private Server for receiving 24/7 notifications via email or phone How to trade with Mega Spikes Max 1.7 ? When arrow is displayed on the chart wait for audible alert or push notification to be sen
130 USD
ACB Breakout Arrows MT5
KEENBASE SOFTWARE SOLUTIONS
5 (1)
The ACB Breakout Arrows indicator provides a crucial entry signal in the market by detecting a special breakout pattern. The indicator constantly scans the chart for a settling momentum in one direction and provide the accurate entry signal right before the major move. Get multi-symbol and multi-timeframe scanner from here - Scanner for ACB Breakout Arrows MT 5 Key features Stoploss   and Take Profit levels are provided by the indicator. Comes with a MTF Scanner dashboard which tracks the br
180 USD
Of all the four principle capital markets, the world of foreign exchange trading is the most complex and most difficult to master, unless of course you have the right tools! The reason for this complexity is not hard to understand. First currencies are traded in pairs. Each position is a judgment of the forces driving two independent markets. If the GBP/USD for example is bullish, is this being driven by strength in the pound, or weakness in the US dollar. Imagine if we had to do the same thing
197 USD
The Quantum VPOC indicator has been developed to expand the two dimensional study of volume and price, to a three dimensional one which embraces time. The volume/price/time relationship then provides real insight to the inner workings of the market and the heartbeat of sentiment and risk which drives the price action accordingly. The Quantum VPOC indicator displays several key pieces of information on the chart as follows: Volume Profile - this appears as a histogram of volume on the vertical pr
197 USD
Elliott Wave Trend was designed for the scientific wave counting. This tool focuses to get rid of the vagueness of the classic Elliott Wave Counting using the guideline from the template and pattern approach. In doing so, firstly Elliott Wave Trend offers the template for your wave counting. Secondly, it offers Wave Structural Score to assist to identify accurate wave formation. It offers both impulse wave Structural Score and corrective wave Structure Score. Structural Score is the rating to sh
200 USD
The signal conditions are a combination of three indicators, and XQ Forex Indicators only display  medium and long-term trends . The indicator's efficacy has been improved with the addition of a filter that blocks out false signals. The XQ Forex Indicator can be used on   FX pairs, CFDs, and Cryptocurrencies . There are two type of signals:  Buy or Sell and Big Long or Big Short It is possible to enable sending emails when a major trend-change signal is detected, as well as to display the alerts
179 USD
New Trading forecasting method from WD.Gann Method'sLibrary ..... Price and time foresting method A very usefull tool to find out turning point of market on any time frame parameters set for 15m-30 min REDUCE parameter for Higher time frames like H1,H4, Daily,Weekly or monthly... Our Forecast also given high accuracy in binary option like 1min or 5 min expiry candle use maximum 1 candle martingale to trade opposite side of last candle ... Techniques :- Find out good support and resistance point
150 USD
Yazarın diğer ürünleri
Advanced Supply Demand
Bernhard Schweigert
4.94 (286)
CURRENTLY 26% OFF !! Best Solution for any Newbie or Expert Trader! This indicator is a unique, high quality and affordable trading tool because we have incorporated a number of proprietary features and a new formula. With this update, you will be able to show double timeframe zones. You will not only be able to show a higher TF but to show both, the chart TF, PLUS the higher TF: SHOWING NESTED ZONES. All Supply Demand traders will love it. :) Important Information Revealed Maximize the potenti
148 USD
ŞU ANDA %26 INDIRIMLI Yeni Başlayanlar veya Uzman Tüccarlar için En İyi Çözüm! Bu Gösterge benzersiz, yüksek kaliteli ve uygun fiyatlı bir ticaret aracıdır çünkü bir dizi tescilli özellik ve yeni bir formül ekledik. Sadece BİR grafik ile 28 Forex çifti için Döviz Gücünü okuyabilirsiniz! Yeni bir trendin veya scalping fırsatının tam tetik noktasını belirleyebildiğiniz için ticaretinizin nasıl gelişeceğini hayal edin? Kullanım kılavuzu: buraya tıklayın Bu ilk olan, orijinal! Değersiz bir
148 USD
ŞU ANDA %31 INDIRIMLI !!! Yeni Başlayanlar veya Uzman Tüccarlar için En İyi Çözüm! Bu gösterge benzersiz, yüksek kaliteli ve uygun fiyatlı bir ticaret aracıdır çünkü bir dizi tescilli özellik ve gizli bir formül ekledik. Yalnızca BİR grafikle 28 döviz çiftinin tümü için Uyarılar verir. Yeni bir trendin veya scalping fırsatının tam tetik noktasını belirleyebildiğiniz için ticaretinizin nasıl gelişeceğini hayal edin! Yeni temel algoritmalar üzerine inşa edilen bu sistem, potansiyel işlemler
88 USD
Şu anda %20 İNDİRİMLİ! Herhangi bir Acemi veya Uzman Tüccar için En İyi Çözüm! Bu gösterge paneli yazılımı 28 döviz çifti üzerinde çalışıyor. Ana göstergelerimizden 2'sine (Gelişmiş Para Birimi Gücü 28 ve Gelişmiş Para Birimi Dürtüsü) dayanmaktadır. Tüm Forex piyasasına harika bir genel bakış sağlar. Gelişmiş Para Birimi Gücü değerlerini, para birimi hareket hızını ve tüm (9) zaman dilimlerinde 28 Forex çifti için sinyalleri gösterir. Trendleri ve / veya scalping fırsatlarını belirlemek içi
199 USD
Advanced Supply Demand MT5
Bernhard Schweigert
4.36 (11)
Herhangi bir Acemi veya Uzman Tüccar için En İyi Çözüm! Bu gösterge benzersiz, yüksek kaliteli ve uygun fiyatlı bir ticaret aracıdır çünkü bir dizi tescilli özelliği ve yeni bir formülü bir araya getirdik. Bu güncelleme ile çift zaman dilimi dilimlerini gösterebileceksiniz. Yalnızca daha yüksek bir TF gösteremeyeceksiniz, aynı zamanda TF grafiğini ve ARTIK daha yüksek TF'yi de gösterebileceksiniz: YUVARLAK BÖLGELERİ GÖSTERMEK. Tüm Arz Talebi tüccarları buna bayılacak. :) Önemli Bilgiler Açıkland
199 USD
Supply and Demand Dashboard PRO
Bernhard Schweigert
4.79 (19)
Şu anda %20 İNDİRİMLİ! Bu gösterge paneli, birden fazla sembol ve 9 zaman dilimine kadar çalışan çok güçlü bir yazılım parçasıdır. Ana göstergemize dayanmaktadır (En iyi yorumlar: Advanced Supply Demand ).     Gösterge paneli harika bir genel bakış sağlar. Gösterir:    Bölge mukavemet derecesi dahil filtrelenmiş Arz ve Talep değerleri, Bölgelere/ve bölgeler içindeki pip mesafeleri, İç içe geçmiş bölgeleri vurgular, Tüm (9) zaman dilimlerinde seçilen semboller için 4 çeşit uyarı verir. Kişis
199 USD
Currency Strength Exotics
Bernhard Schweigert
5 (23)
ŞU ANDA %20 INDIRIMLI! Herhangi bir Acemi veya Uzman Tüccar için En İyi Çözüm! Bu Gösterge, Egzotik Çiftler Emtialar, Endeksler veya Vadeli İşlemler gibi herhangi bir sembol için para birimi gücünü göstermek için uzmanlaşmıştır. Türünün ilk örneğidir, Altın, Gümüş, Petrol, DAX, US30, MXN, TRY, CNH vb. gerçek para birimi gücünü göstermek için 9. satıra herhangi bir sembol eklenebilir. Bu benzersiz, yüksek kaliteli ve uygun fiyatlı bir ticaret aracıdır çünkü bir dizi tescilli özelliği ve yeni
128 USD
Bu gösterge, 2 ürünümüz Advanced Currency IMPULSE with ALERT  +   Currency Strength Exotics  'in süper bir kombinasyonudur. Tüm zaman dilimleri için çalışır ve 8 ana para birimi artı bir Sembol için grafiksel olarak güç veya zayıflık dürtüsünü gösterir! Bu Gösterge, Altın, Egzotik Çiftler, Emtialar, Endeksler veya Vadeli İşlemler gibi herhangi bir sembol için para birimi gücü ivmesini göstermek için uzmanlaşmıştır. Türünün ilk örneğidir, Altın, Gümüş, Petrol, DAX, US30, MXN, TRY, CNH vb.
149 USD
ŞU ANDA %20 INDIRIMLI! Yeni Başlayanlar veya Uzman Tüccarlar için En İyi Çözüm! Bu Gösterge uygun fiyatlı bir ticaret aracıdır çünkü yeni bir formülle birlikte bir dizi tescilli özelliği bir araya getirdik. Gelişmiş Birikmiş Döviz Hacmi Göstergesi, ana 28 Forex çifti için uzmanlaşmıştır ve tüm zaman dilimlerinde çalışır. Tek bir grafik üzerinde AUD, CAD, CHF, EUR, GBP, JPY, NZD ve USD'nin tüm döviz hacmini (C-Hacmi) çıkaran yeni bir formüldür. Bu, ticarette büyük bir avantajdır. Hacim tüc
58 USD
My Trade History PRO
Bernhard Schweigert
5 (3)
ŞU ANDA %20 INDIRIM !! Yeni Başlayanlar veya Uzman Tüccarlar için En İyi Çözüm! İşlemlerinizi gözden geçirmek, başarılı bir tüccar olmanın ilk adımıdır. Başarılı tüccarlar, ticaret performanslarını düzenli olarak gözden geçirme alışkanlığına sahiptir. Bu araç tam da bunu yapmanıza yardımcı olacaktır. İnceleme süreci, ticaretinizi izlemek için bu araçla en etkili olacaktır. Manuel işlemlerinizi veya EA'nızın işlemlerini analiz edin. 3 genel görünümü kullanın. Arasında geçiş yapmak için
65 USD
ŞU ANDA %26 INDIRIMLI !!! Bu gösterge, her iki ana göstergemizin ( Advanced Currency Strength 28  &   Advanced Currency IMPULSE with ALERT )  süper bir kombinasyonudur. TICK-UNITS için Para Birimi Gücü değerlerini ve 28 Forex çifti için uyarı sinyallerini gösterir. 11 farklı Tick-Unit kullanılabilir. Bunlar 1, 2, 3, 4, 5, 6, 10, 12, 15, 20 ve 30 Saniyedir. Alt penceredeki Tick-Unit çubuğu, saniyenin zamanlayıcısı içinde en az 1 tik olduğunda gösterilecek ve sola kaydırılacaktır.  Yalnızca B
148 USD
Yeni Başlayanlar veya Uzman Tüccarlar için En İyi Çözüm! Bu gösterge benzersiz, yüksek kaliteli ve uygun fiyatlı bir ticaret aracıdır çünkü bir dizi tescilli özellik ve gizli bir formül ekledik. Yalnızca BİR grafikle 28 döviz çiftinin tümü için Uyarılar verir. Yeni bir trendin veya scalping fırsatının tam tetik noktasını belirleyebildiğiniz için ticaretinizin nasıl gelişeceğini hayal edin! Yeni temel algoritmalar üzerine inşa edilen bu sistem, potansiyel işlemlerin belirlenmesini ve onaylan
128 USD
My Trades in Pips
Bernhard Schweigert
4.67 (21)
Kaçırmak istemeyeceğiniz bir ticaret aracı. Gösterge, grafikteki tüm işlemleri / işlemleri bağlı olduğu sembolle görüntüler. Kar veya zarardaki pip sayısını yazdırır. Seçime göre, daha iyi analiz için alt pencerelerden dikey bir çizgi yazdırır. PRO sürümünü de buradan kontrol edin: Ticaret Geçmişim PRO https://www.mql5.com/en/market/product/50206 Ayrıca, para yatırma para birimindeki işlemlerin toplam sonucu ve toplam pip hakkında bilgi ekler. Yalnızca günün işlemlerini göstermeyi veya ya
FREE
Filtre:
İnceleme yok
İncelemeye yanıt
Sürüm 7.3 2022.10.03
Various improvements for new Metatrader version.
Sürüm 4.5 2020.05.10
Various improvements.
Sürüm 4.2 2018.10.09
Several improvements.

Also a timer for delay can now be added if you wish:
New input:
==== other settings
+ pause runs in seconds to next update (for less CPU use)
It will pause on the live candle instead of using every tick.
Default is 0 (not used).
Sürüm 4.1 2018.09.06
Optimized the main function and made equations faster.
Sürüm 4.0 2018.07.23
Added new buffers to show historically the dynamic market Fibonacci reversal levels instead of horizontal lines.
Sürüm 3.3 2017.08.31
+ optimized currency strength functions with MT5
+ added update cross pairs
Since the last update was added open support charts for USD pairs.
Now you can also update all cross pairs.
New input:
+ run support charts also on cross pairs!
It will open only ONE update chart and update all cross pairs on this chart in the back ground.
+ Optimized drawings of the arrows in the sub-window. They will now draw faster.


Sürüm 3.2 2017.07.04
Optimized the function for the 7 update quote charts and how multiple indicators will share it.
Made sure the indicator will draw also in the weekend without ticks when the market is closed.
Sürüm 3.1 2017.06.30
+ added a historical Market Fibonacci 23 buffer for arrows and alerts.
+ added arrows in sub-window to show strong currency momentum GAP.
+ added warning signs in the main window for individual chart when the base or quote currency is in oversold/overbought zone (outer market Fibonacci levels).
+ added pullback/reversal alert when currency strength drops back from outer range.
+ As requested by customer I added a special alert of a cross pattern.
All the graphics are based on the new buffer which represents historical Market Fibonacci 23 with dynamic Market Fibonacci values.
NEW INPUT PARAMETERS:
+ draw GAP
+ GAP Market Fib (23)
+ draw Outer MFib stop
+ Outer MFib stop (100)
==== Alert settings
+ alert outer MFib Trigger HIT
+ alert outer MFib Trigger HOOK
+ outer MFib Trigger level
+ minimum hook GAP (28)
+ popup Alerts
+ send email alerts
+ send push alerts
+ Arrow stop Color
=== Alert settings CS cross
+ activate currency cross functions
+ cross market Fib slope
+ use 4 bars cross pattern (false = 3 bars)
+ alert currency cross
+ show triangle on subwindow
+ show vertical line for chart symbol
+ color for cross line

Another magic function will open 7 support charts to speed up the broker feed and the external history data.

New input:
+ open support charts!