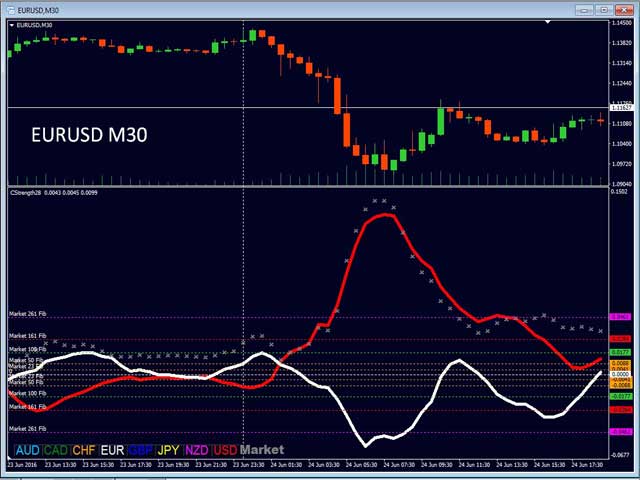
Advanced Currency Strength28 MT5
- Indicadores
- Bernhard Schweigert
- Versión: 8.9
- Actualizado: 11 marzo 2024
- Activaciones: 5
¡La mejor solución para cualquier operador novato o experto!
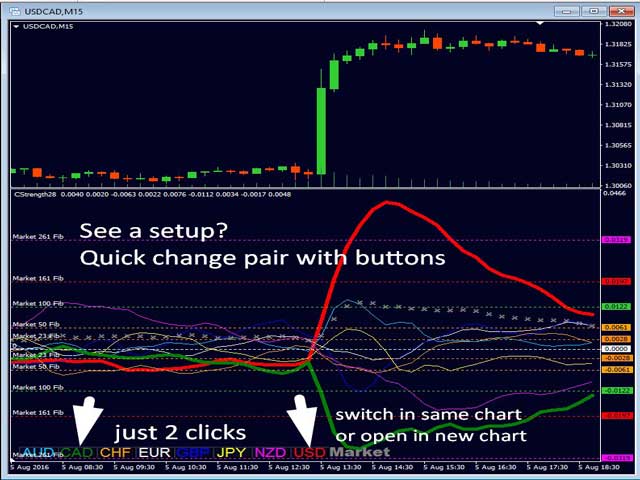
Este indicador es una herramienta única, de alta calidad y asequible porque hemos incorporado una serie de características propias y una nueva fórmula. ¡Con sólo UN gráfico puede leer la Fuerza de la Divisa para 28 pares de Divisas! Imagínese cómo mejorará su operativa porque podrá señalar el punto exacto de activación de una nueva tendencia o de una oportunidad de scalping.
Manual del usuario: haga clic aquí
Ese es el primero, ¡el original! No compre un clon sin valor.
El especial
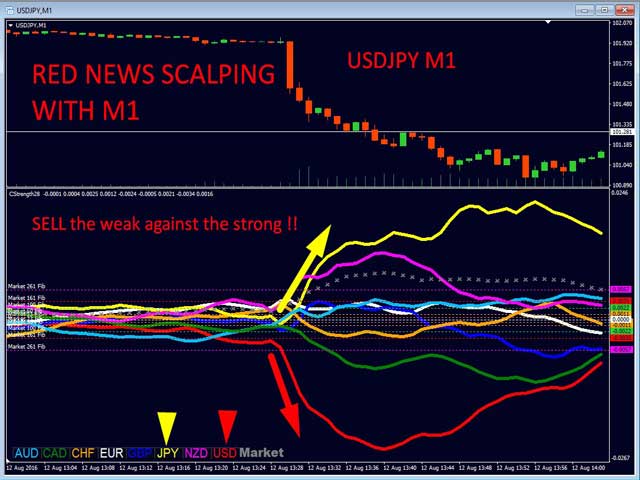
- ¡Flechas en sub-ventana para mostrar fuerte impulso de la moneda GAP guiará su comercio!
- Señales de advertencia en la ventana principal del gráfico individual cuando la divisa base o cotizada está en zona de sobreventa/sobrecompra (niveles Fibonacci exteriores del mercado).
- Alerta de retroceso/retroceso cuando la fuerza de la divisa retrocede desde el rango exterior.
- Alerta especial de un patrón cruzado
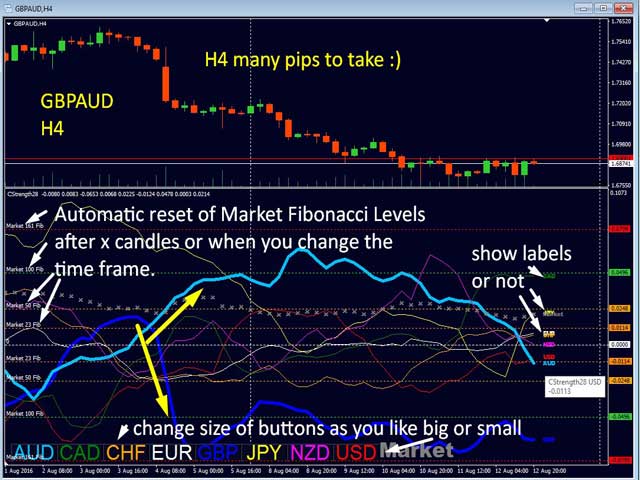
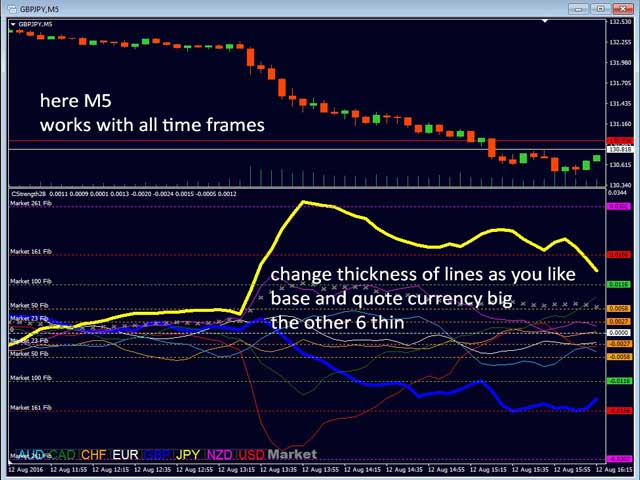
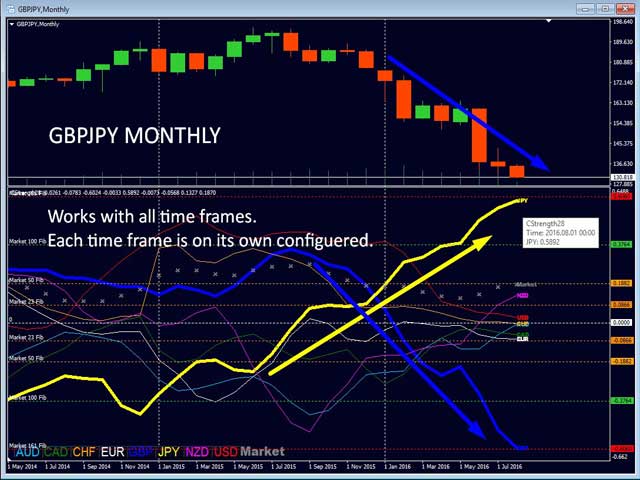
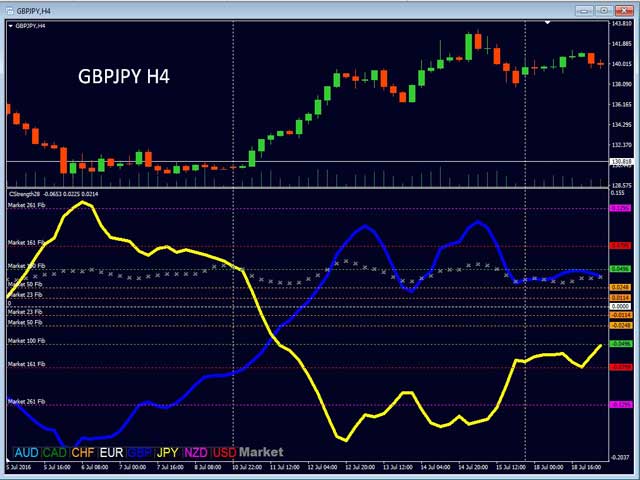
Disponible con múltiples marcos temporales para ver rápidamente la TENDENCIA. Las líneas de fuerza de la divisa son muy suaves en todos los marcos de tiempo y funcionan muy bien cuando se utiliza un marco de tiempo más alto para identificar la tendencia general y, a continuación, utilizando los marcos de tiempo más cortos para identificar las entradas precisas. Puede elegir el marco temporal que desee. Cada marco de tiempo está optimizado por sí mismo.
Construido sobre nuevos algoritmos subyacentes que hace que sea aún más fácil de identificar y confirmar las operaciones potenciales. Esto se debe a que muestra gráficamente si la fuerza o debilidad de una moneda está aumentando o no y cómo se desempeñó en el pasado. Estas características fueron diseñadas para ayudar a que sea más fácil para usted no sólo identificar cuáles son las monedas fuertes y débiles, sino también para mostrarle cuándo operar, cuándo no operar y cuándo tomar ganancias.
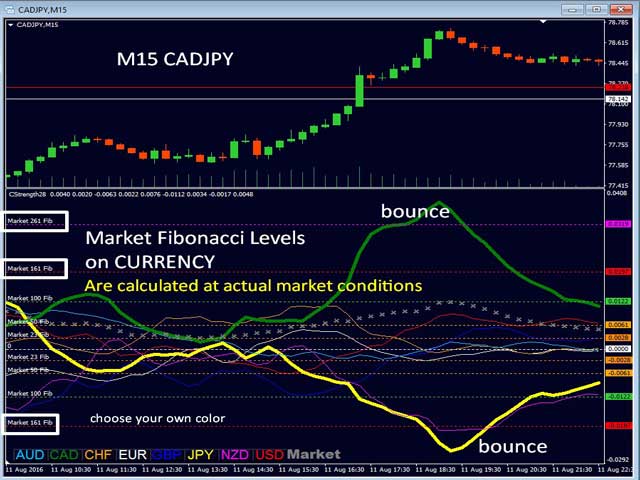
El indicador Advanced Currency Strength28 funciona con los 28 pares de divisas. Se trata de una nueva fórmula, y las características más novedosas son el impulso del mercado y los niveles dinámicos de Fibonacci que se adaptan a la actividad actual del mercado. Market Momentum es la novena línea. Esta es una gran ventaja y nuevo en el comercio de Forex. Cuando aprenda a utilizar las funciones patentadas como el impulso del mercado y los Fibonacci dinámicos del mercado, podrá saber si desea operar con la tendencia, buscar una continuación de la tendencia o un retroceso.
Todos los gráficos se basan en los nuevos topes que representan los niveles históricos de Fibonacci dinámico del mercado.
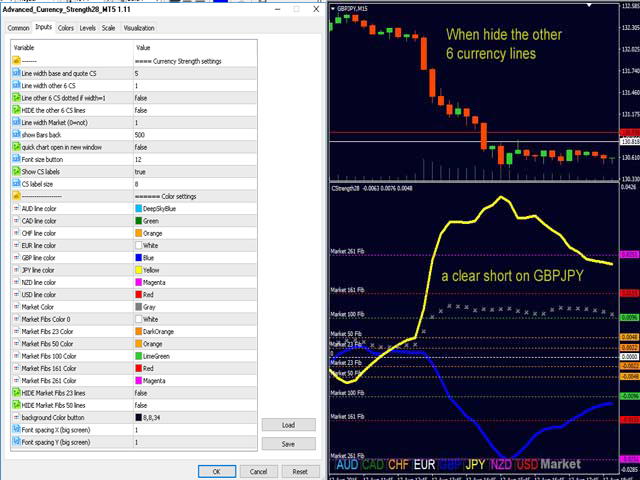
Parámetros del indicador
Para ver la lista completa haga clic aquí
=== Parámetros del gráfico
=== Parámetros de alerta
=== Configuración de alertas CS cross
Consejos
- Utilice mi plantilla. Ver manual
- Utilice "abrir gráfico en ventana nueva" si no desea interrumpir el indicador.
- Manténgase dentro de la tendencia (GAP de divisas) del marco de tiempo superior.
- Busque el doble GAP de divisas como configuración de la operación.
- ESPECIAL: ¡Para actualizar el historial de gráficos de MT4 se abrirán 7 gráficos de soporte (ver manual)! Esta función se puede desactivar.
- Compruebe mis noticias y blogs en el perfil para el sistema de comercio y ejemplos de comercio.
Siempre te ayudaré si tienes alguna pregunta.
Les deseo muchos pips verdes en el futuro.
¡Traducido automáticamente! Inglés Original haga clic aquí
you can not believe the author support and guidance i had too many questions and he answered every single of them i will using the indicator for 2 weeks in demo and after that ,if it was good i will go for live , i will update my honest review so you can judge your self , thank you bernhard for your patience and good support
update:
28/3/2024 ive test it in many ways and if you learn the full tutorial and master it you will have good profit , this indicator does everything that author claim and works best with impulse , with cs28 you can understand which pair is good for trade at the moment and impulse shows you if the pair is going to move or not