Advanced Currency Strength28 MT5
- 지표
- Bernhard Schweigert
- 버전: 8.9
- 업데이트됨: 11 3월 2024
- 활성화: 5
초보자 또는 전문가 트레이더를 위한 최고의 솔루션!
이 지표는 우리가 독점 기능과 새로운 공식을 통합했기 때문에 독특하고 고품질이며 저렴한 거래 도구입니다. 단 하나의 차트로 28 Forex 쌍의 통화 강도를 읽을 수 있습니다! 새로운 추세 또는 스캘핑 기회의 정확한 트리거 포인트를 정확히 찾아낼 수 있기 때문에 거래가 어떻게 개선될지 상상해 보십시오.
사용 설명서: 여기를 클릭 https://www.mql5.com/en/blogs/post/697384
그것이 첫 번째, 원본입니다! 쓸모없는 지망생 클론을 사지 마십시오.
더 스페셜
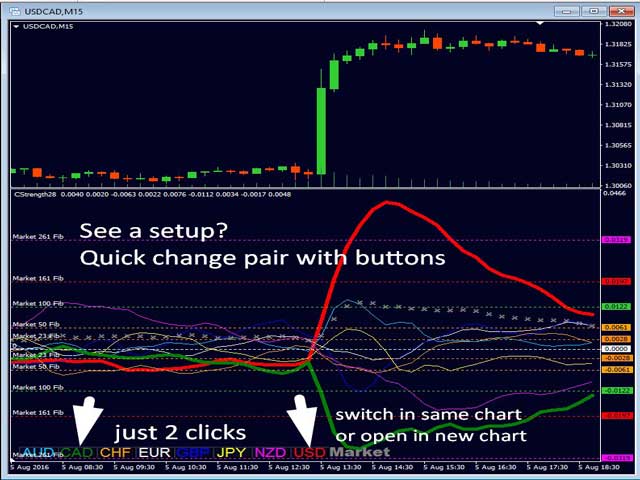
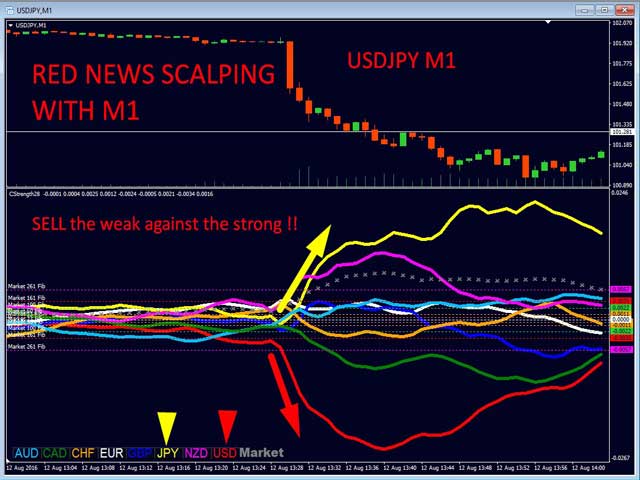
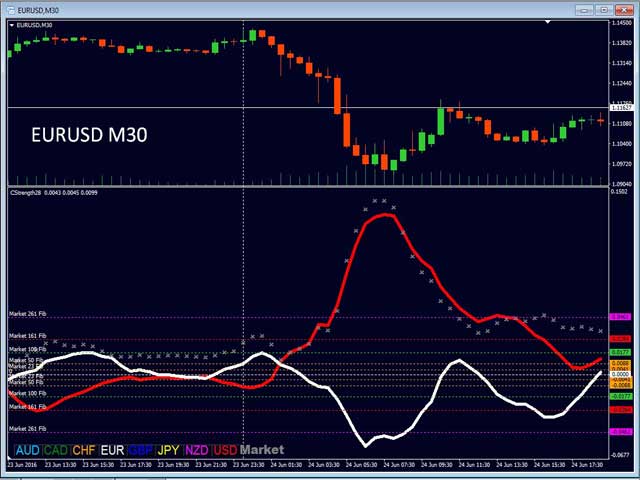
- 강력한 통화 모멘텀을 보여주는 하위 창의 화살표 GAP가 거래를 안내합니다!
- 기본 또는 호가 통화가 과매도/과매도 영역(외부 시장 피보나치 수준)에 있을 때 개별 차트의 기본 창에 경고 표시가 나타납니다.
- 통화 강도가 외부 범위에서 떨어질 때 풀백/반전 경고.
- 교차 패턴의 특별 경고
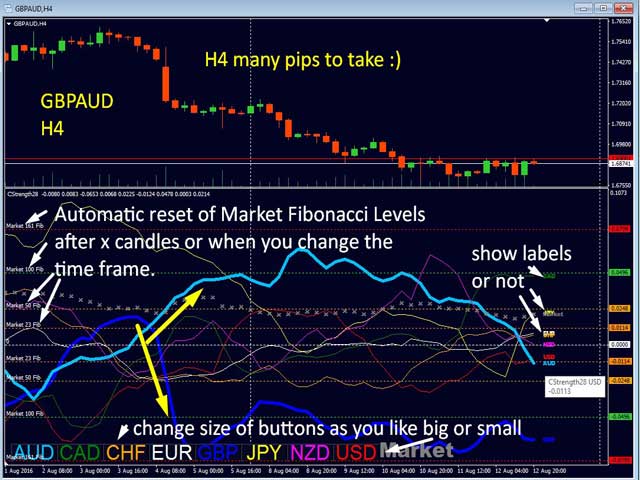
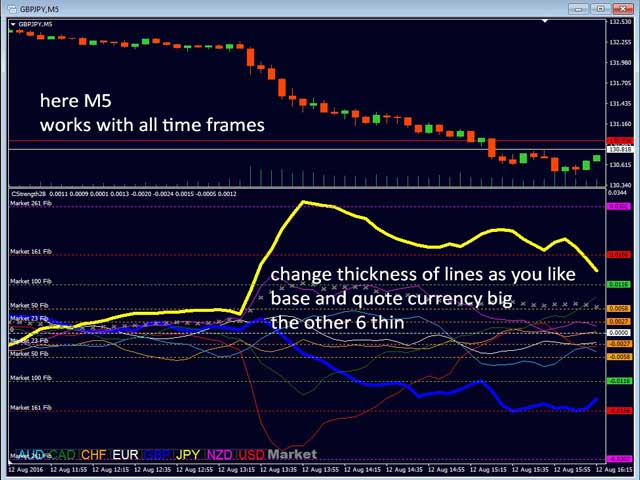
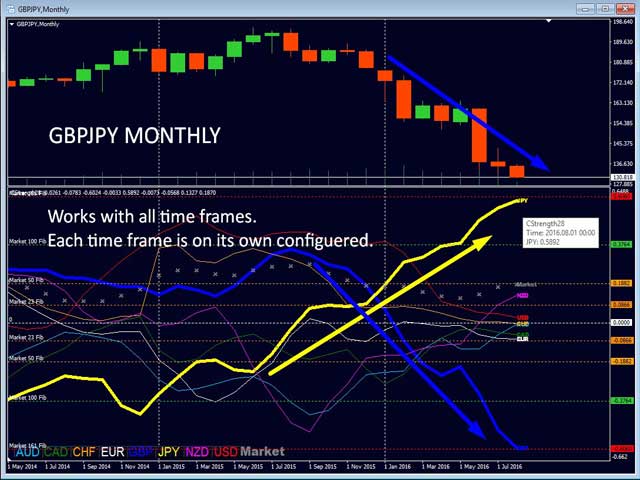
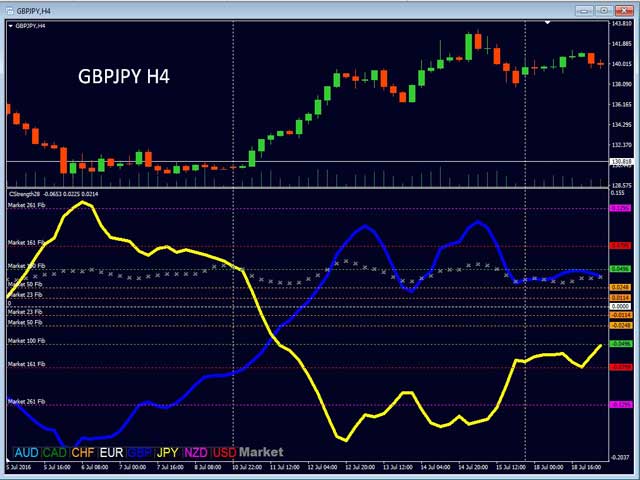
추세를 빠르게 볼 수 있는 다중 시간 프레임 선택이 가능합니다! 통화 강도선은 모든 기간에 걸쳐 매우 매끄럽고 더 높은 기간을 사용하여 일반적인 추세를 식별한 다음 더 짧은 기간을 사용하여 정확한 항목을 찾아낼 때 아름답게 작동합니다. 원하는 시간 프레임을 선택할 수 있습니다. 모든 시간 프레임은 자체적으로 최적화됩니다.
새로운 기본 알고리즘을 기반으로 구축되어 잠재적인 거래를 훨씬 더 쉽게 식별하고 확인할 수 있습니다. 이는 통화의 강세 또는 약세가 증가하고 있는지 여부와 과거 실적을 그래픽으로 보여주기 때문입니다. 이러한 기능은 강세 통화와 약세 통화를 쉽게 식별할 수 있을 뿐만 아니라 언제 거래를 해야 하는지, 언제 거래를 하지 말아야 하는지, 언제 수익을 내야 하는지를 보여주기 위해 고안되었습니다.
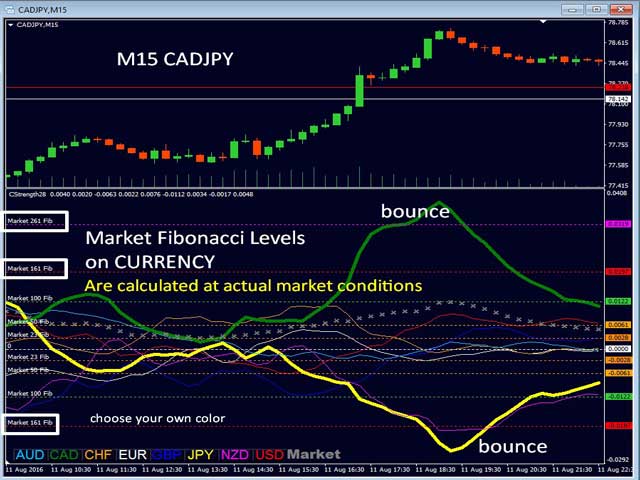
Advanced Currency Strength28 Indicator는 모든 THE 28 통화 쌍에서 작동합니다. 그것은 새로운 공식이며 매우 새로운 기능은 시장 모멘텀과 현재 시장 활동에 적응하는 동적 시장 피보나치 수준입니다! 시장 모멘텀은 9번째 라인입니다. 이것은 Forex 거래에서 큰 이점이자 새로운 것입니다. 시장 모멘텀 및 동적 시장 피보나치와 같은 독점 기능을 사용하는 방법을 배우면 추세에 따라 거래할지, 추세 지속 또는 후퇴를 찾을지 알 수 있습니다.
모든 그래픽은 역사적 동적 시장 피보나치 수준을 나타내는 새로운 버퍼를 기반으로 합니다.
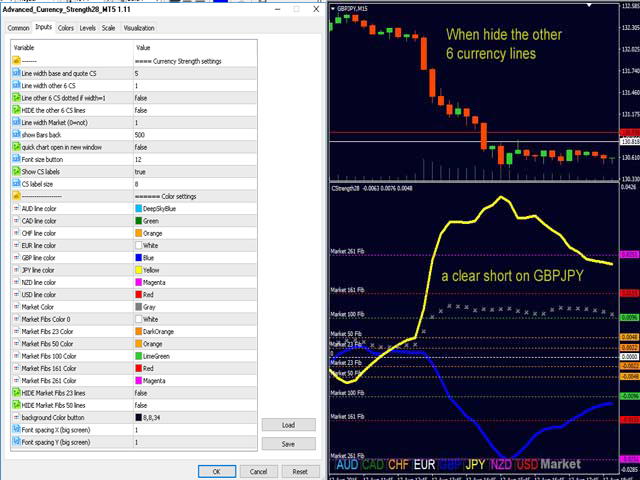
표시기 매개변수
전체 목록을 보려면 여기를 클릭하십시오. https://www.mql5.com/en/blogs/post/697384
=== 차트 설정
=== 알림 설정
=== 경고 설정 CS 크로스
팁
- 내 템플릿을 사용하십시오. 설명서 참조 https://www.mql5.com/en/blogs/post/697384
- 지표를 중단하지 않으려면 "새 창에서 차트 열기"를 사용하십시오.
- 더 높은 시간 프레임의 추세(통화 갭)를 유지하십시오.
- 무역 설정으로 통화 이중 갭을 찾으십시오.
- 특별: MT4 차트 기록을 업데이트하기 위해 7개의 지원 차트가 열립니다(매뉴얼 참조)! 이 기능은 비활성화할 수 있습니다.
- 거래 시스템 및 거래 사례는 프로필에서 내 뉴스와 블로그를 확인하세요.
질문이 있으시면 항상 도와 드리겠습니다.
앞으로도 많은 그린피를 기원합니다.
자동 번역! 영어 원본 여기를 클릭 https://www.mql5.com/en/market/product/22324
you can not believe the author support and guidance i had too many questions and he answered every single of them i will using the indicator for 2 weeks in demo and after that ,if it was good i will go for live , i will update my honest review so you can judge your self , thank you bernhard for your patience and good support
update:
28/3/2024 ive test it in many ways and if you learn the full tutorial and master it you will have good profit , this indicator does everything that author claim and works best with impulse , with cs28 you can understand which pair is good for trade at the moment and impulse shows you if the pair is going to move or not