HarmonicPattern Finder MT5
- Göstergeler
- Sürüm: 6.0

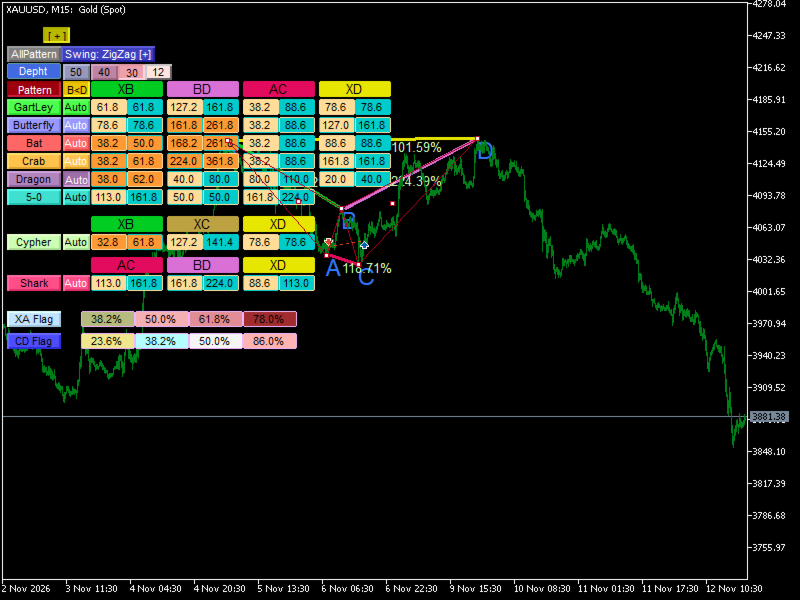
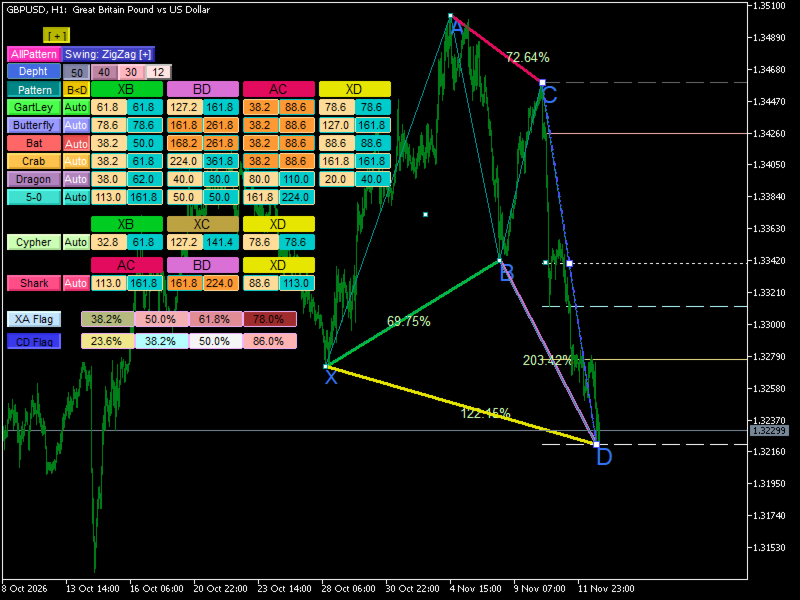
Harmonic Patterns MT5 is an interactive chart-analysis indicator for MetaTrader 5. It helps traders examine XABCD price structures, compare their Fibonacci relationships, and visualize potential harmonic pattern zones directly on the chart.
The indicator combines an on-chart control panel with adjustable swing-detection methods, pattern ratios, Fibonacci levels, and display settings. It is designed to make harmonic analysis more visual and customizable.
Supported Pattern Models
The indicator includes configurable models for:
- Gartley
- Butterfly
- Bat
- Crab
- Cypher
- Shark
- Dragon
- 5-0
Each model has its own ratio settings. You can adjust the available minimum and maximum Fibonacci percentages to adapt the pattern definitions to your preferred analysis.
XABCD Structure and Pattern Ratios
The indicator displays an XABCD structure on the chart and calculates relationships between its points. These relationships can be compared with the configured ranges for the supported pattern models.
Depending on the selected pattern, the adjustable relationships include:
- **XB** — the relationship used to evaluate point B
- **AC** or **XC** — the relationship used to evaluate point C
- **BD** — a relationship used to evaluate the move toward point D
- **XD** — a relationship used to evaluate the position of point D
The available relationships vary by pattern. Pattern colors and ratio ranges can be customized in the indicator inputs.
## Three Swing Detection Methods
Choose the swing-detection method that fits your chart analysis:
1. **ZigZag** — uses configurable depth, deviation, and backstep settings.
2. **Confirmed Pivot** — uses left and right pivot settings and a minimum price movement.
3. **Polynomial Peaks** — uses configurable polynomial parameters to identify swing points.
The method can also be selected from the indicator’s on-chart menu. Different swing settings may produce different XABCD structures, especially when market conditions or timeframes change.
## Potential Reversal and Pattern Zones
The indicator can display colored zones associated with selected harmonic models. These areas help visualize the configured relationships for pattern points and, where applicable, the **Potential Reversal Zone (PRZ)**.
Use these zones as areas for further analysis. A displayed zone does not guarantee that a pattern will complete or that the market will reverse.
## Interactive On-Chart Panel
The control panel gives you access to pattern and display tools directly from the chart.
Depending on the selected control, you can:
- Show or hide the pattern display.
- Select a harmonic model and display its associated zones.
- Use the **Auto** control associated with a pattern.
- Switch between swing-detection methods.
- Select from four configured depth values.
- Access pattern ratio fields and other chart controls.
- Show or hide the panel.
The panel also includes controls for XA and CD flags and a **B<D** option for the pattern structure.
## Fibonacci Levels
Display configurable Fibonacci levels for the **XA** and **CD** legs. Each group includes four editable percentage levels, with individual color settings.
Default levels include:
- **XA:** 38.2%, 50%, 61.8%, and 78%
- **CD:** 23.6%, 38.2%, 50%, and 86%
You can enable or disable the XA and CD Fibonacci displays separately and adjust text sizes and colors to suit your chart.
## Main Input Settings
### Swing Detection
- **Depth 1–4:** Four configurable depth values for swing analysis.
- **Deviation and Backstep:** Parameters used by the ZigZag method.
- **Swing Detection Method:** ZigZag, Confirmed Pivot, or Polynomial Peaks.
- **Pivot Left / Pivot Right:** Settings for the confirmed-pivot method.
- **Minimum Move Points:** Minimum price movement used in swing detection.
- **Polynomial Radius, Degree, and Root Radius:** Parameters for the polynomial method.
### Pattern Ratios
Each supported model provides configurable Fibonacci ratio ranges relevant to that pattern. Pattern colors can also be changed.
### Fibonacci Levels
Configure XA and CD percentage levels and their display colors.
### Interface and Chart Appearance
Adjust the panel position, interface scale, font sizes, text colors, pattern colors, and other chart-display options. An automatic price-adjustment option is also available.
### Display Options
Enable or disable the pattern display and the XA and CD Fibonacci displays.
## Getting Started
1. Install the indicator in MetaTrader 5 and attach it to a chart.
2. Select the symbol and timeframe you want to analyze.
3. Choose a swing-detection method and adjust its settings if needed.
4. Open the on-chart panel and enable the pattern display.
5. Select a harmonic model to examine its configured ratio zones.
6. Adjust the pattern ratios or Fibonacci levels to match your analysis.
7. Review the structure in the context of the broader market before making a trading decision.
## Important Notes
- This is a **chart-analysis indicator**. It does not place trades automatically.
- Displayed structures and zones depend on the selected method, input settings, available price data, and current market conditions.
- Recent swing points and developing structures can change as new price information becomes available.
- Harmonic patterns and Fibonacci zones do not guarantee future price movement. Always apply your own confirmation and risk-management rules.