Sohrabi Fvg Btb Bo Mtf
- Göstergeler
- Sürüm: 1.0
- Etkinleştirmeler: 5

SOHRABI FVG BTB BO MT4
Bring chart-timeframe and higher-timeframe price zones together in one view.
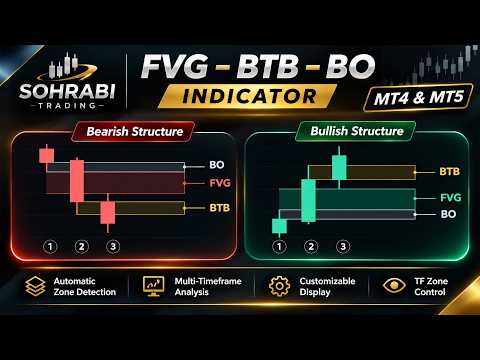
SOHRABI FVG BTB BO MT4 automatically identifies and displays FVG, BTB and BO zones using defined candle-based rules. It helps you review historical formations, follow active zones and compare your current chart with a selected higher timeframe.
Zone formation is confirmed using closed candles. After confirmation, price touches and full coverage update each zone’s displayed status.
Three Zone Types
-
FVG — Fair Value Gap: Displays bullish and bearish gaps within a three-candle formation.
-
BO — Breakout Zone: Under the indicator’s formation rules, bullish BO zones cover the area from the first candle’s close to its high; bearish BO zones cover the area from its low to its close.
-
BTB: Under the indicator’s formation rules, confirmation occurs when candle 3 closes above candle 2’s high for a bullish setup, or below candle 2’s low for a bearish setup. If candle 3 does not confirm, candle 4 has one final opportunity.
Multi-Timeframe Display
Display a higher “mother” timeframe alongside your chart timeframe. Separate buy/sell colors, text colors and a dedicated right-side extension help distinguish mother zones from chart zones.
This MT4 edition uses native timeframe history only:
M1, M5, M15, M30, H1, H4, D1, W1 and MN1.
No synthetic candles are generated. The on-chart timeframe selector lists only timeframes higher than the current chart.
Four On-Chart Controls
-
EXTEND: Toggle the extension of active zones.
-
MOTHER: Show or hide higher-timeframe zones.
-
TF: Select the mother timeframe directly on the chart.
-
CHART: Show or hide current-chart zones independently.
History and Customization
Scan a configurable number of historical candles. Keep covered zones visible with a faded appearance, and display mother-zone status labels such as UNTESTED, TESTED and COVERED. A wick touch can mark a zone as tested; tested does not necessarily mean fully covered.
Customize zone visibility, bullish/bearish display, colors, labels, fill intensity and display limits.
For example, use an H1 chart with H4 mother zones, then hide the H1 zones to focus on the higher-timeframe context.
This is a visual analysis indicator. It does not place trades or provide automated entry signals. Historical coverage depends on the data available in your MT4 terminal.
Created by Mohammadreza Sohrabi.