Chart Alert MT5

Never Miss an Important Price Interaction

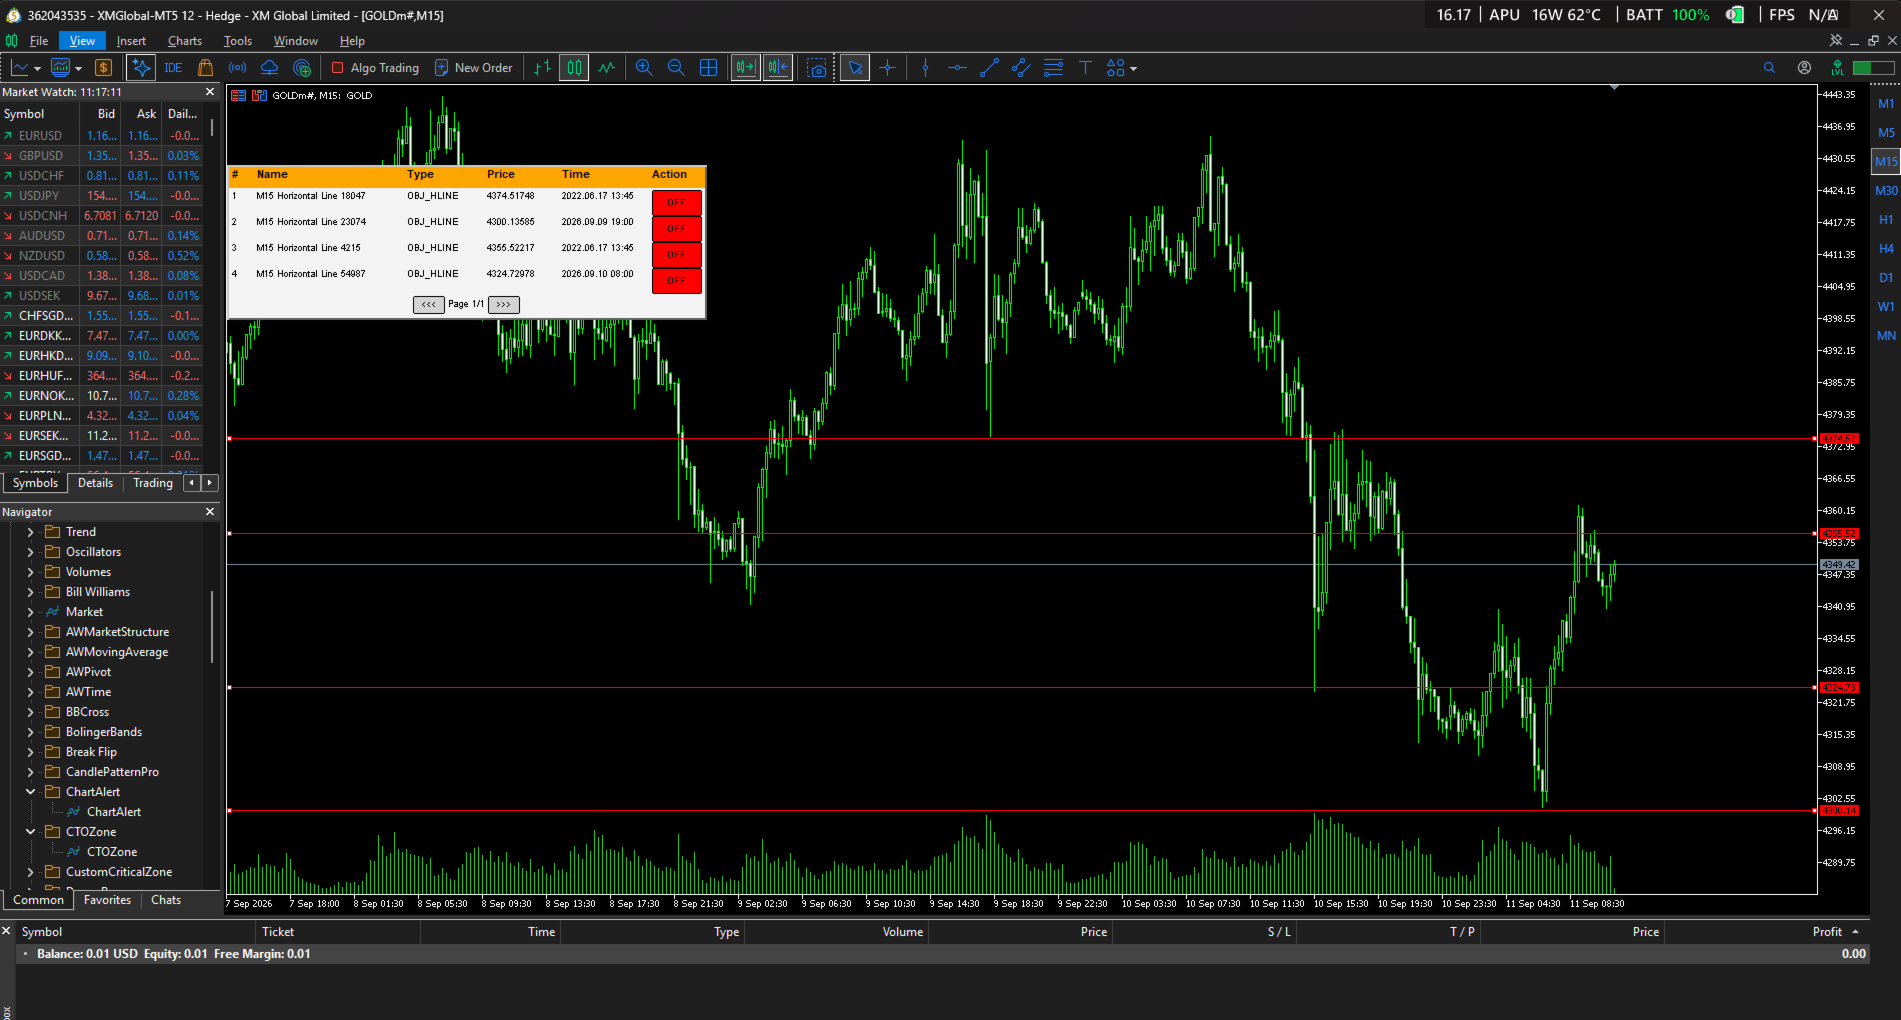
Have you ever drawn your market analysis on a chart, only to miss an important moment when price approaches or touches your trendline, support/resistance level, zone, or other important chart object?

ChartAlert is designed to solve this problem.

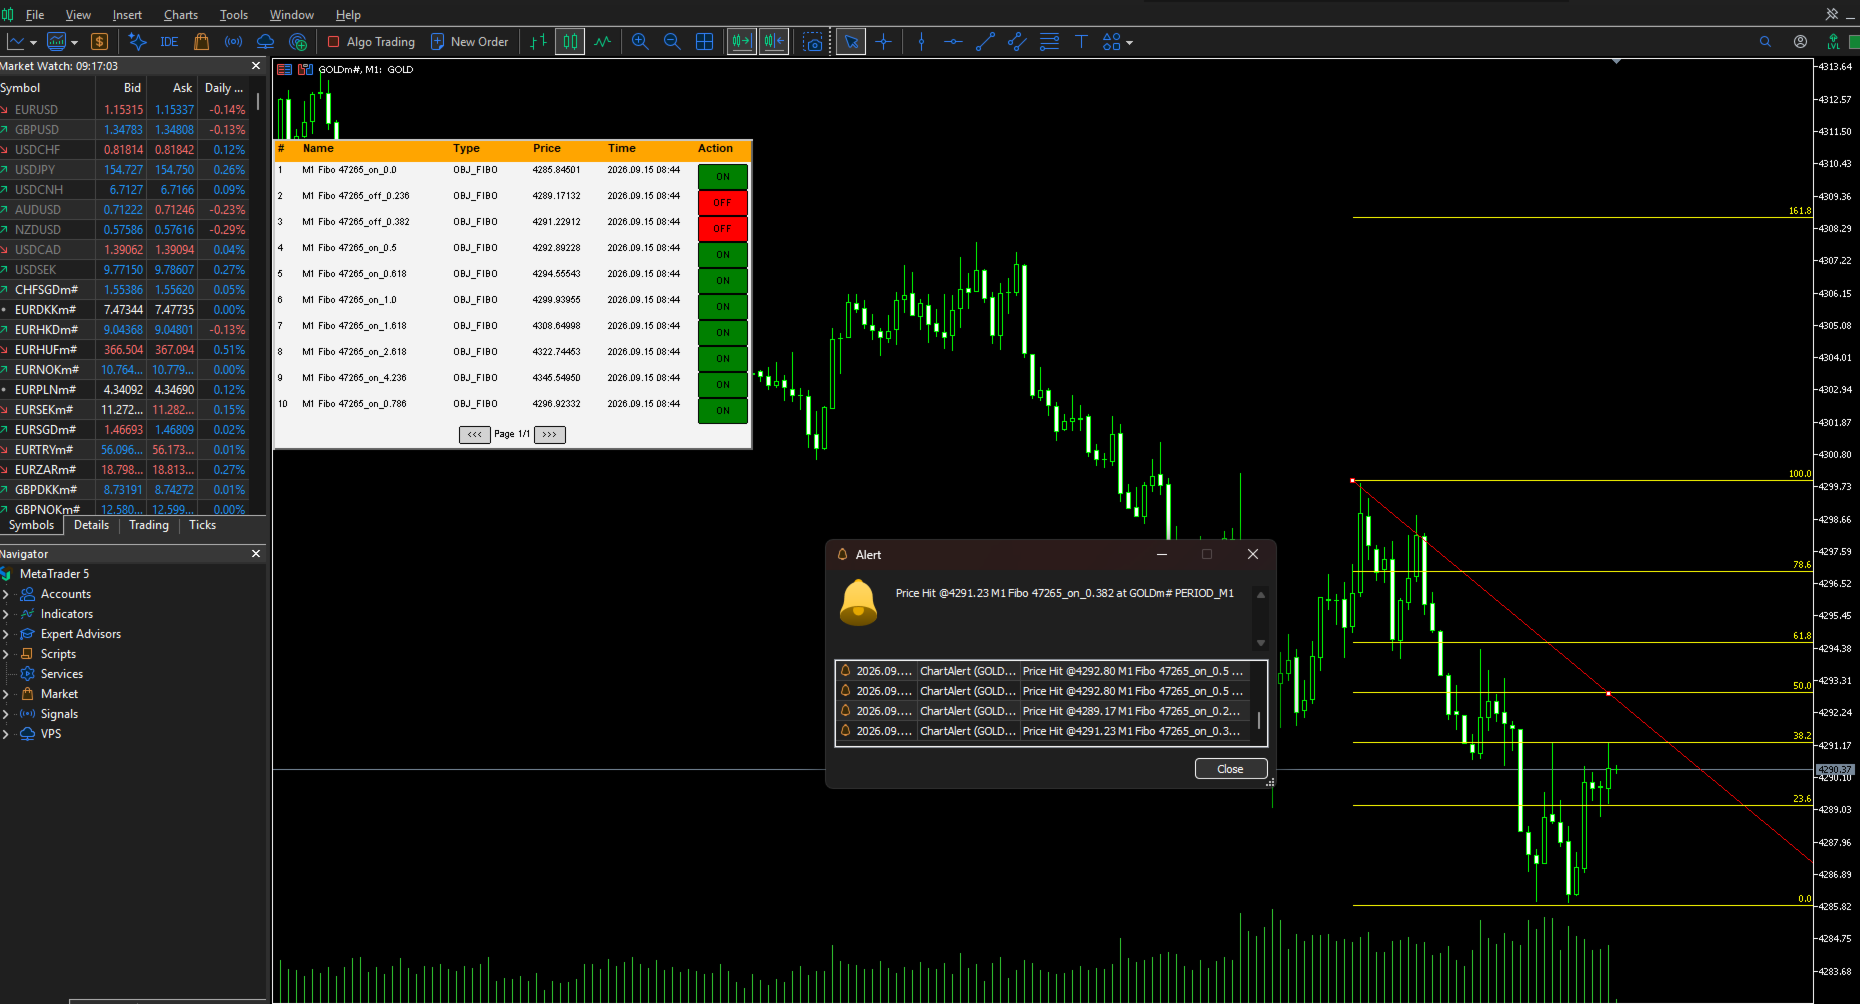
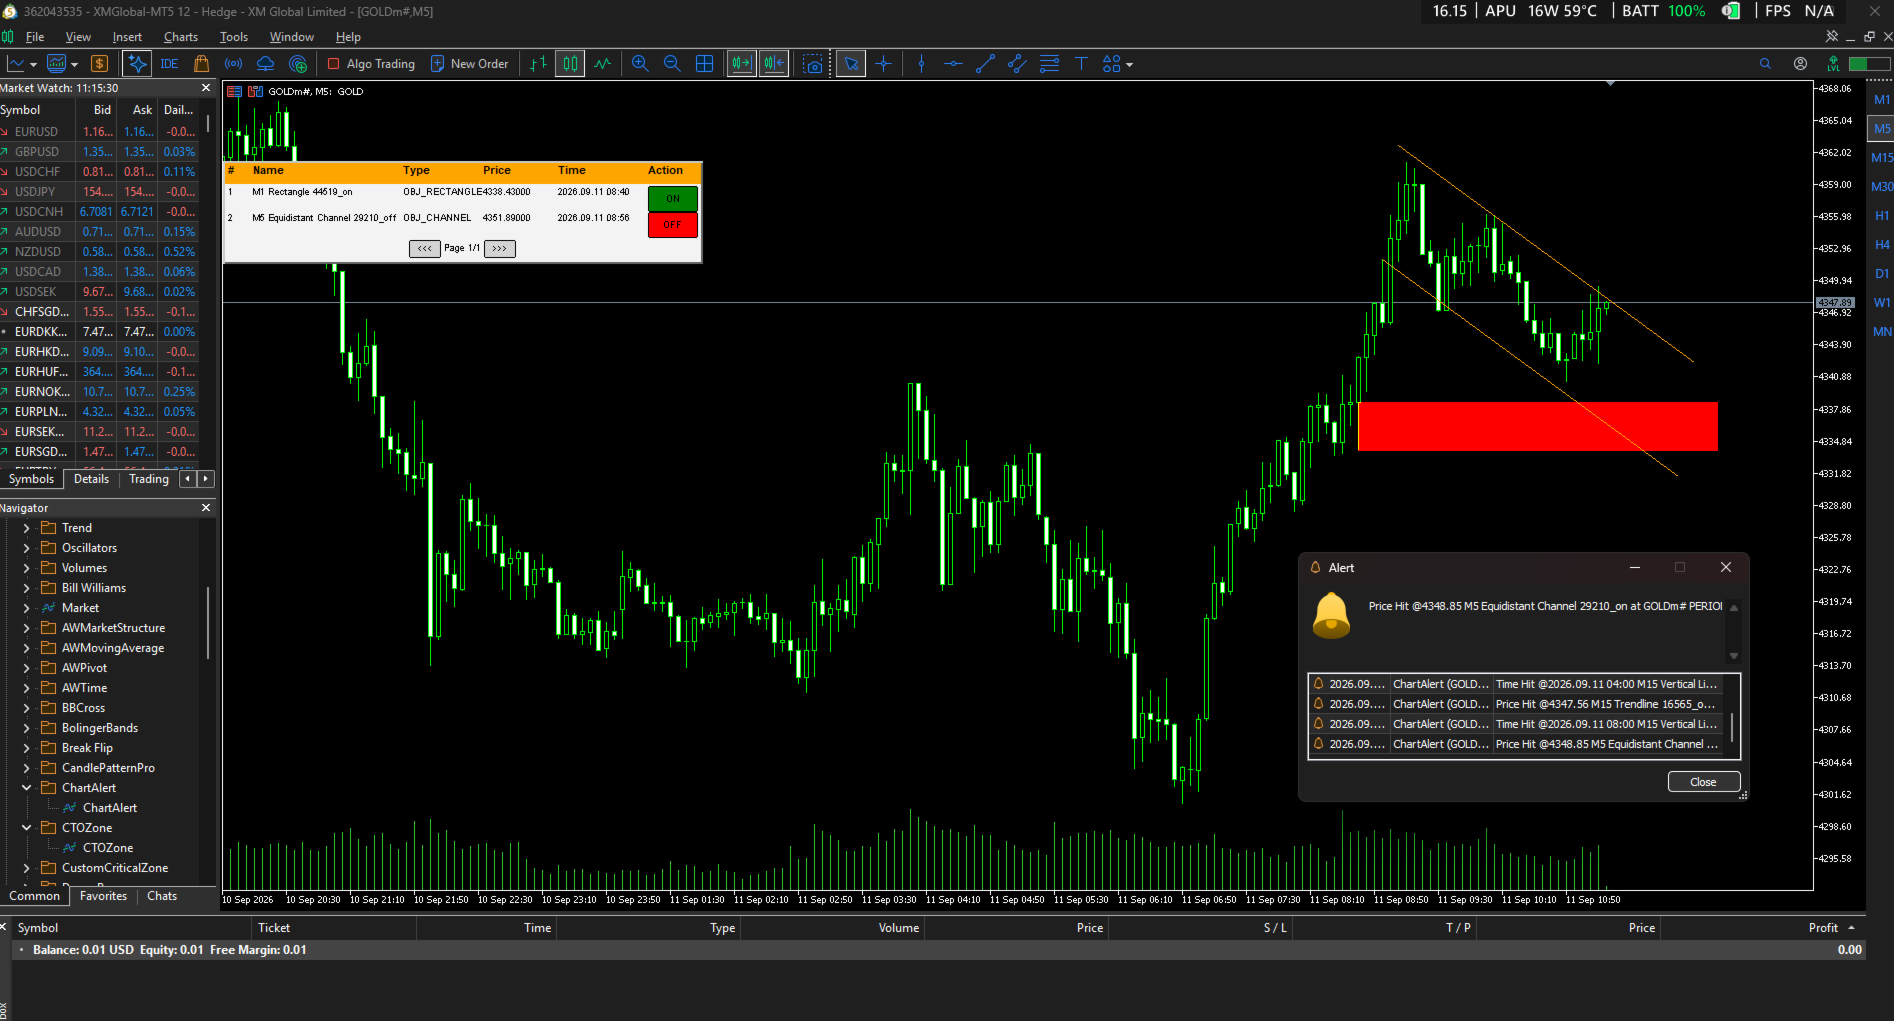
ChartAlert automatically detects the objects on your chart and allows you to choose which objects you want to monitor.

Simply perform your analysis and draw on the chart as usual. Select the objects you want ChartAlert to watch, and the indicator will monitor them for you.

When the price touches a monitored object, ChartAlert will immediately notify you.

This allows you to focus on other charts, instruments, or activities without constantly watching the screen.

Notifications

ChartAlert supports:

  • MetaTrader Alert
  • MetaTrader Mobile Push Notification

Key Features

  • Easy-to-Use UI
  • Automatic Object Detection
  • Selective Object Monitoring
  • Price Touch Detection
  • Multiple Object Monitoring
  • MetaTrader Alerts
  • Mobile Push Notifications
  • Works With Your Existing Analysis
  • No Need to Create Alerts One by One

Your Analysis. Your Drawings. Your Alerts.

Draw it. Select it. ChartAlert watches it.

Önerilen ürünler
Dragon Bands Z
Andres Felipe Carvajal Rodriguez
Dragon Bands Z: Görsel Trend Analizi Göstergesi Dragon Bands Z, birden fazla teknik kaynağın görsel olarak birleştirilmesiyle grafik okumasını basitleştirmek için tasarlanmış bir göstergedir. Amacı, çok sayıda tekil göstergeyle dolu grafiklere ihtiyaç duymadan piyasa yönü ve gücü hakkında net bir gösterge sağlamaktır. Gösterge, fiyat hareketini dört ana görsel duruma çevirmek için hibrit bir renk dolgusu kullanır: Yeşil: Baskın bir yükseliş yönlü gücü gösterir. Kırmızı: Baskın bir düşüş yönlü gü
Overview The RSI Scanner Dashboard is a comprehensive technical analysis utility and multi-symbol, multi-timeframe monitoring indicator designed for the MetaTrader terminal. The primary objective of this tool is to scan market instruments continuously to identify specific Relative Strength Index (RSI) crossover conditions based on defined overbought and oversold thresholds. By aggregating data across user-defined currency pairs and timeframes into a single graphical user interface (GUI), this d
Points of control
Martin Slacka
5 (1)
The POC_Levels indicator calculates and displays the 3 most frequently occurring price levels (Points of Control – POC) based on historical candles. It is useful for identifying areas of high market interest (like support/resistance zones) across any timeframe. How It Works The indicator analyzes the last LookbackBars candles. It counts how many times each price level (based on the selected price type) appears. Then it selects the top 3 most frequent prices and draws horizontal lines at those l
FREE
Ana Kılavuz: Tam Sürüm Aura HHLL   Platinum  V2.00 Entegre Kılavuz Bu program, yatırımcıların "piyasanın şu anda hangi durumda olduğunu" belirlemelerine yardımcı olan bir araçtır. Grafiklerin karmaşık hareketleri arasında en hızlı şekilde hareket etmeyi sağlar. Fiyat hareketinin hassasiyetini aralık ticaretinin sezgiselliğiyle birleştiren teknik analizin doruk noktasıdır. BÖLÜM 01 Gösterge   Temel Bileşenler   Öğeler Piyasanın yapısını okuma yeteneği sağlar. 1. Sistemin 3 Temel Ekseni HHLL Et
Fixed Volume Profile
Carlos Pascual Perez Maturano
This indicator, titled "Fixed Volume Profile.mq5", is a custom tool for MetaTrader 5 (MQL5) designed to calculate and display a Volume Profile over a user-defined fixed time range. The Volume Profile shows the distribution of trading volume at different price levels during a specific period, helping to identify areas of high activity (such as Points of Control or POCs) and volume-based support/resistance areas. Main Functionality: Interactive Range: The indicator creates two vertical lines on
FREE
Time Dashboard MT5 is a powerful and user-friendly MetaTrader 5 indicator designed to provide real-time time zone and clock information directly on your trading chart. Ideal for forex traders and global market participants, this tool displays server time, local time, and the time difference between them, enhancing your ability to manage trades across different time zones. Key Features : Real-Time Time Display : Shows current server time, local time, and their respective time zones with precise o
FREE
Weis Waves RSJ
JETINVEST
4.64 (11)
Weis Waves RSJ, her fiyat dalgasının hacmini toplar ve birbirini izleyen yükseliş ve düşüş dalgaları için kümülatif hacim histogramı olarak çizer. Böylece her dalganın çabasını (hacim) sonucuyla (fiyat ilerlemesi) karşılaştırabilir ve bir hareketin hacimle desteklendiğini ya da güç kaybettiğini görebilirsiniz. Nasıl okunur Histogramdaki her çubuk, bir fiyat dalgası boyunca işlem gören toplam hacimdir. Trend sağlıklı olduğunda, trend yönündeki dalgalar genellikle düzeltmelerden daha fazla hacim g
FREE
This indicator is based on the ICCI. If a long pattern is detected, the indicator displays a buy arrow. If a short pattern is detected, the indicator displays a sell arrow. Settings CCI Period - default set to (14) Features Works on all currency pairs and timeframes Draws Arrows on chart Colors Line Color Line Width Line Style Arrow Color This tool can help you analyse the market and indicates market entry.
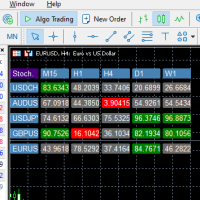
Showing like in the picture or in the logo  multiple pair, multiple timeframes, multiple indicators in the same time , allowing you to click and go straight on that pair. The indicator will change like a Carosello every 3 seconds and will show you the indicator values also by background color to check in a very fast way if its oversold or overbought . Feel free to ask for adding new pair or indicator , i will update it for free. Pair managed: EURUSD, GBPUSD, USDJPY, AUDUSD, USDCHF. Indicator man
The indicator calculates ZigZag using the classic algorithm with three parameters: Depth, Deviation, and Backstep. Its main function is detecting and visualizing repaints — moments when the last ZigZag point shifts to a new bar. Upon loading, the indicator performs a simulation over the specified history depth. The algorithm sequentially recalculates ZigZag for each bar, comparing the current position of the last point with the previous one. If a shift is detected, a repaint line appears on the
FREE
Gann Pulse, MetaTrader 5 için yeniden çizmeyen (repaint yapmayan) bir trend sinyal indikatörüdür. Bar kapandığında net bir AL veya SAT oku gösterir ve hemen giriş fiyatını, Zarar Kes (Stop Loss) seviyesini ve üç Kâr Al (Take Profit) seviyesini çizer. Teori bilmeniz gerekmez: indikatörü grafiğe ekleyin ve sinyalleri takip edin. Fikir W. D. Gann'ın klasik kurallarından ikisi "asla trende karşı işlem yapma" ve "her işlemi mutlaka bir Stop Loss ile koru" kurallarıdır. Gann Pulse ikisini de uygular
MT4 Sürümü: https://www.mql5.com/en/market/product/157433 MT5 Sürümü: https://www.mql5.com/en/market/product/167286 Hacim Dengesizliği, yapılandırılabilir bir geri bakış aralığı içinde yüksek aktiviteli fiyat bölgelerini, yönsel baskıyı ve "boş" fiyat alanlarını belirlemenize yardımcı olmak için tasarlanmış hafif bir Hacim Profili + Delta Dengesizliği görselleştirme aracıdır. Sadece toplam hacmi gösteren klasik hacim profilinin aksine, bu gösterge her fiyat seviyesini şu şekilde ayırır: Boğa
SMART ATR GRID PRO++ – Adaptive Grid Intelligence Suite is a next-generation, institutional-grade grid trading indicator engineered for traders who demand precision, adaptability, and comprehensive market structure analysis. By seamlessly integrating   Adaptive Volatility Grid System ,   KAMA Candle Trend Filtering ,   Multi-Factor Trend Detection (ADX + EMA20/50) ,   Dynamic Heatmap Zone Engine , and   Real-Time Market Regime Classification , this indicator delivers a complete decision-making
Indicator converted from tradingview script by 'everget' "This is a redesign of the Chandelier Exit indicator. It removes stupid transitions between Chandelier Exit' states and highlights initial points for both lines. This indicator was originally developed by Charles Le Beau and popularized by Dr. Alexander Elder in his book "Come Into My Trading Room: A Complete Guide to Trading" (2002). In short, this is a trailing stop-loss based on the Average True Range (ATR) ." Indicator also offers
Piyasa ritmini tamamen kontrol altına alın! OHLC & Sessions Göstergesi, MetaTrader 5 için özel olarak tasarlanmış, en önemli fiyat seviyelerini ve işlem saatlerini tek bakışta görünür hale getiren hassas bir analiz aracıdır. Grafiği karmaşık çizgilerle doldurmak yerine, bu gösterge günlük fiyat hareketlerini ve küresel işlem seanslarını temiz ve son derece profesyonel bir şekilde görselleştirir. Neden Bu Gösterge? Gerçek Zamanlı Hassasiyet: Günlük en yüksek (High) ve en düşük (Low) seviyeleri il
FREE
Chart Replay Indicator MT5 Overview Chart Replay Indicator is a chart replay and training tool for MetaTrader that allows users to replay historical market data bar by bar directly on the chart. It is designed for manual backtesting, strategy training, and market behavior analysis without relying on future price information. Candles are displayed progressively to reproduce the flow of historical data. This indicator does not provide trading signals and does not execute or manage trades. Key Feat
️ Candle Timer Advanced Suite for MetaTrader 5 Gain the ultimate edge in precision timing with the Candle Timer Advanced Suite. This is not just a simple countdown; it is a professional-grade analytical tool designed to keep you perfectly synchronized with the market, ensuring you never miss a critical entry or exit due to server lag or misinterpretation. Built specifically for MetaTrader 5, this suite offers unparalleled flexibility, allowing you to visualize time exactly how you need it, acr
Mean Reversion Supply Demand Indicator Mean Reversion Supply Demand is the indicator to detect the important supply demand zone in your chart. The concept of supply demand trading relies on the quantity mismatching between buying and selling volumes in the financial market. Typically, supply demand zone serves to predict the turning point. The wave pattern, for any supply demand zone to work as an successful trade, looks like the price must touch the base zone, move away and then return to zone
EmasFijas
Isaias Villalobos Arias
EmasFijas Multi-Timeframe EMA Indicator for MetaTrader 5 Product Description English: EmasFijas displays EMAs (Exponential Moving Averages) from any timeframe on your current chart. Perfect for multi-timeframe analysis without switching charts. Features an intuitive visual dropdown panel to quickly select any of the 21 available MT5 timeframes. Español: EmasFijas muestra EMAs (Medias Móviles Exponenciales) de cualquier temporalidad en tu gráfico actual. Perfecto para análisis multi-temporalidad
Introduction This indicator detects volume spread patterns for buy and sell opportunity. The patterns include demand and supply patterns. You might use each pattern for trading. However, these patterns are best used to detect the demand zone (=accumulation area) and supply zone (=distribution area). Demand pattern indicates generally potential buying opportunity. Supply pattern indicates generally potential selling opportunity. These are the underlying patterns rather than direct price action. T
Product Name: Fair Value Channel Consolidation Breakout THE MACHINE LEARNING HAVE BEEN DESACTIVATED FOR A EASY TEST!!( OBS: IF THE CLIENT WANT IT WE CAN INTEGRATE IT EASILY) ATTENTION !!!! THE RIGHT INPUTS TO USE IN XAU/USD  CAN BE VIZUALIZED IN THE SCREENSHOTS, IF THE INPUTS ARE NOT USED THE RESULT CAN DIFFERS! TAKE PROFIT , SELL LOSS AND TRAILLING STOP CAN BE CHANGED IF YOU DESIRE Stop trading the past. Start trading the true Fair Value. Fair Value Channel Consolidation Breakout  is not just
Crypto Position Size Calculator - a free position size calculator built for cryptocurrency traders. Enter your account balance, risk percentage, entry and stop-loss prices, and instantly get the exact position size for BTC, ETH and any other crypto symbol your broker offers. Crypto prices move fast and vary wildly between coins, so a fixed position size can mean wildly different risk from one trade to the next. This calculator measures the distance to your stop in the coin's own price and conver
FREE
ENGLISH VERSION (for MQL5 Market) Product Description: RSI Trend & Volatility Dashboard (Multi-Timeframe Filter) This professional dashboard provides traders with an ultimate market overview inside a single chart. It continuously monitors the trend direction across 5 timeframes simultaneously: M5, M15, M30, H1, and D1 [MQL5]. No more tedious chart switching or multi-window clutter – see everything from quick scalping moves to global institutional daily trends in real-time [MQL5]. Key Adva
Master Edition, piyasa yapısını hacim ve para akışı merceğinden görselleştirmek için tasarlanmış profesyonel kalitede bir analiz aracıdır. Standart hacim göstergelerinin aksine, bu araç doğrudan grafiğinizde bir Günlük Hacim Profili görüntüleyerek, fiyat keşfinin tam olarak nerede gerçekleştiğini ve "akıllı paranın" nerede konumlandığını görmenizi sağlar. Bu Master Edition, netlik ve hız için tasarlanmıştır ve yüklendiğinde grafik düzeninizi anında güzelleştiren benzersiz bir Otomatik Tema Senkr
VPEO Volume Statistics VPEO Volume Statistics is a customizable volume-analysis indicator for MetaTrader 5. VPEO stands for Volume Pressure and Efficiency Oscillator. The indicator combines directional volume pressure, a statistical analysis of rising or falling market participation, volume-efficiency conditions, optional BUY and SELL markers, and a compact dashboard in one interface. The indicator is designed to answer three separate questions: Is current volume pressure mainly positive or nega
FREE
Graphic Alignment Context
Ricardo Alexandre Laurentino
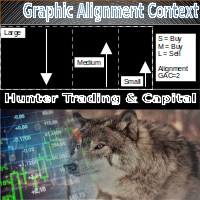
The Graphic Alignment Context (GAC) Technical Indicator measures the vertical difference of the simple average price of a financial instrument in the context of three different timeframes determined by a defined number of bars or candles (periods) to determine the strength of the buy or sell trend. sale. Ascending average prices indicate Buying strength (1), Descending average prices indicate Selling strength (-1) and any scenario different from the previous two conditions indicates Neutrality
FREE
Order Book Heatmap B3 PRO: MetaTrader 5'te B3 vadeli işlemleri ve hisseleri için görsel emir defteri ve canlı likidite ısı haritası; büyük lotlar, çekilen lotlar ve güçlü dengesizlik için uyarılarla. NELER GÖSTERİR Aracı kurumunuzun gönderdiği tüm canlı seviyeler (taraf başına 64'e kadar), grafiğin sağ tarafına çizilir ve fiyat ölçeğine hizalanır. Genişletilmiş defter: canlı derinliğin ötesinde daha önce görülen seviyeler, görülen son miktarla birlikte soluk olarak defterde kalır. 120 dakika son
SIMBA MARKET FORECAST MACHINE Stop Chasing BUY/SELL Signals. Start Forecasting the Market. You probably already have enough indicators. RSI. MACD. Moving averages. Stochastic. Trend indicators. Buy arrows. Sell arrows. The problem is not finding another indicator. The problem is understanding what the market is actually doing . A normal indicator may tell you: BUY But what happens next? Where is price likely to go? How strong is the setup? What market regime are you in? What could invalidate the
Weis Wave Double Side
Eduardo Da Costa Custodio Santos
MT5 için Weis Wave Bouble Yan Göstergesi, araç setinin bir parçasıdır (Wyckoff Academy Wave Market) MT5 için Weis Wave Bouble yan Göstergesi, David Weis tarafından oluşturulan halihazırda kurulmuş Weis Wave'e dayalı olarak oluşturulmuştur. Weis Wave Çift Taraflı göstergesi, piyasayı olduğu gibi dalgalar halinde okur 1900 yılında R. Wyckoff tarafından. Çaba x sonuç, neden ve sonuç ve arz ve talebi belirlemeye yardımcı olur. Diferansiyeli, sıfır ekseninin altında kullanılabilmesi ve daha da iyileş
THREE LAYERS OF SMC MARKUP IN ONE TOOL Liquidity pools, order blocks and a volume profile — the Smart Money markup that traders usually assemble from three separate indicators. SMC Liquidity OB Profile draws all of it in one tool, with a single block of input parameters and one visual language. Why not just stack three free SMC overlays? Because three overlays means three settings lists, three visual styles and triple the load on your chart. Here everything is computed in a single lightweight
Bu ürünün alıcıları ayrıca şunları da satın alıyor
Trend Sniper X
Sarvarbek Abduvoxobov
4.86 (43)
Trend Sniper X , tüccarların trend yönünü ve olası dönüş noktalarını netlik ve hassasiyetle belirlemelerine yardımcı olan MetaTrader 5 için çoklu zaman dilimli bir trend takip göstergesidir. MT4 için: https://www.mql5.com/en/market/product/193245 Fiyat Bilgisi: Mevcut fiyat tanıtım amaçlıdır ve gelecek güncellemeler ile yeni özellikler yayınlandıkça değişebilir. Bonus Fırsatı: Bu indikatör için ÜCRETSİZ Oto-Trade Assistant EA'yı almak için lütfen satın aldıktan sonra yazara mesaj gönderin. Code
Smart Trend Trading System — MetaTrader 5 Satın aldıktan sonra Smart Universal Expert Advisor'ı ÜCRETSİZ edinmek ve beraberinde çevrimiçi kurs, PDF kılavuzu ve özel gruba erişim almak için MQL5 üzerinden bana mesaj gönderin. STTS; trend yönünü, giriş ve çıkış sinyallerini, dönüş bölgelerini ve önemli fiyat seviyelerini doğrudan grafiğinizde bir araya getirir. Sistemi manuel işlemler için kullanabilir veya ayrı bir uyumlu EA’yı bağlayarak seçtiğiniz ayarlarla otomatik işlem gerçekleştirebilirsini
Şehre yeni bir Kral geldi - Gösterge + Emir Yönetimi göstergeleri (TP1 + TP2 + TP3) + Opsiyonel Telegram Sinyal Gönderici DAHİL (ÜCRETSİZ) (TAM TRADING ve SİNYAL SİSTEMİ) Altın için en iyi EA’mız: Gold Slayer Bu gösterge; gelişmiş bir strateji, özelleştirilebilir emir yönetimine sahip bir trading sistemi ve envelope uzantılarını birleştiren bir mean reversion sistemi içerir. Ayrıca RSI gibi birçok akıllı onay filtresiyle desteklenerek yüksek olasılıklı dönüş girişlerini AL ve SAT sinyalleriyle y
Zoryk Gold
Reda El Koutbane
4.78 (18)
ZORYK — MetaTrader 5 İçin Gelişmiş XAUUSD Sinyal Sistemi Bu hissi biliyorsunuz. Altını analiz etmek için uzun zaman harcarsınız. Doğru giriş noktasını beklersiniz. Sonunda işlemi açarsınız ve fiyat hemen aleyhinize hareket etmeye başlar. İşlemi çok erken kapatırsınız, Stop Loss seviyesini değiştirirsiniz veya birkaç saniye tereddüt edersiniz. Daha sonra piyasa, başlangıçta beklediğiniz hedefe tam olarak ulaşır; ancak siz artık işlemin içinde değilsinizdir. Sorun her zaman yön değildi. Asıl sorun
İşlem avantajınızı görüş alanınıza alın! M5 Sniper , MeanFX tarafından geliştirilen yeni bir indikatördür. Hassas işlem sinyallerini adaptif TP/SL seviyeleriyle birleştirir — bunun sonucunda mümkün olan en iyi istatistiksel işlemleri oluşturur! Fiyat her 5 satın alımda bir artar, bir sonraki fiyat 69$ olacaktır. Satın aldıktan sonra ipuçları/rehber ve bonus EA almak için bana mesaj gönderin. Onu öne çıkaran nedir? Kanıtlanmış istatistiksel performans Gold XAUUSD üzerinde ( neredeyse her varlıkta
SuperScalp Pro
Van Minh Nguyen
4.54 (37)
SuperScalp Pro - Professional Multi-Layer Confluence Scalping System SuperScalp Pro, klasik Supertrend sistemini birden fazla akıllı doğrulama filtresiyle geliştiren ileri düzey bir scalping göstergesidir. Yanlış sinyalleri önemli ölçüde azaltırken başarı olasılığı daha yüksek Buy/Sell işlem fırsatlarını belirlemenize yardımcı olur. Buy ve Sell okları doğrudan grafik üzerinde net bir şekilde görüntülenir. ATR tabanlı Stop Loss ve Take Profit seviyeleri de gerçek zamanlı olarak otomatik hesaplanı
2019'da bu indikatörün neler yapabildiğini tüm dünyaya gösterdim. Sinyallerine göre elle, gerçek hesapta ve herkesin gözü önünde işlem yaptım — hesap Myfxbook'ta izleniyordu ve bu deneyi Facebook'ta ayrıntılı olarak paylaştım. Sonuç: 10.000 dolar dört ayda 941.411 dolara dönüştü. Risk bilinçli olarak aşırıydı — drawdown %54'e kadar çıktı, çünkü mesleğimizde kâr ve risk her zaman el ele gider. Myfxbook ekran görüntüsü galerideki ilk resimdir. Görünen o ki sizi tebrik edebilirim: arayışınız sona e
ULTRA, “hepsi bir arada” prensibiyle çalışan bir teknik göstergedir; piyasayı bağımsız olarak analiz eder, işlem sinyalleri üretir, stop-loss emirlerinin verileceği seviyeleri gösterir ve kârı garantilemek ya da zararı en aza indirmek için işlemlerin ne zaman kapatılması gerektiğini önerir. Başka bir deyişle, piyasayı nasıl analiz edeceğinizi bilmeseniz, seviyeleri (stop-loss'unuzu nereye koyacağınızı) belirleyemeseniz ya da para yönetimi konusunda zorluk yaşasanız da fark etmez. ULTRA tüm bunla
SMC Intraday Formula
VividMind Digital Solutions
5 (26)
Önce dürüst olalım. Hiçbir gösterge tek başına sizi kârlı yapmaz. Eğer biri size aksini söylüyorsa, size bir hayal satıyordur. Mükemmel al/sat okları gösteren her gösterge, kusursuzmuş gibi görünecek şekilde yapılabilir — sadece geçmişin doğru bir bölümünü yakınlaştırıp kazanan işlemleri ekran görüntüsü almanız yeterlidir. Biz bunu yapmıyoruz.  SMC Intraday Formula bir araçtır. Piyasa yapısını sizin için okur, en yüksek olasılıklı fiyat bölgelerini belirler ve şu anda akıllı paranın izinin nası
Gann Made Easy , bay teorisini kullanarak ticaretin en iyi ilkelerine dayanan, profesyonel ve kullanımı kolay bir Forex ticaret sistemidir. WD Gann. Gösterge, Zararı Durdur ve Kâr Al Seviyeleri dahil olmak üzere doğru SATIN AL ve SAT sinyalleri sağlar. PUSH bildirimlerini kullanarak hareket halindeyken bile işlem yapabilirsiniz. Satın alma işleminden sonra, alım satım talimatlarını ve harika ek göstergeleri ücretsiz olarak almak için lütfen benimle iletişime geçin! Muhtemelen Gann ticaret yöntem
GoldenX Entry MT5
VividMind Digital Solutions
5 (17)
GoldenX Entry, adaptif Smart Entry Trend algoritmasına, sinyal skorlaması sistemine, piyasa rejimi algılayıcısına ve volatilite filtresine sahip bir MT5 indikatörüdür. Her sinyal; hesaplanmış bir giriş seviyesi, üç adet Take-Profit seviyesi (TP1, TP2, TP3) ve bir Stop-Loss seviyesi içerir. Farklı piyasa koşullarına uyum sağlamak için tasarlanmış çok katmanlı analitik yapı üzerine kuruludur ve yerleşik optimizasyon aracı ile istatistik takip sistemini birleştirir. Risk-ödül (RR) metrikleri ve geç
M1 Sniper MT5
Oleg Rodin
5 (7)
M1 SNIPER   kullanımı kolay bir işlem göstergesi sistemidir. M1 zaman dilimi için tasarlanmış bir ok göstergesidir. Gösterge, M1 zaman diliminde scalping için bağımsız bir sistem olarak kullanılabilir ve mevcut işlem sisteminizin bir parçası olarak kullanılabilir. Bu işlem sistemi özellikle M1'de işlem yapmak için tasarlanmış olsa da, diğer zaman dilimleriyle de kullanılabilir. Başlangıçta bu yöntemi XAUUSD ve BTCUSD ticareti için tasarladım. Ancak bu yöntemi diğer piyasalarda işlem yaparken de
Auto Optimized SpeedAngle , sürekli İleriye Dönük Optimizasyon (Walk-Forward Optimization, WFO) yoluyla eğri uydurmayı (curve-fitting) ortadan kaldıran kurumsal düzeyde bir momentum vektörleme sistemidir. Piyasa rejimleri değiştiğinde etkinliğini yitiren statik girdilere güvenmek yerine, gösterge, örneklem dışı (Out-of-Sample, OOS) doğrulama kullanarak parametrelerini dinamik olarak yeniden kalibre eder ve böylece gösterilen sinyallerin geçmişteki rastgele anomalileri değil, gerçek bir istatisti
Gold Trend Coach MT5
Cristhian Alexander Gaibor Cuasquer
5 (3)
Gold Trend Coach, MetaTrader 5 için alış ve satış sinyalleri, stop loss ve üç take profit hedefi mum kapanışında onaylanan, çoklu zaman dilimi koç paneli ve telefonunuza ve Telegram'a uyarılar sunan bir altın (XAUUSD) trend göstergesidir. Londra ve New York seanslarında M5 scalping ve M15 gün içi işlemler için tasarlandı. Gold Trend Coach: giriş, stop ve üç hedefli XAUUSD altın trend sinyalleri. İlk 20 kopya için lansman fiyatı $39, sonra $59. Satın aldıktan sonra bana yazın, alıcı kitiniz heme
Sonraki Güncelleme — Sürüm 2.52 Çok Yakında! [YENİ] Piyasa Analizinizi ve İşlem Sürecinizi Geliştirmek İçin Tasarlanmış 4 Büyük Yeni Özelliğe Hazır Olun İşlem ihtiyaçlarınızı karşılamak üzere tasarlanmış 4 yeni özellikle piyasa analizini bir üst seviyeye taşıyoruz. İşte yeni özellikler: 1. TRADE OVERVIEW DASHBOARD 2. CONFLUENCE AT ZONE 3. STRONG & WEAK HIGH/LOW 4. OTE 1. TRADE OVERVIEW DASHBOARD Piyasanın genel görünümünü daha kolay anlamanıza yardımcı olan, işlem kararlarınızı desteklemek için
Atomic Analyst MT5
Issam Kassas
4.5 (64)
Atomic Analyst — MetaTrader 5 Satın aldıktan sonra Smart Universal Expert Advisor'ı ÜCRETSİZ edinmek ve beraberinde çevrimiçi kurs, PDF kılavuzu ve özel gruba erişim almak için MQL5 üzerinden bana mesaj gönderin. Atomic Analyst; fiyat hareketini, trend yönünü, giriş ve çıkış sinyallerini, Stop Loss ve birden fazla Take Profit seviyesini doğrudan grafiğinizde bir araya getirir. SİNYALİ GÖRÜN. İŞLEM KOŞULLARINI ANLAYIN. Atomic Analyst, analizini anlaşılır görsel bilgiler halinde sunar: • Olası gir
Boba Analysis Suite
Trade Ready Solutions LLC
5 (2)
Boba Analysis Suite Boba Analysis Suite, MetaTrader 5 için geliştirilmiş bir analiz göstergesidir. Piyasa yapısını, önemli fiyat bölgelerini ve genel piyasa bağlamını tek bir grafik görünümünde bir araya getirir. Trader ve trading eğitmeni olarak edinilen uygulamalı deneyimden yola çıkarak geliştirilmiştir. Piyasanın yönünü değerlendirme, önemli seviyeleri belirleme ve birden fazla zaman dilimini birlikte inceleme gibi adımlardan oluşan sistematik bir analiz sürecini destekler. Piyasa Bağlamını
Azimuth Pro
Ottaviano De Cicco
5 (7)
Azimuth Pro V2: Synthetic Fractal Structure and Confirmed Entries for MT5 Overview Azimuth Pro is a multi-level swing structure indicator by Merkava Labs . Four nested swing layers, swing-anchored VWAP, ABC pattern detection, three-timeframe structural filtering, and closed-bar confirmed entries — one chart, one workflow from micro-swings to macro-cycles. This is not a blind signal product. It is a structure-first workflow for traders who care about location, context, and timing. Halloween P
Zain Gold Scalping
Ahmed Gamal Abdel Nasser Mohamed
A complete price-action analysis tool built around dual independent entry logic, each confirmed against a volatility band, combined with a configurable set of nine optional confirmation filters that let you shape exactly how conservative or aggressive the tool's signals behave. Core Strategy Two independent entry setups, each triggering only when price moves outside a dynamic volatility band — giving two distinct ways to spot potential reversal points, which can be used together or separately.
FiboSniper Pro
Van Minh Nguyen
5 (4)
FiboSniper Pro – Multi-Filter Fibonacci System with Auto SL/TP and Control Panel FiboSniper Pro, seçilmiş Buy ve Sell sinyalleri üretmek için dinamik Fibonacci Envelopes ile birden fazla doğrulama filtresini birleştiren teknik bir göstergedir. Fibonacci seviyeleri Moving Average ve ATR temel alınarak hesaplanır ve ardından ADX, EMA, RSI, ATR, Volume, Time ve Candle yapısı ile filtrelenir. Gösterge, ATR tabanlı otomatik Stop Loss ve Take Profit seviyelerini doğrudan grafik üzerinde görüntüler ve
Power Candles MT5
Daniel Stein
4.58 (12)
Power Candles V3 - Kendi Kendini Optimize Eden Güç Göstergesi Power Candles V3, döviz ve enstrüman gücünü, eklendiği her grafikte eyleme geçirilebilir bir ticaret planına dönüştürür. Sadece mumları renklendirmek yerine, arka planda canlı bir otomatik optimizasyon çalıştırır ve önünüzdeki sembol için en iyi Stop Loss, Take Profit ve sinyal eşiğini size sunar. Tek bir tıklama ile canlı ticarete uyarlanır - giriş, Stop Loss ve Take Profit ışınları grafikte tam fiyatlarla görünür ve uyarılar yön bil
Quantum TrendPulse
Bogdan Ion Puscasu
5 (26)
SuperTrend   ,   RSI   ve   Stochastic'in   gücünü tek bir kapsamlı göstergede birleştirerek işlem potansiyelinizi en üst düzeye çıkaran nihai işlem aracı olan   Quantum TrendPulse'u   tanıtıyoruz. Hassasiyet ve verimlilik arayan yatırımcılar için tasarlanan bu gösterge, piyasa trendlerini, momentum değişimlerini ve en uygun giriş ve çıkış noktalarını güvenle belirlemenize yardımcı olur. Temel Özellikler: SuperTrend Entegrasyonu:   Güncel piyasa trendlerini kolayca takip edin ve karlılık dalgası
Tokyo mt5 Indicator
Vasiliy Strukov
5 (14)
Tokyo Indicator; trend yönü, potansiyel işlem sinyalleri ve piyasa koşulları hakkında net ve görsel bir genel bakış sunar. Renk kodlu ve kademeli trend çizgisi, yükseliş evrelerini (mavi) düşüş evrelerinden (macenta) ayırt eder. Trend değiştiğinde, buna karşılık gelen yön okları potansiyel alım ve satım fırsatlarını vurgular. Entegre bir panel; mevcut sinyali, piyasa eğilimini, momentumu, volatiliteyi ve sinyal kalitesini tek bir kullanışlı görünümde bir araya getirir. Bu sayede yatırımcılar, fa
Adaptive Price Action Engine Göstergeyi al, EA'sı (Uzman Danışman) bedava gelsin Kendi Kendini Optimize Eden Multi-Timeframe Trend ve Mum Formasyonu Analizi Piyasalar sürekli değişir ve her Price Action formasyonu her piyasa koşulunda aynı değere sahip değildir. Adaptive Price Action Engine , değişen piyasa koşullarına uyum sağlamak amacıyla trend yapısını, Multi-Timeframe analizini, mum formasyonlarını ve istatistiksel optimizasyonu tek bir analiz sistemi içerisinde birleştirir. İki Adaptif Mod
Superhero
Ihor Otkydach
5 (3)
SUPERHERO göstergesi, "her şeyi kapsayan" bir temele dayalı olarak tasarlanmış çoklu para birimli bir işlem sistemidir. Gösterge, piyasayı bağımsız olarak analiz eder ve işlemlerin ne zaman açılıp kapatılacağına dair sinyaller verir. Stop Loss ve Take Profit emirlerini kullanır. R:R oranı 1:1'dir. Bu sistem akıllı telefonunuza anlık bildirimler gönderebilir; böylece bir bilgisayara bağlı kalmanıza gerek kalmadan "hareket halindeyken" işlem yapabilirsiniz. Bu, özel ticaret şirketleri için idealdi
Trend Catcher ind mt5
Ramil Minniakhmetov
5 (18)
TREND YAKALAYICI GÖSTERGE Trend Yakalayıcı Gösterge, yazarın tescilli ve özelleştirilmiş uyarlanabilir trend analiz göstergelerinin bir kombinasyonunu kullanarak piyasa fiyat hareketlerini analiz eder. Kısa vadeli gürültüyü filtreleyerek ve temel momentum gücüne, volatilite genişlemesine ve fiyat yapısı davranışına odaklanarak gerçek piyasa yönünü belirler. Ayrıca, hareketli ortalamalar, RSI ve volatilite filtreleri gibi yumuşatma ve trend filtreleme özelleştirilmiş göstergelerinin bir kombina
Çoklu Para Birimi Güç ve Momentum Göstergesi MT5 Dynamic Forex28 Navigator, uzun süredir popüler olan göstergelerimizin gelişmiş halidir ve üç aracın gücünü tek bir araçta birleştirir: Advanced Currency Strength28 Indicator (700 değerlendirme) Advanced Currency IMPULSE with ALERT (530 değerlendirme) CS28 Combo Signals (güncel bonus) İki önceki gösterge MQL5 Market'te birlikte 1.200'den fazla değerlendirme aldı ve 2016'dan bu yana MT4 topluluğunun vazgeçilmez araçlarından biri. Dynamic Forex28 Na
Apex Patterns PRO İndikatörü Satın Alın - Üzerine Kurulu Expert Advisor'a ÜCRETSİZ Sahip Olun. Kendini Optimize Eden Grafik Formasyonu ve Kırılım Zekası Geleneksel formasyon tarayıcıları sabit girdilere dayanır ve piyasa volatilitesi ile yapıları değiştiğinde genellikle düşük performans gösterir. Apex Patterns PRO, yapısal grafik formasyon tanımayı, momentum filtrelemeyi ve istatistiksel kendi kendini optimizasyonu tek bir analitik çerçevede birleştirerek değişen piyasa koşullarına uyum sağlama
Crystal Heikin Ashi Signals
Muhammad Jawad Shabir
5 (5)
Crystal Heikin Ashi Signals—Professional Trend & Signal Detection Indicator Advanced Heikin Ashi Visualization with Intelligent Signal System for Manual & Automated Trading Final Price: $149 ---------> Price goes up $10 after every 10 sales . Limited slots available — act fast . Overview User Guide PDF Crystal Heikin Ashi Signals is a professional-grade MetaTrader 5 indicator that combines pure Heikin Ashi candle visualization with an advanced momentum-shift detection system. Designed for both m
Neuro Poseidon MT5
Daria Rezueva
4.75 (52)
Neuro Poseidon is a new indicator by Daria Rezueva. It combines precise trading signals with adaptive TP/SL levels - creating best possible trades as a result! Message me and get  Neuro Poseidon Assistant  as a gift to automize your trading process! What makes it stand out? 1. Proven profitability on all assets and timeframes 2. Only confirmed BUY and SELL signals present on the chart 3. Adaptive TP & SL levels generated by the software for each trade 4. Easy to understand - suitable for al
Yazarın diğer ürünleri
Stochastic Divergen MT5
Komang Putra Riswanjaya
2 (1)
Overview The Stochastic Divergence Indicator is a tool designed to help identify potential market turning points by analyzing divergences between price and the Stochastic Oscillator. It highlights divergence signals visually on the chart, assisting traders in observing possible trend changes. Key Features No Repaint: Once a signal is formed, it remains on the chart. Adjustable Parameters: Settings can be modified to fit different trading preferences and timeframes. Visual Display: Arrows are plo
Iceberg Divergen MT5
Komang Putra Riswanjaya
3.5 (2)
Iceberg Divergen Indicator Uncover the hidden opportunities beneath the surface. Overview Divergences in the Awesome Oscillator (AO) often signal powerful market reversals, yet spotting them manually can be challenging and time-consuming. Missing out on these opportunities can cost traders valuable entry points. That’s why we created the   Iceberg Divergence Indicator   — a powerful tool that precisely detects both regular and hidden divergences in AO. With Iceberg Divergence, you won’t just id
FREE
Iceberg Divergen Indicator
Komang Putra Riswanjaya
5 (3)
Iceberg Divergence Indicator will help traders to find divergent patterns that occur on the charts very easily and simply This indicator will visualize divergences pattern that occur on the chart by combining it with an awesome oscillator indicator Key Features Easy to use : The Iceberg divergent indicator is made as simple as possible so that it is easy to use Pattern Visualization : Divergent patterns will be visualized on the live chart Precision : The indicator detects divergent patterns wi
FREE
MA Ribbon Flow MT5
Komang Putra Riswanjaya
MA Ribbon Flow MA Ribbon Flow is a trend visualization indicator that combines 20 Moving Averages into a single ribbon-like structure. The purpose of this indicator is to help traders validate whether a trend has truly changed direction or if the market is only experiencing temporary pullbacks or noise. By observing the flow, alignment, and spacing between the MA ribbons, traders can identify: Trend strength Trend continuation Potential reversals Momentum expansion and weakening The indicator
FREE
Darvas Flow Indicator
Komang Putra Riswanjaya
5 (3)
Darvas Flow Indicator is a revolutionary trading indicator that combines the classic Darvas Box method with modern market flow analysis. Developed for serious traders, Darvas Flow offers a powerful and intuitive tool for identifying trading opportunities. Key Features: Darvas Box Method Implementation: Darvas Flow automatically identifies Darvas boxes, allowing you to see crucial support and resistance levels. This helps in pinpointing optimal entry and exit points in your trades. Dynamic Flow
FREE
Awesome MACD Indicator
Komang Putra Riswanjaya
5 (1)
AWESOME MACD INDICATOR Awesome MACD Indicator is a powerful trading tool that combines the strengths of Moving Average (MA) and Moving Average Convergence Divergence (MACD) to provide accurate and reliable trading signals. Designed for forex and stock traders, this indicator simplifies the identification of trading opportunities by detecting significant crosses in price movements. Key Features: MA and MACD Combination: Awesome MACD leverages the power of Moving Averages (MA) to identify short-te
FREE
Period Breakout Indicator
Komang Putra Riswanjaya
5 (1)
Overview The Period Breakout Indicator is a versatile tool designed for traders seeking to identify breakout opportunities based on customizable time periods. This indicator automatically determines the highest and lowest prices within a user-defined period, allowing you to tailor it precisely to your trading strategy. Key Features Customizable Time Periods: Define the start and end times based on your preferred trading hours or any specific period. The indicator will then calculate the highest
FREE
MA Ribbon Flow MT4
Komang Putra Riswanjaya
MA Ribbon Flow MA Ribbon Flow is a trend visualization indicator that combines 20 Moving Averages into a single ribbon-like structure. The purpose of this indicator is to help traders validate whether a trend has truly changed direction or if the market is only experiencing temporary pullbacks or noise. By observing the flow, alignment, and spacing between the MA ribbons, traders can identify: Trend strength Trend continuation Potential reversals Momentum expansion and weakening The indicator
FREE
Break And Retreace MT5
Komang Putra Riswanjaya
Break & Retrace is a smart price action indicator designed to help traders identify the most important market events after a support or resistance level is formed. Instead of drawing countless lines on your chart, the indicator automatically highlights key breakout opportunities, detects fake breakouts, and confirms retracement entries with a clean and easy-to-read interface. Whether you're a breakout trader or prefer waiting for pullbacks, Break & Retrace gives you the signals you need without
Awesome Moving Average
Komang Putra Riswanjaya
Overview Discover a powerful yet simple indicator to identify market trends effectively!  Awesome Moving Average (AWMA)  is designed to detect bullish or bearish trends by analyzing price breakouts beyond the moving average line. Basically, the way this indicator works is similar to the Moving Average indicator available on the MetaTrader platform. As we know, the Moving Average indicator tends to be difficult to use when the market is in a sideways condition because it often gives false breakou
FREE
Renko Flow MT5
Komang Putra Riswanjaya
Renko Flow Are you a trader who loves using Renko charts? Unfortunately, MetaTrader does not provide an easy built-in way to display Renko charts directly. That’s why Renko Flow was created — to give traders a simple and practical way to use Renko-style visualization without needing complicated external tools or offline charts. Renko Flow can visualize Renko charts directly inside a separate window, allowing you to analyze Renko movement while still keeping your original price chart clean and
FREE
Darvas Flow
Komang Putra Riswanjaya
5 (1)
Darvas Flow Indicator is a revolutionary trading indicator that combines the classic Darvas Box method with modern market flow analysis. Developed for serious traders, Darvas Flow offers a powerful and intuitive tool for identifying trading opportunities. Key Features Darvas Box Method Implementation : Darvas Flow automatically identifies Darvas boxes, allowing you to see crucial support and resistance levels. This helps in pinpointing optimal entry and exit points in your trades. Dynamic Flow
FREE
RR Visualizer
Komang Putra Riswanjaya
RR Visualizer - Enhance Your MT4 Risk Management RR Visualizer   is an essential MT4 utility for traders looking to optimize their risk management effortlessly.  This tool calculates the ideal lot size based on your preferred risk percentage and the custom stop-loss distance you set, giving you full control over your money management. Designed with a user-friendly and attractive interface,  RR Visualizer  keeps the focus on your trading, not on complex calculations. Key Features Customizable Ris
FREE
Awesome Pivot Indicator
Komang Putra Riswanjaya
4 (1)
The Pivot Indicator is a vital tool for technical analysis used by traders in the financial markets. Designed to assist in identifying potential reversal points or trend changes, this indicator provides valuable insights into key levels in the market. Key features of the Pivot Indicator include: Automatic Calculations: The Pivot Indicator automatically calculates Pivot Point, Support, and Resistance levels based on the previous period's high, low, and close prices. This eliminates the complexity
FREE
Overview The Period Breakout Indicator is a versatile tool designed for traders seeking to identify breakout opportunities based on customizable time periods. This indicator automatically determines the highest and lowest prices within a user-defined period, allowing you to tailor it precisely to your trading strategy. Key Features Customizable Time Periods:   Define the start and end times based on your preferred trading hours or any specific period. The indicator will then calculate the highes
FREE
The Pivot Indicator is a vital tool for technical analysis used by traders in the financial markets. Designed to assist in identifying potential reversal points or trend changes, this indicator provides valuable insights into key levels in the market. Key features of the Pivot Indicator include: Automatic Calculations: The Pivot Indicator automatically calculates Pivot Point, Support, and Resistance levels based on the previous period's high, low, and close prices. This eliminates the complexity
FREE
SMS | Simple Market Structure Simple Market Structure is an indicator designed to represent market structure in a simple, clean, and easy-to-understand way. Many market structure indicators available today are overly complicated and filled with unnecessary visuals, making them difficult to understand — especially for traders who want to quickly identify market direction and structure. That is why this indicator was created. This indicator focuses only on the essential components: Bullish/Bearis
Stochastic Divergen MT4
Komang Putra Riswanjaya
Overview The Stochastic Divergence Indicator is a tool designed to help identify potential market turning points by analyzing divergences between price and the Stochastic Oscillator. It highlights divergence signals visually on the chart, assisting traders in observing possible trend changes. Key Features No Repaint: Once a signal is formed, it remains on the chart. Adjustable Parameters: Settings can be modified to fit different trading preferences and timeframes. Visual Display: Arrows are pl
Sideway Box Indicator
Komang Putra Riswanjaya
Sideway Box Indicator The Sideway Box Indicator is an advanced trading tool designed to help traders identify and capitalize on sideways market conditions. This powerful indicator detects periods when the market is in a sideways (ranging) phase, providing traders with clear visual cues. Key Features: Sideways Market Detection : The Sideway Box Indicator accurately identifies sideways market conditions, allowing traders to recognize when the price is consolidating within a specific range. Buy/Sel
Candle Pattern Pro
Komang Putra Riswanjaya
Description : In the world of trading, candlestick patterns are a popular technical analysis tool used by many traders.   There are numerous candlestick patterns, ranging from reversal patterns to continuation patterns. However, remembering all these patterns can be challenging, especially for novice traders. This often leads to traders having to manually memorize and identify candlestick patterns, which can be time-consuming and prone to errors. Candle Pattern Pro is a powerful indicator design
QQE Divergen MT4
Komang Putra Riswanjaya
QQE Divergen – Advanced Trading Indicator Overview The  QQE (Quantitative Qualitative Estimation)  indicator is a powerful trading tool designed to enhance trend detection and market momentum analysis. QQE is an advanced version of the RSI (Relative Strength Index) that utilizes  smoothed moving averages  and  dynamic trailing levels  to generate highly accurate signals. QQE Divergen  improves upon the traditional QQE by integrating divergence detection, making it even more effective for identi
MACD Divergen MT4
Komang Putra Riswanjaya
Overview The MACD Divergence Indicator is a powerful tool designed to detect potential trend reversals by analyzing divergences between price action and the MACD (Moving Average Convergence Divergence) indicator. It automatically identifies and highlights bullish and bearish divergence signals directly on the chart, making it easier for traders to spot high-probability trading opportunities. Key Features Customizable Settings: Includes adjustable parameters to suit various trading styles and tim
Break And Retreace MT4
Komang Putra Riswanjaya
Break & Retrace   is a smart price action indicator designed to help traders identify the most important market events after a support or resistance level is formed. Instead of drawing countless lines on your chart, the indicator automatically highlights key breakout opportunities, detects fake breakouts, and confirms retracement entries with a clean and easy-to-read interface. Whether you're a breakout trader or prefer waiting for pullbacks, Break & Retrace gives you the signals you need witho
Simple Double Top MT4
Komang Putra Riswanjaya
Simple Double Top is a lightweight and user-friendly indicator designed to automatically detect Double Top and Double Bottom reversal patterns with a clean and intuitive visualization. Despite its name,   Simple Double Top   detects   both Double Top and Double Bottom patterns , helping traders identify potential bullish and bearish reversal opportunities with ease. Instead of cluttering your chart with unnecessary objects, the indicator focuses on displaying only the essential information. Once
SidewayBox MT5
Komang Putra Riswanjaya
Sideway Box Indicator The Sideway Box Indicator is an advanced trading tool designed to help traders identify and capitalize on sideways market conditions. This powerful indicator detects periods when the market is in a sideways (ranging) phase, providing traders with clear visual cues. Key Features Sideways Market Detection : The Sideway Box Indicator accurately identifies sideways market conditions, allowing traders to recognize when the price is consolidating within a specific range. Buy/Sel
Candle Pattern Pro MT5
Komang Putra Riswanjaya
Description : In the world of trading, candlestick patterns are a popular technical analysis tool used by many traders.   There are numerous candlestick patterns, ranging from reversal patterns to continuation patterns. However, remembering all these patterns can be challenging, especially for novice traders. This often leads to traders having to manually memorize and identify candlestick patterns, which can be time-consuming and prone to errors. Candle Pattern Pro is a powerful indicator desig
QQE Divergen MT5
Komang Putra Riswanjaya
QQE Divergen – Advanced Trading Indicator Overview The  QQE (Quantitative Qualitative Estimation)  indicator is a powerful trading tool designed to enhance trend detection and market momentum analysis. QQE is an advanced version of the RSI (Relative Strength Index) that utilizes  smoothed moving averages  and  dynamic trailing levels  to generate highly accurate signals. QQE Divergen  improves upon the traditional QQE by integrating divergence detection, making it even more effective for identif
MACD Divergen MT5
Komang Putra Riswanjaya
Overview The MACD Divergence Indicator is a powerful tool designed to detect potential trend reversals by analyzing divergences between price action and the MACD (Moving Average Convergence Divergence) indicator. It automatically identifies and highlights bullish and bearish divergence signals directly on the chart, making it easier for traders to spot high-probability trading opportunities. Key Features Customizable Settings: Includes adjustable parameters to suit various trading styles and ti
SMS | Simple Market Structure Simple Market Structure is an indicator designed to represent market structure in a simple, clean, and easy-to-understand way. Many market structure indicators available today are overly complicated and filled with unnecessary visuals, making them difficult to understand — especially for traders who want to quickly identify market direction and structure. That is why this indicator was created. This indicator focuses only on the essential components: Bullish/Bearis
BB Trend Structure MT5
Komang Putra Riswanjaya
BB Trend Structure BB Trend Structure is a trend-following indicator built using a modified Bollinger Band concept to provide cleaner, more stable, and more consistent trend detection. Unlike traditional Bollinger Bands that rely heavily on the middle band movement, this indicator focuses primarily on the Upper Band and Lower Band structure.   This approach allows the trend line to remain smoother and more consistent, making trend direction easier to read and less noisy during market fluctuati
Filtrele:
Değerlendirme yok
Değerlendirmeye yanıt