Pivot Points with Multi Timeframes
- Göstergeler
- Sürüm: 2.0
- Güncellendi: 25 Ağustos 2026
- Etkinleştirmeler: 5

Pivot Points with Multi Timeframes
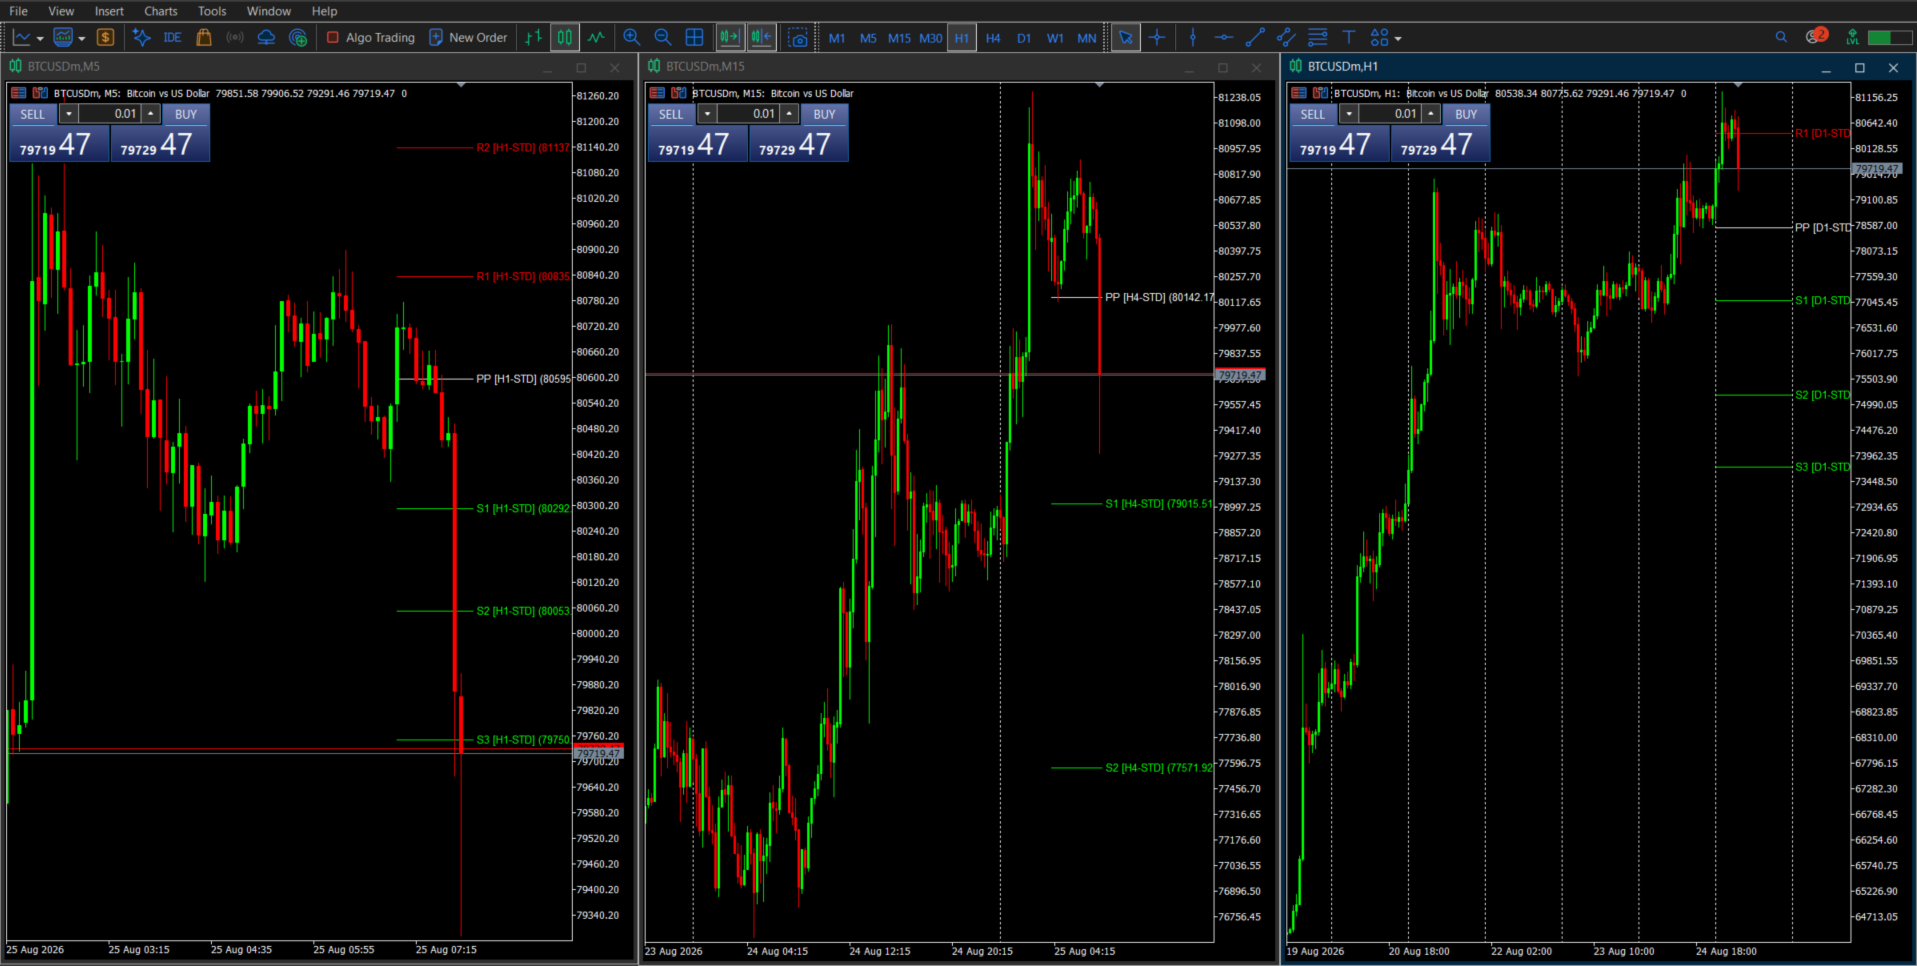
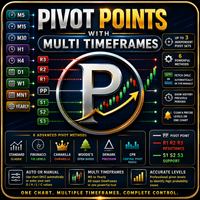
A complete, all-in-one Pivot Point indicator built for traders who want flexibility without switching tools or juggling multiple charts. Run up to 3 independent pivot sets at once, choose your periods and methods per set, view historical levels, and get alerted the moment price reaches a key level — all from one indicator.
🔥 NEW: Run 3 Pivot Sets Simultaneously
No more switching charts to compare timeframes. Each of the 3 sets has its own independent:
- Pivot period
- Calculation method
- On/off toggle
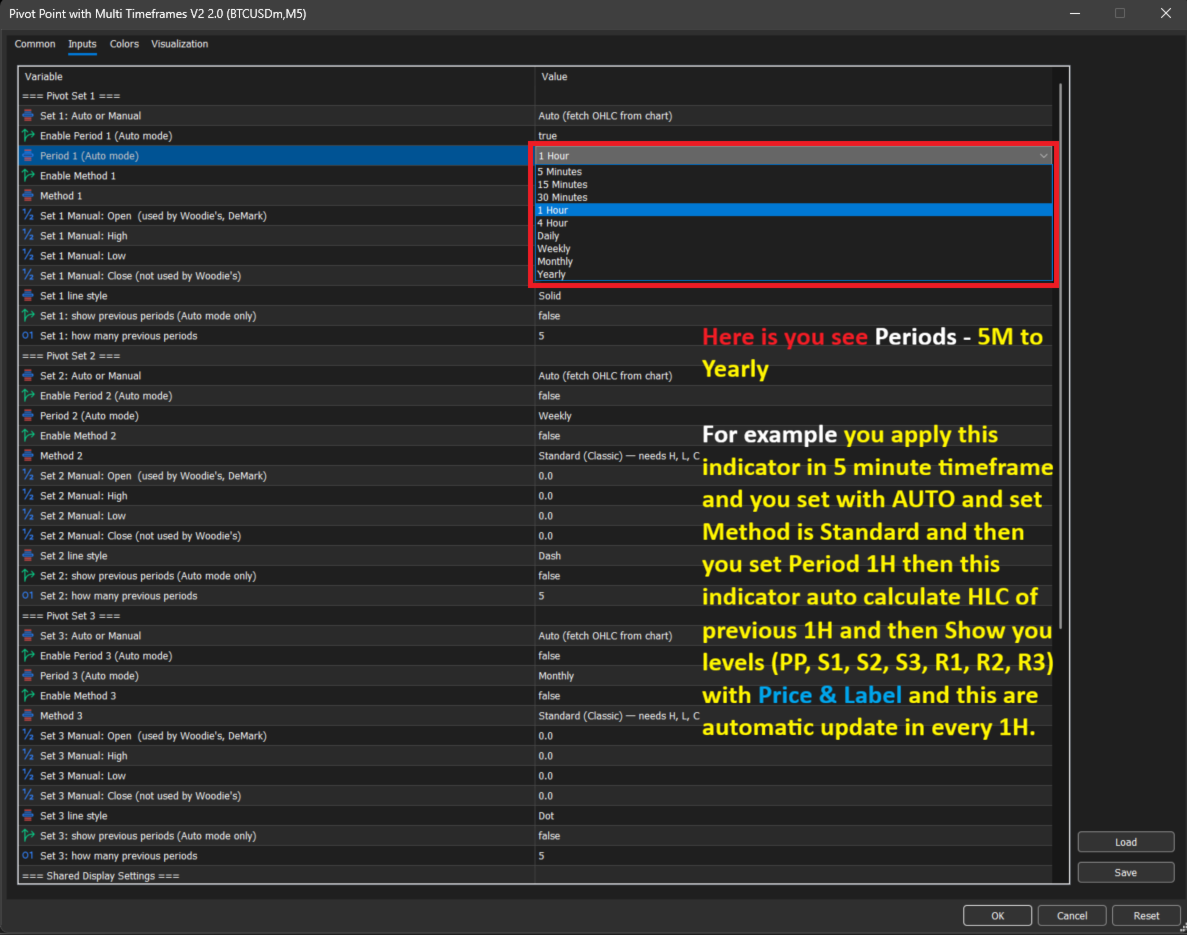
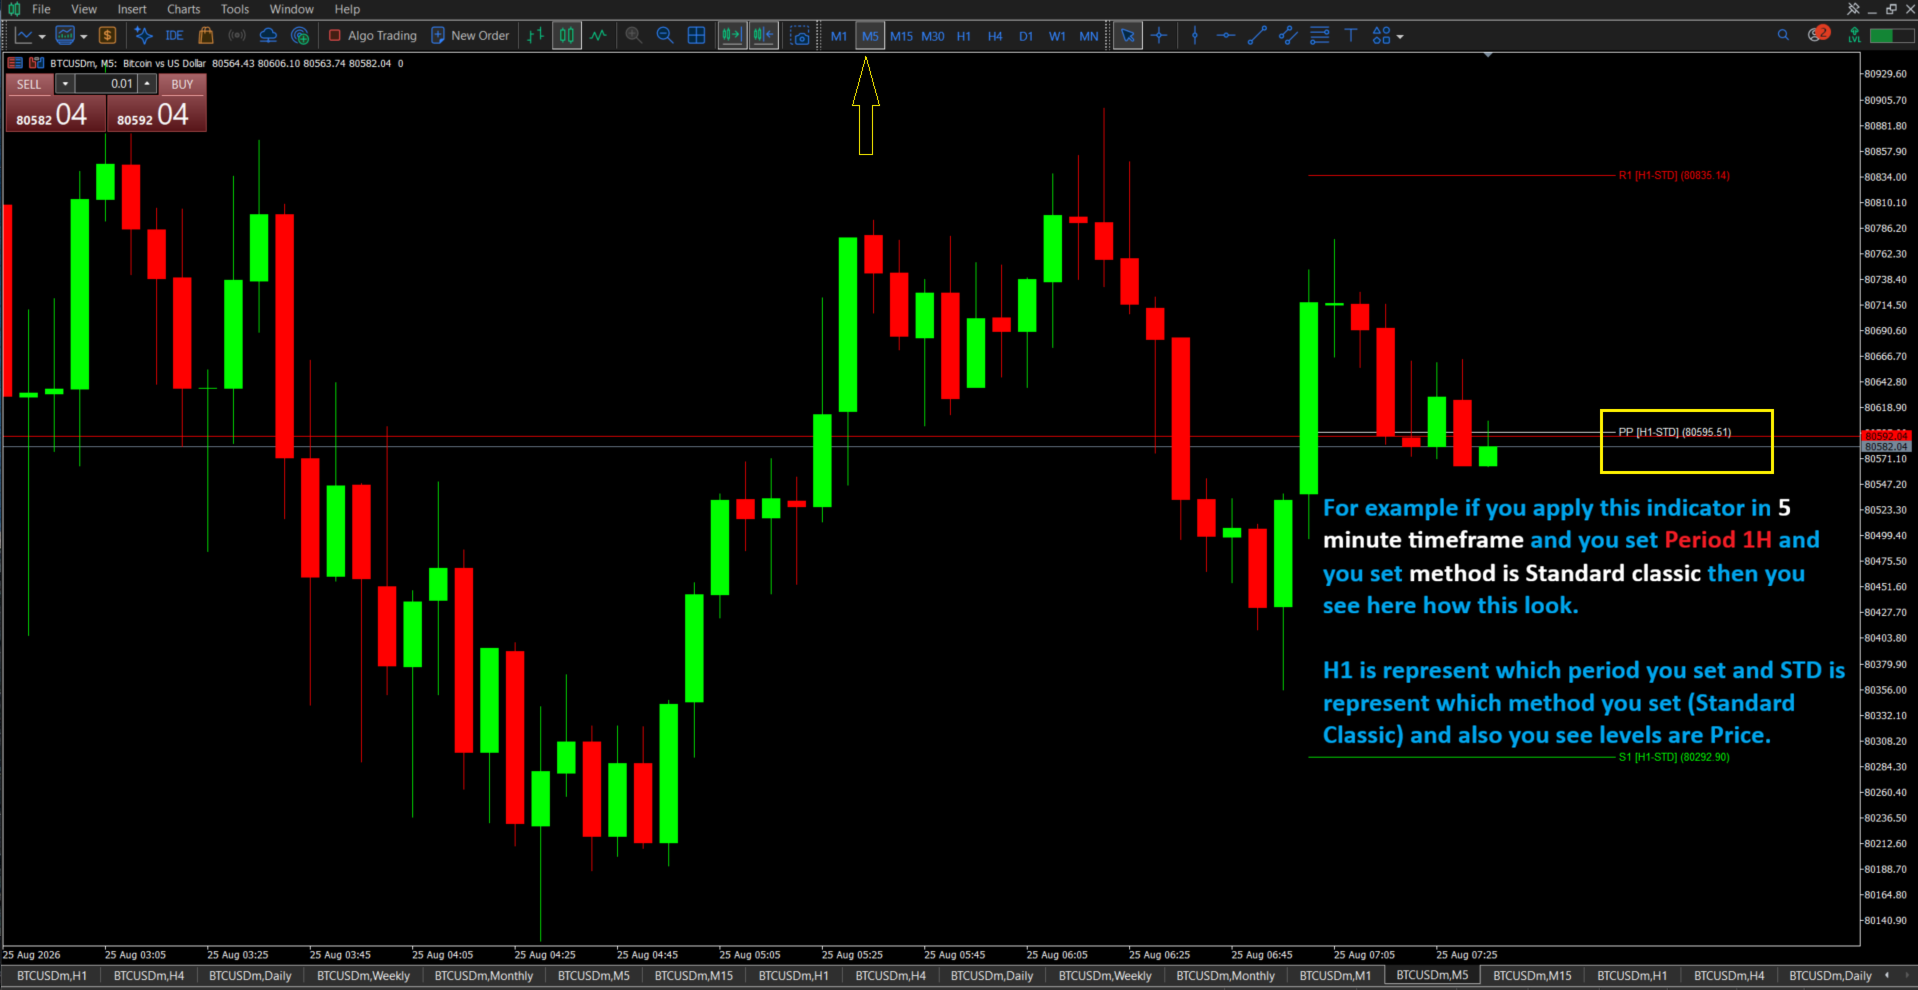
🕐 9 Selectable Pivot Timeframes
Calculate pivots independently of your chart timeframe:
- 5 / 15 / 30 Minute — for scalpers
- 1 Hour / 4 Hour — short-term intraday trading
- Daily — the day trading standard
- Weekly — swing trading reference levels
- Monthly — position trading / macro reference
- Yearly — long-term structural levels
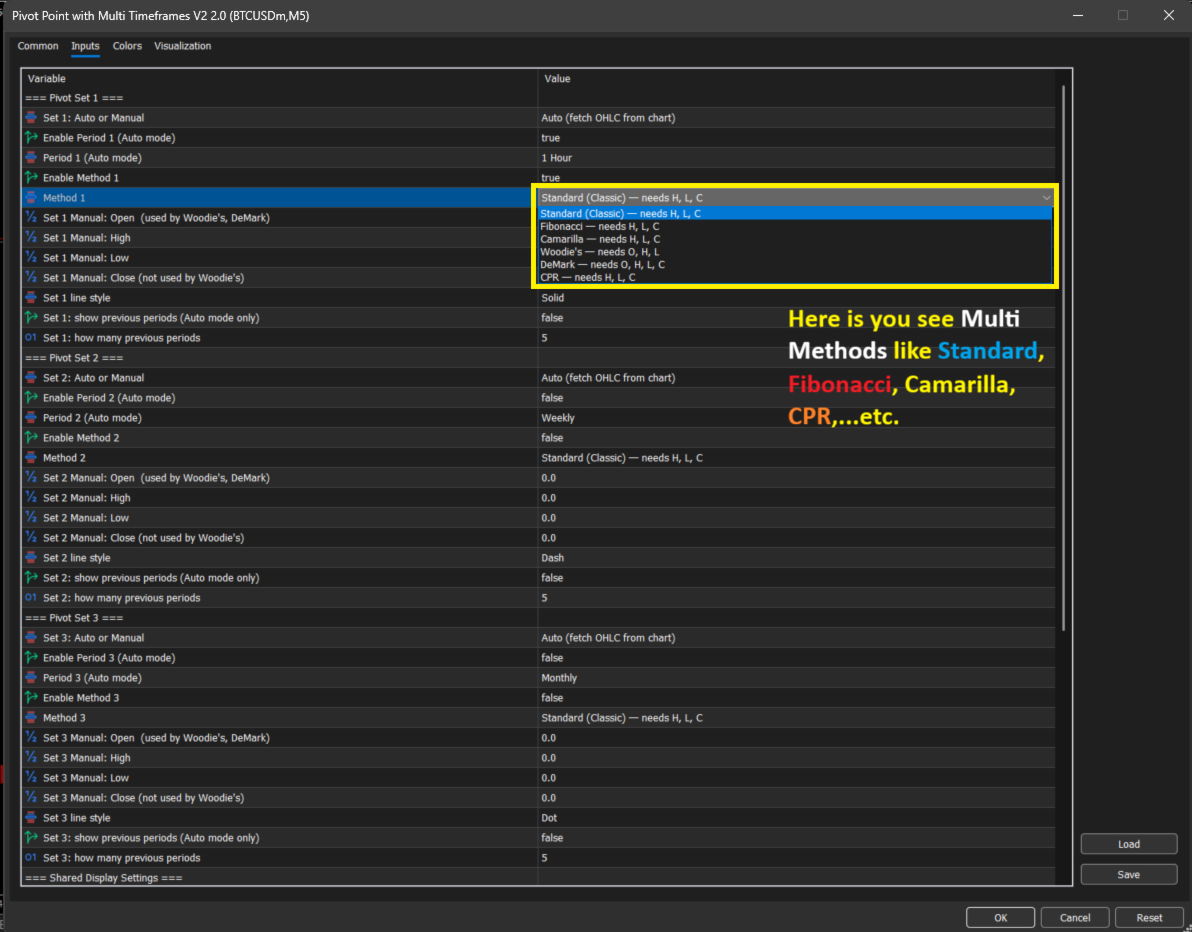
📊 6 Pivot Calculation Methods
Switch between methods instantly — no recompiling:
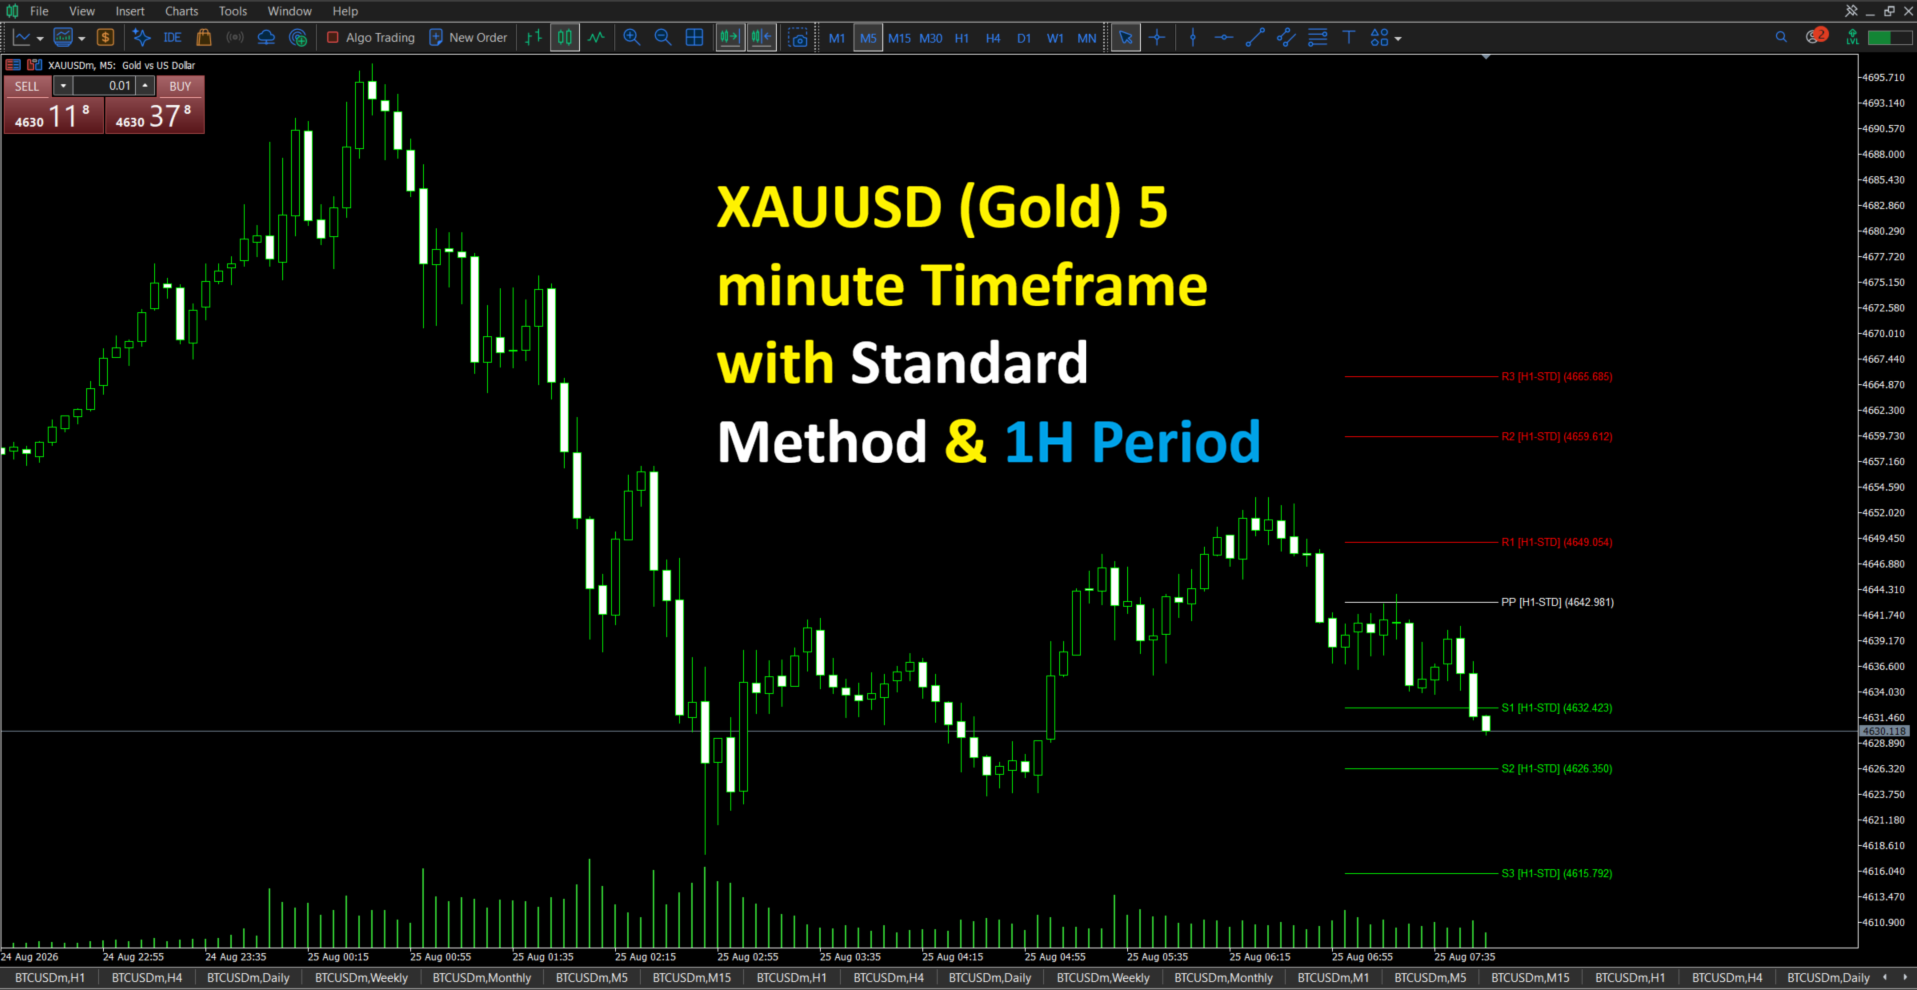
- Standard (Classic) — the traditional (H+L+C)/3 formula
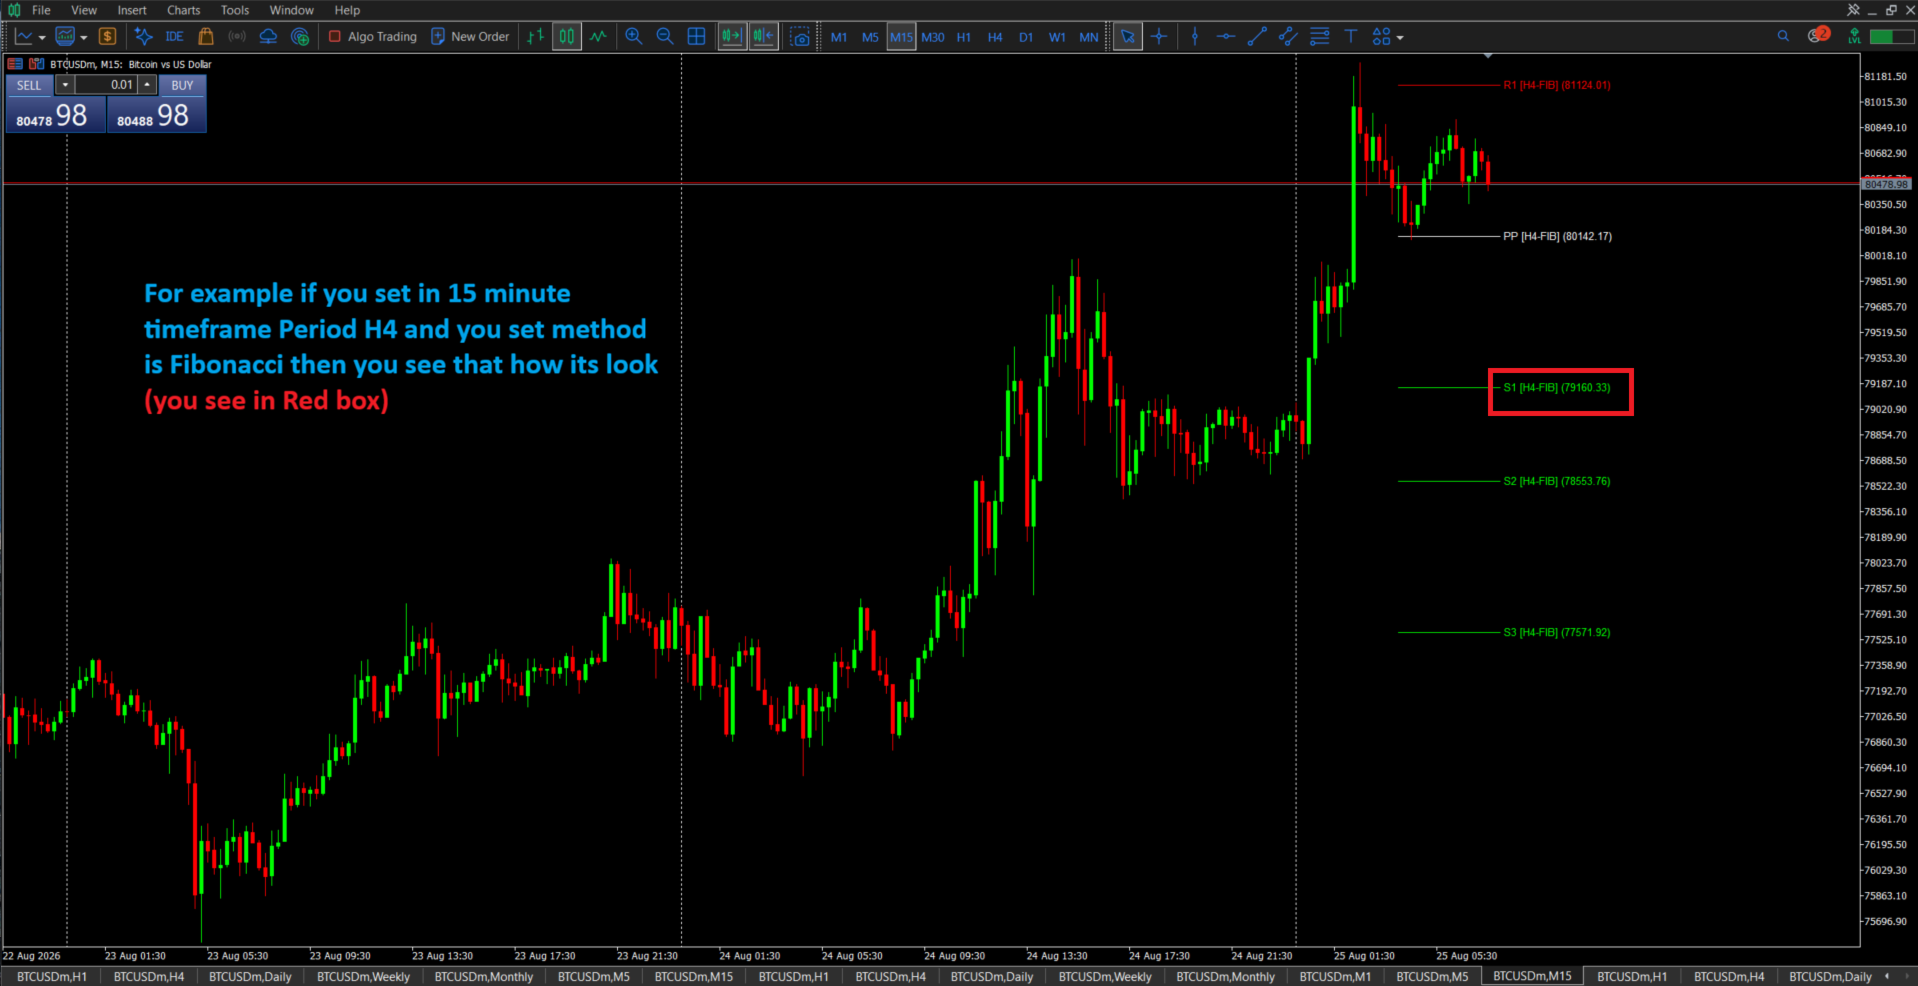
- Fibonacci — R/S levels at 38.2% / 61.8% / 100% of the prior range
- Camarilla — tight, close-anchored levels ideal for intraday mean-reversion
- Woodie's — weights the current session's open, reacts faster to gaps
- DeMark — simplified directional bias using PP/R1/S1 only
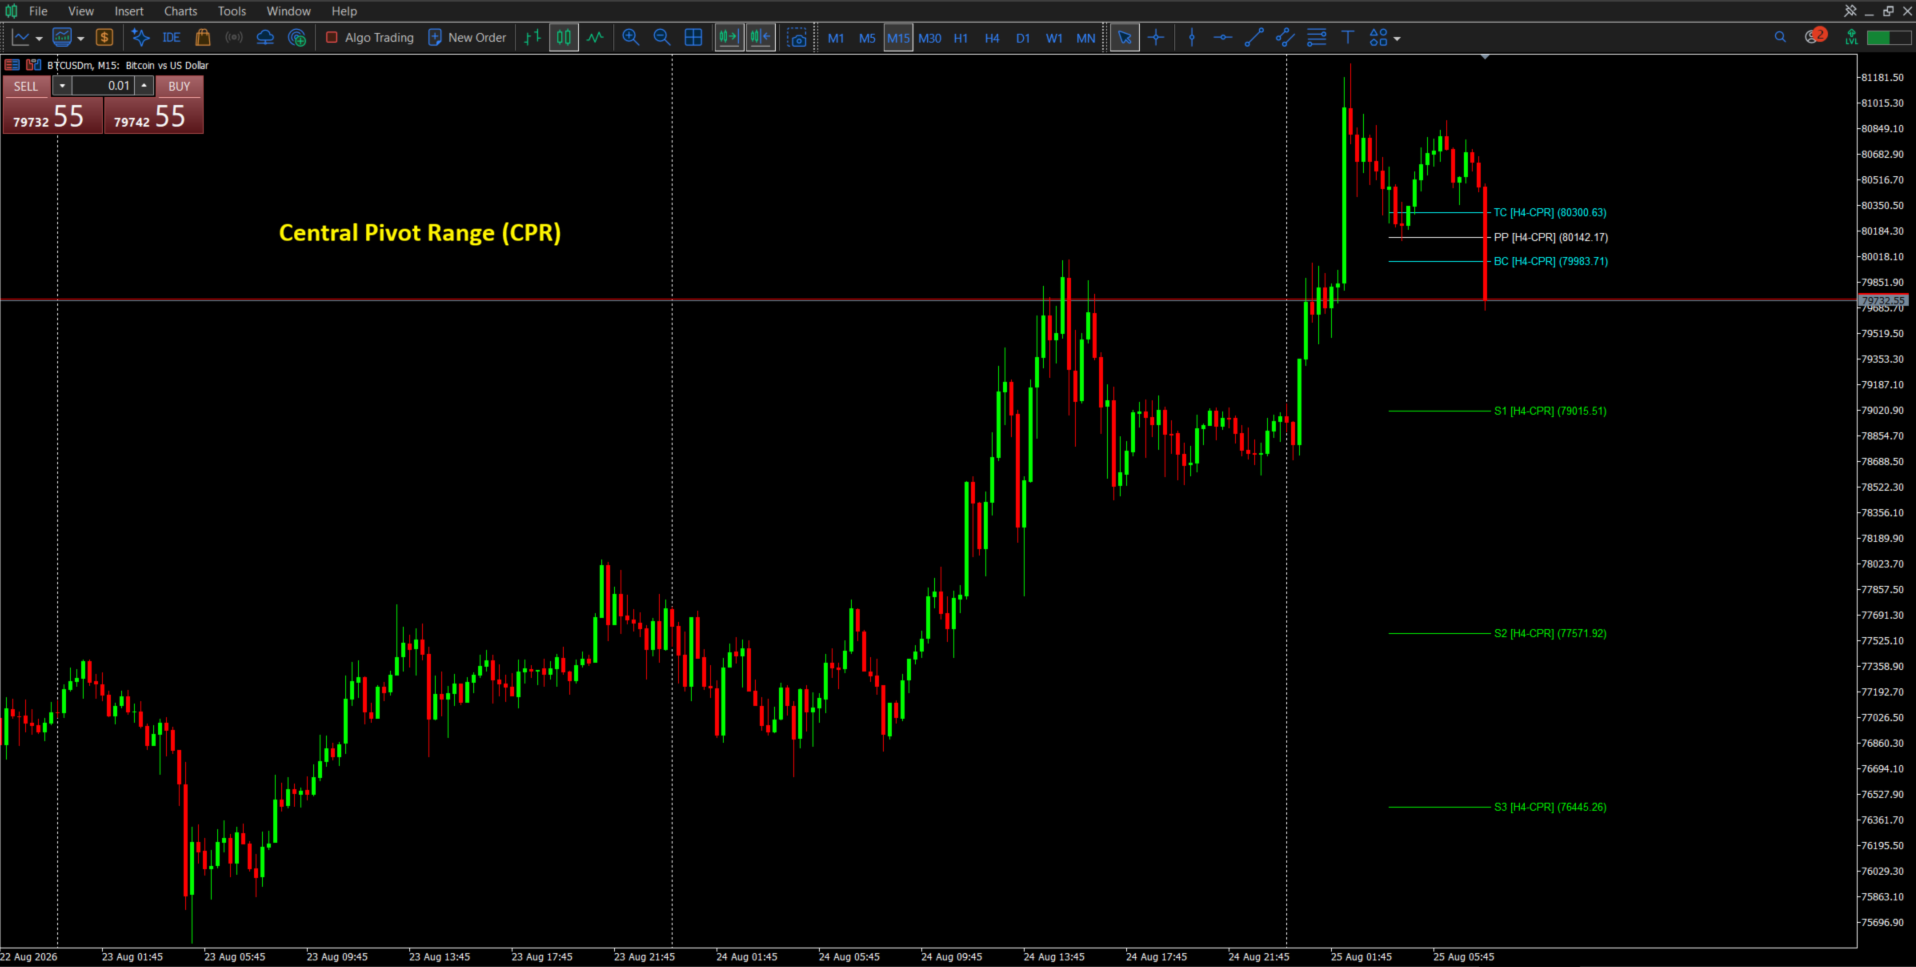
- CPR (Central Pivot Range) — BC/TC band that forecasts trending vs. range-bound sessions
🔥 NEW: See Historical Pivot Levels
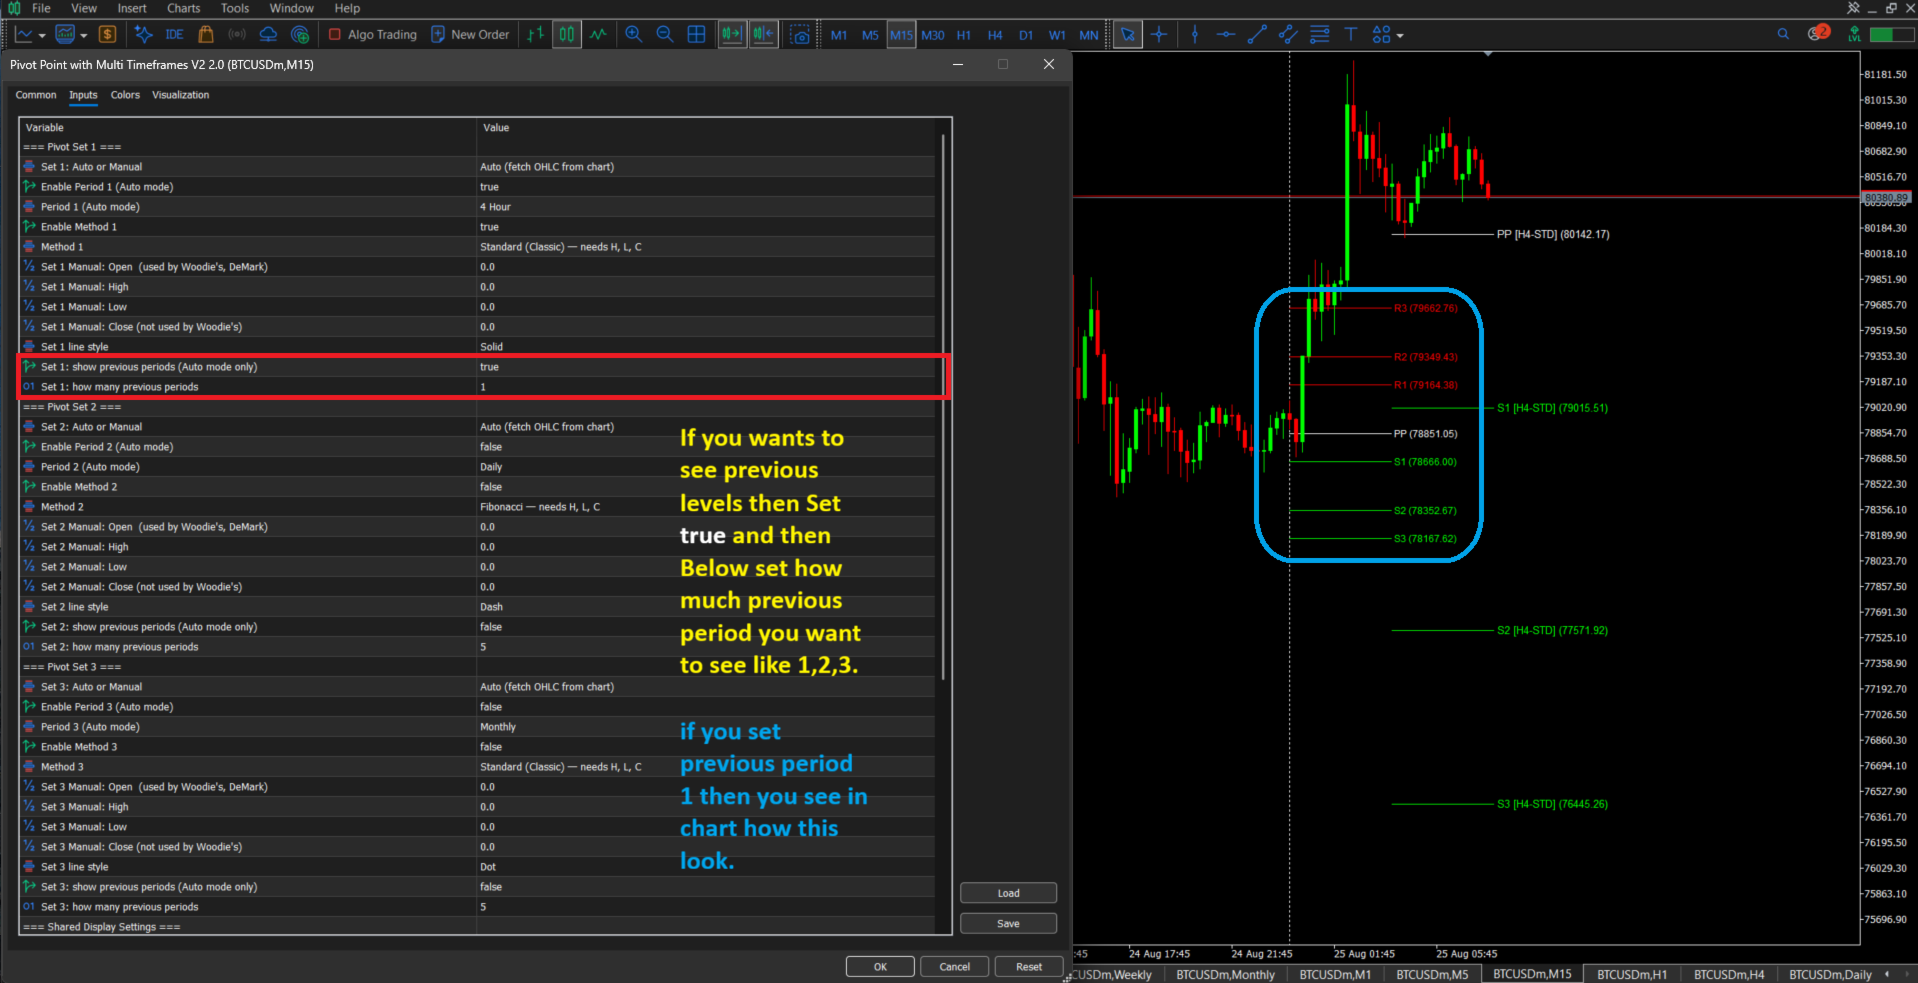
Don't just see today's pivots — see yesterday's, last week's, or last month's too. Each historical period gets its own accurately-calculated levels drawn exactly over that period's candles, so you can study how price has reacted to pivots over time, not just in the current session.
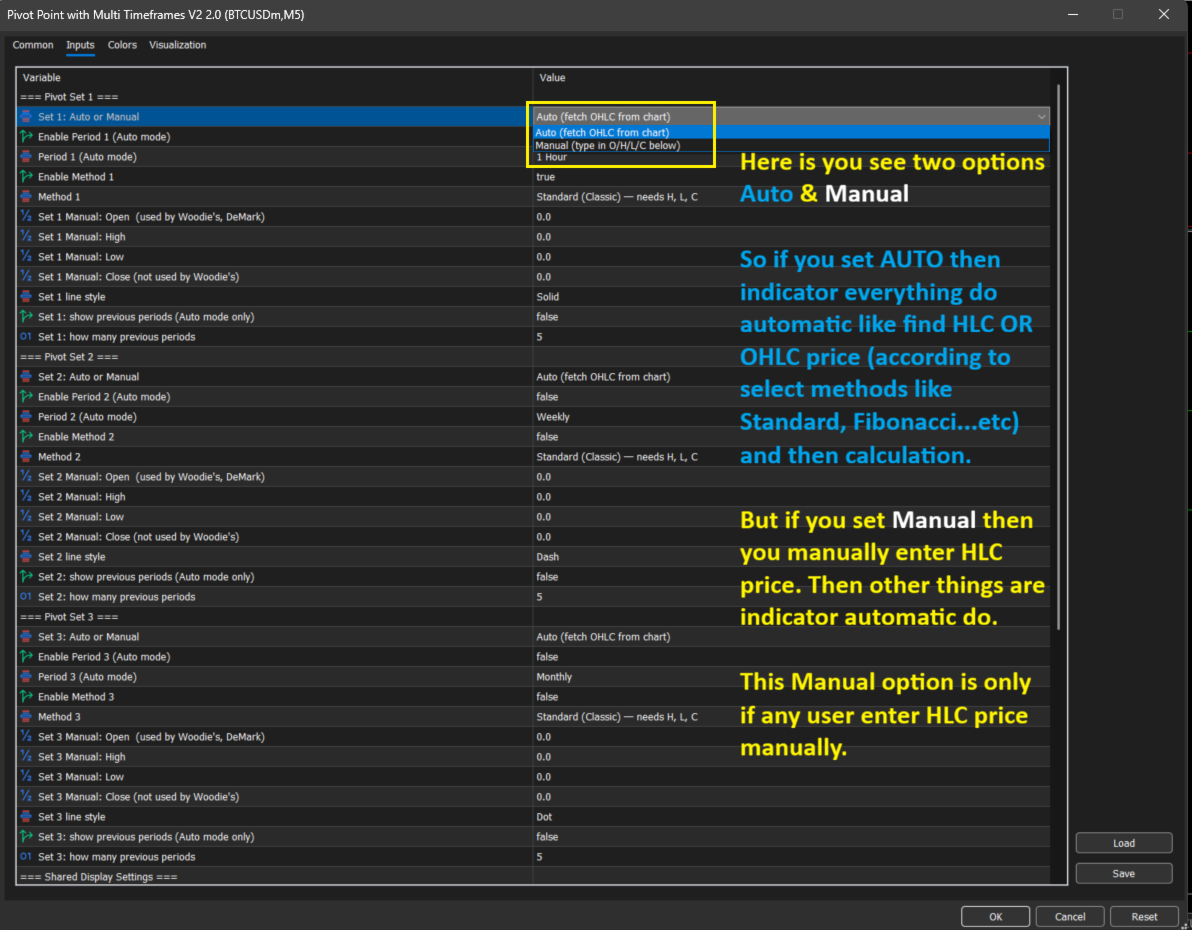
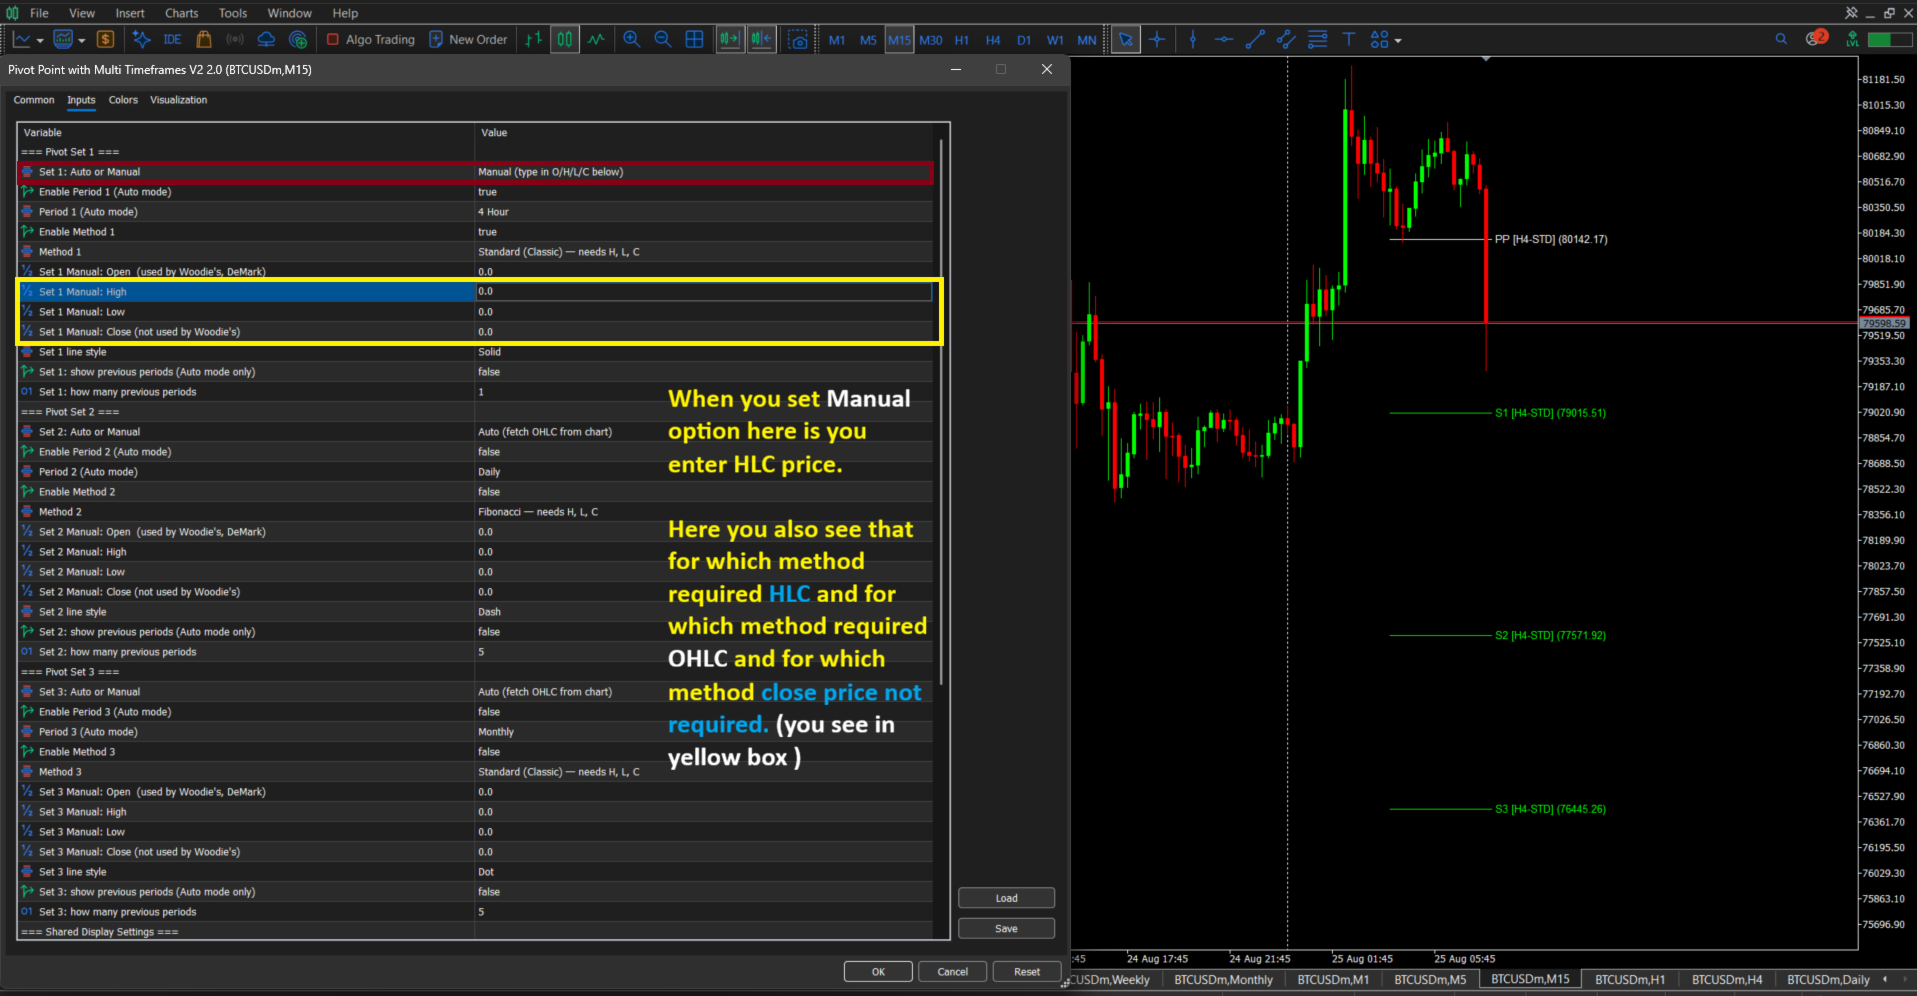
🔥 NEW: Manual OHLC Entry Mode
Switch any set to Manual and type in your own Open/High/Low/Close — the indicator calculates every level automatically from your numbers. Useful when working from a different data source, verifying levels against another platform, or testing a specific known session's pivots.
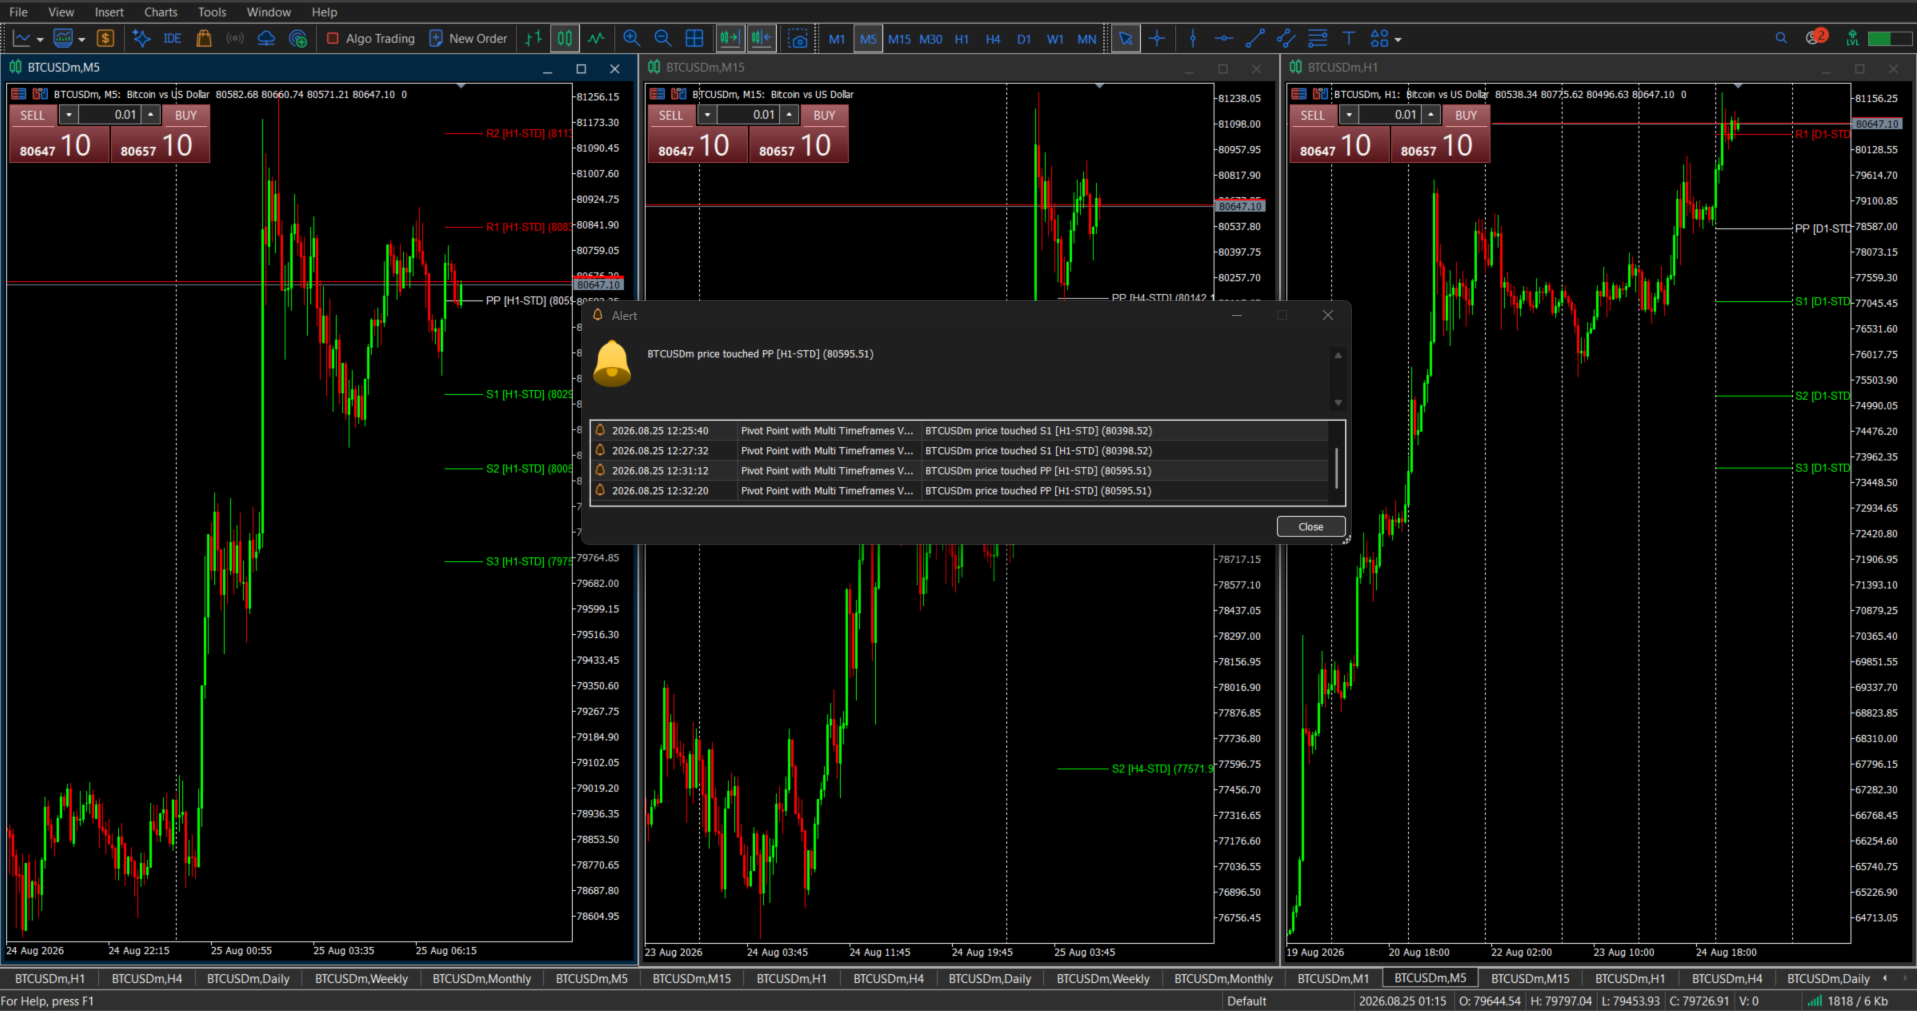
🔔 Level-Touch Alerts
Get notified the instant price reaches a pivot level:
- Popup alerts and mobile push notifications (MetaTrader app)
- Adjustable touch tolerance so alerts match your trading style
- Smart re-arming — won't spam you repeatedly at the same level
🎨 Fully Customizable Display
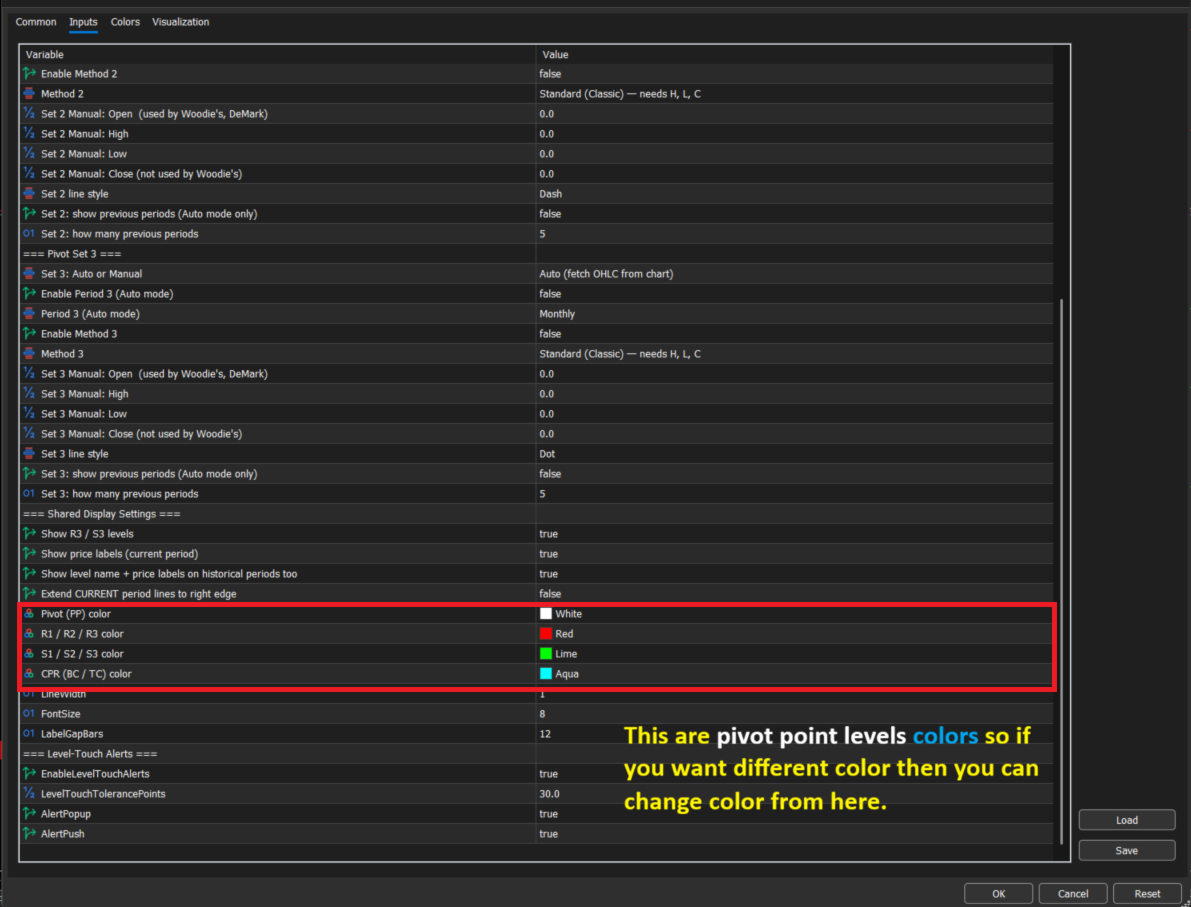
- Clean, intuitive color scheme: Resistance (R1/R2/R3) in red, Support (S1/S2/S3) in green, Pivot (PP) in white — every color adjustable
- Separate customizable color for the CPR band
- Distinct line style per set (solid/dash/dot) so overlapping sets stay readable
- Toggle R3/S3 levels on or off, per set
- Adjustable line width and label font size
Why Traders Use This Indicator
Most pivot indicators lock you into one timeframe, one formula, and only the current period. This one adapts to your strategy — run Daily Standard and Weekly Camarilla side by side, look back at how last month's CPR band played out, or drop in your own OHLC numbers when you need a level calculated from data outside your chart.
No repainting. No lag. Just clean, accurate levels — exactly where you need them, on however many timeframes you need them.