WickWatch Compass
- Göstergeler
-
Noel Anjao Alube
 Dedicated to developing smart, data-driven trading solutions with a strong focus on performance, risk management, and innovation. Committed to transforming trading ideas into automated strategies.
 - Sürüm: 2.1
- Etkinleştirmeler: 5
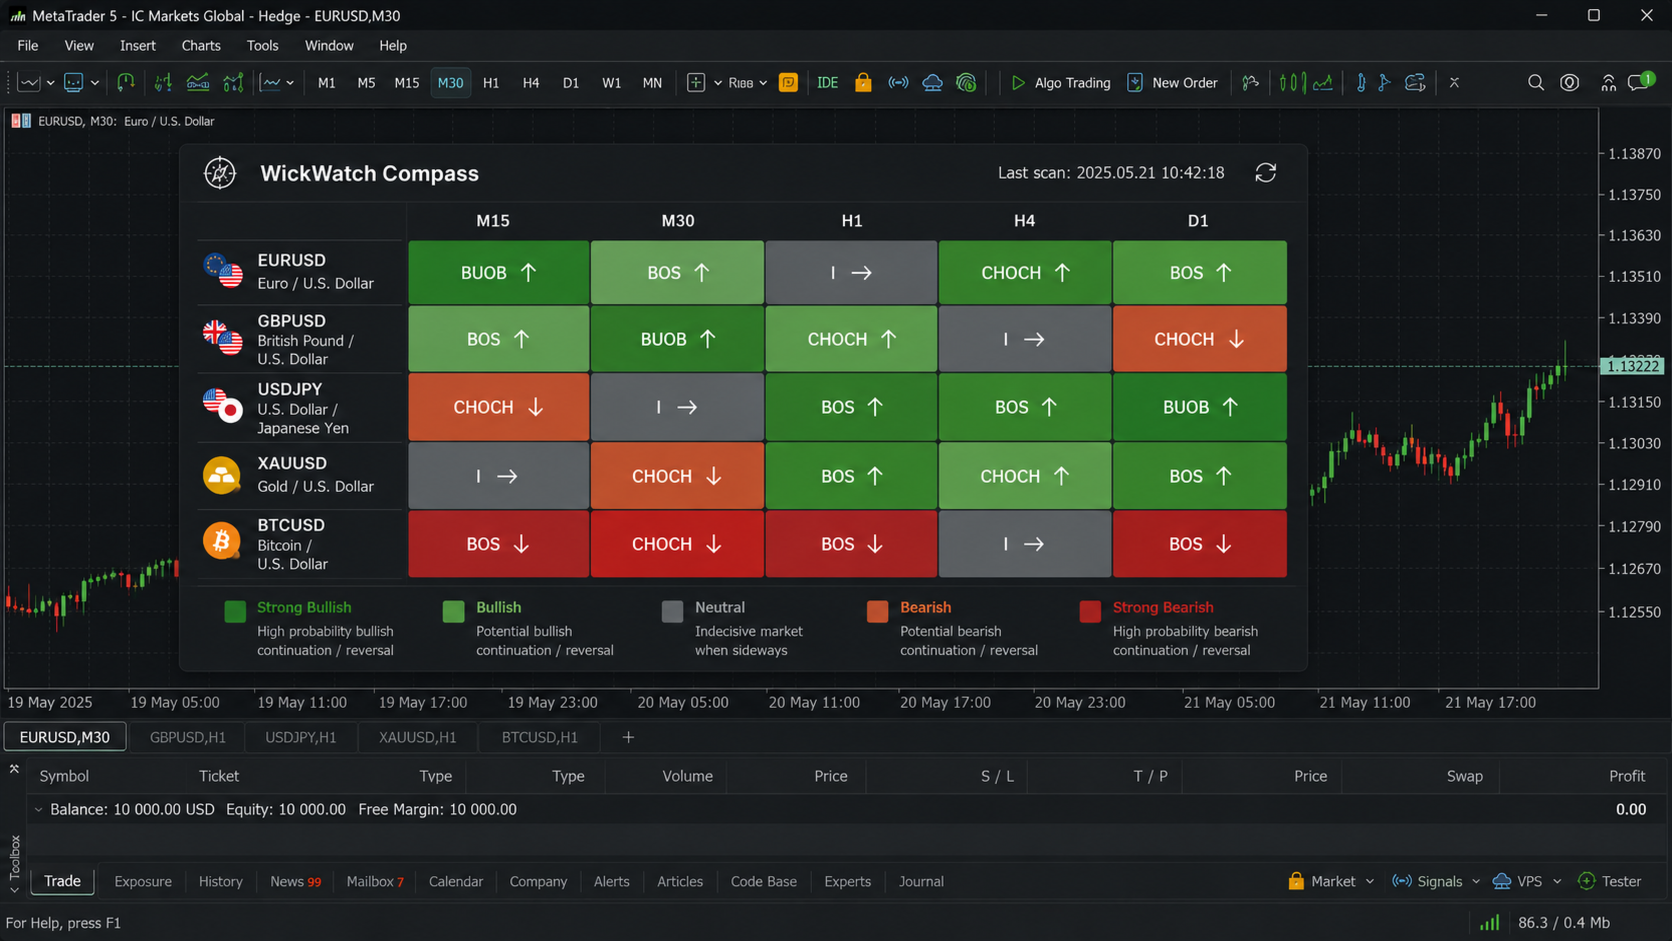
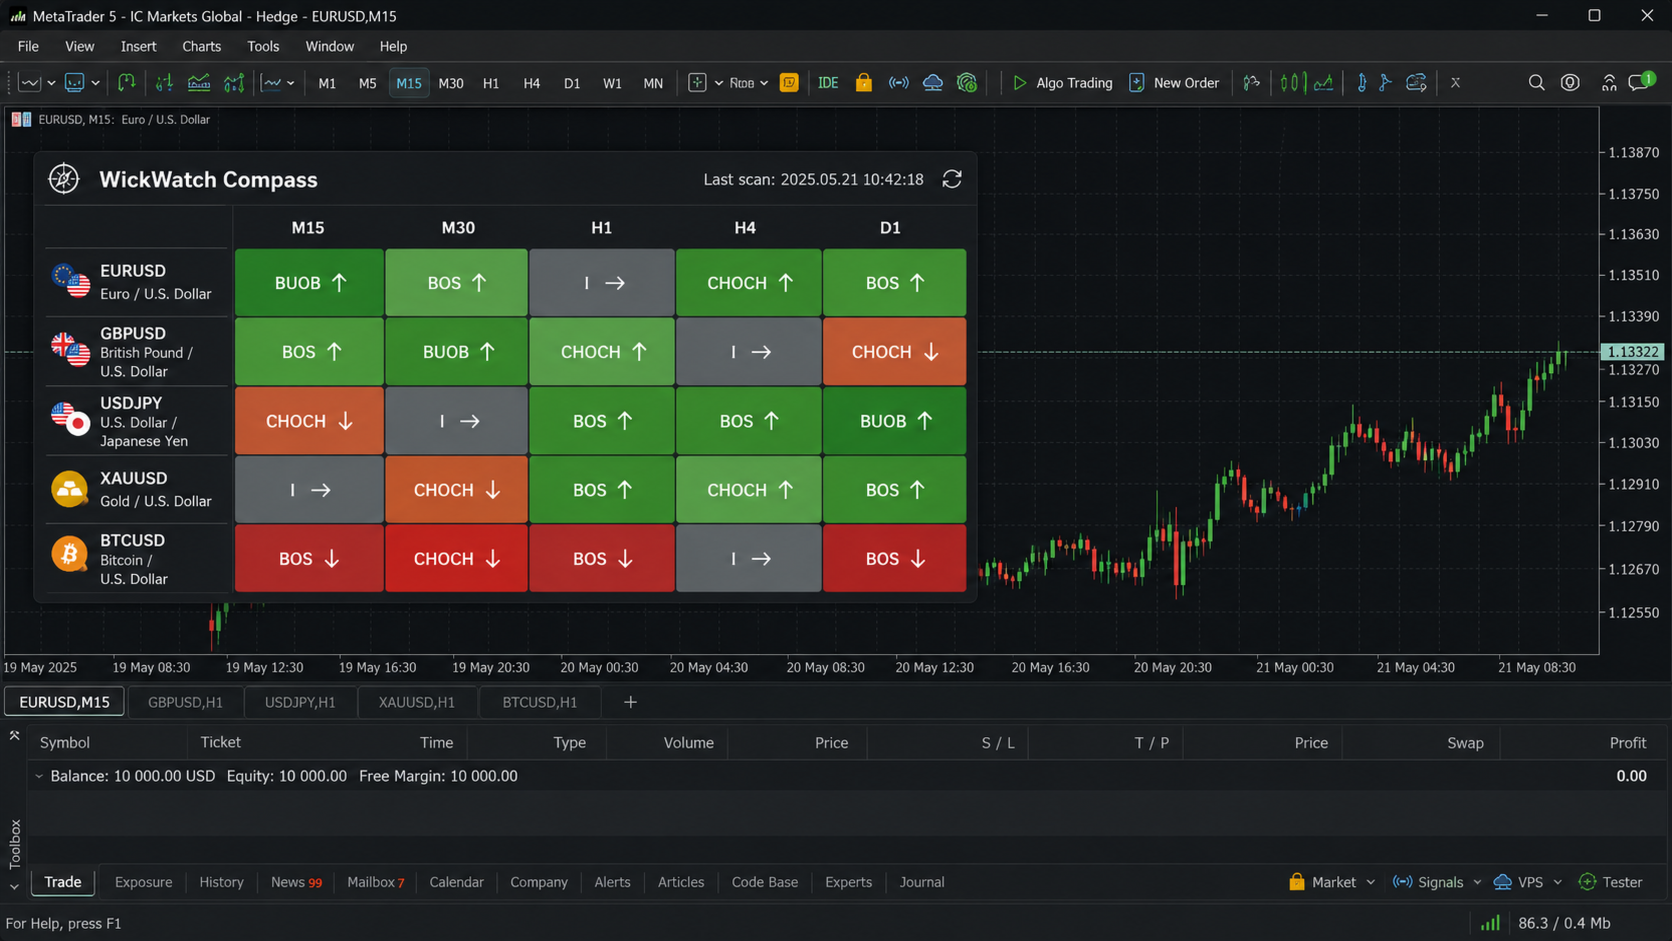
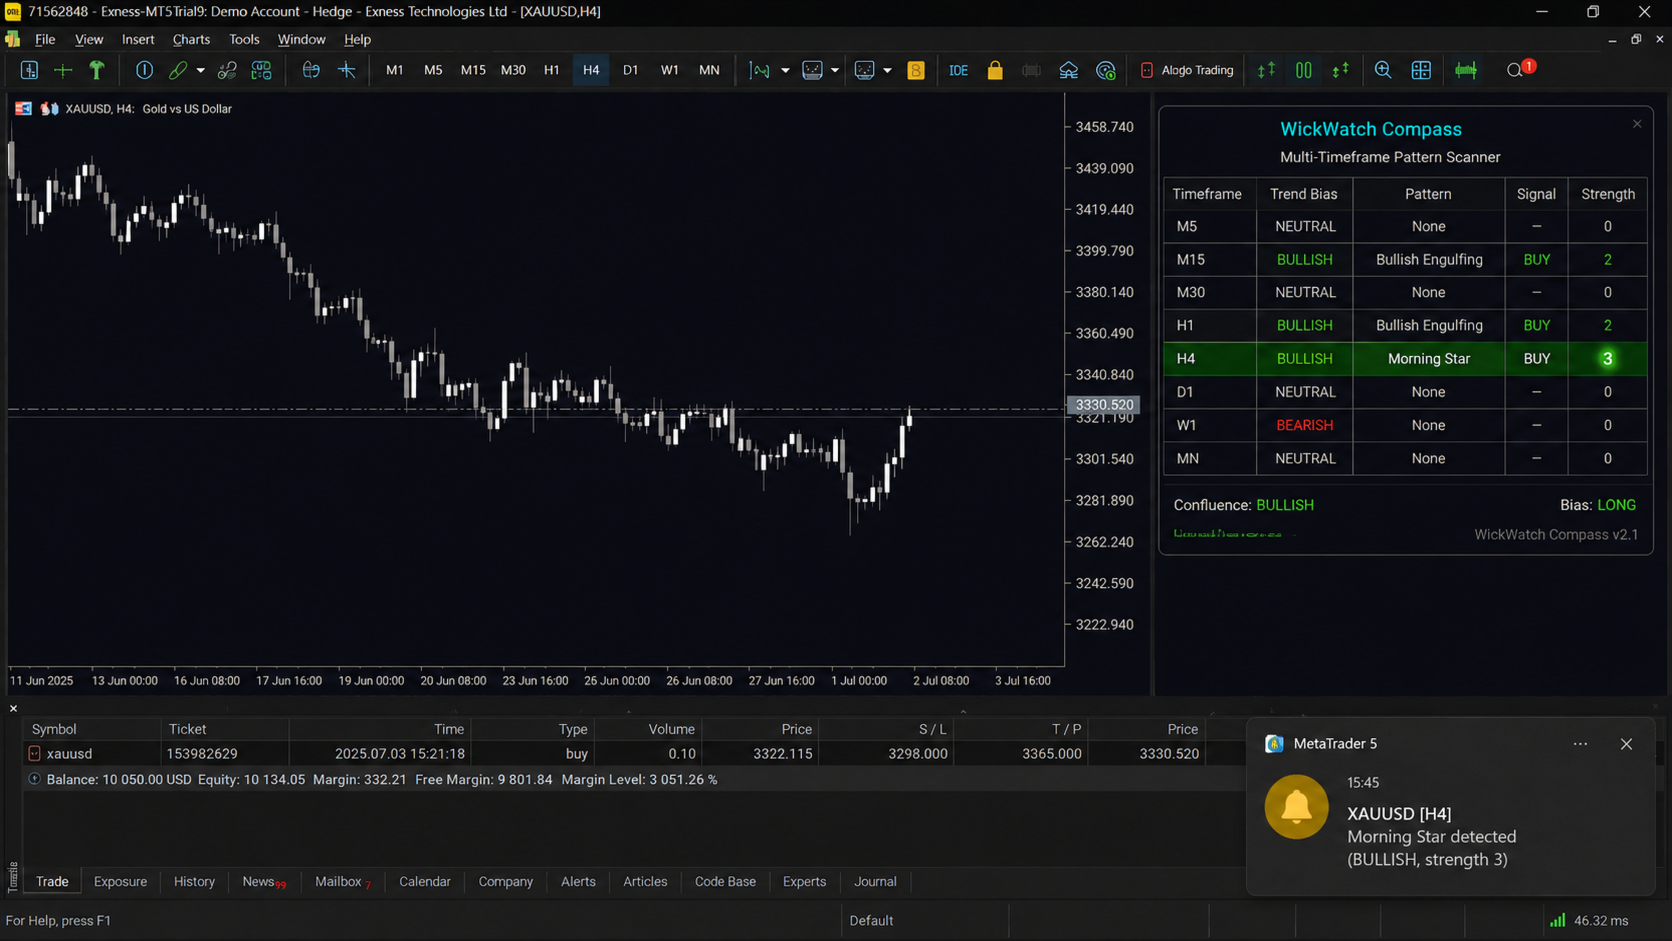
WickWatch Compass is a multi-symbol, multi-timeframe candlestick pattern dashboard for MetaTrader 5. It scans every symbol and timeframe you choose in real time, scores each candlestick formation for bullish or bearish strength, and displays the results as a color-coded grid you can read at a glance — then click any cell to jump straight to that chart with the pattern marked.
Reading candlestick patterns one chart at a time does not scale. If you follow more than two or three symbols, or you like to check the same pair across several timeframes before entering a trade, you end up flipping through charts manually and often miss the setup by the time you get to it. WickWatch Compass removes that bottleneck by scanning all of it at once and putting the result in a single dashboard.
How it works
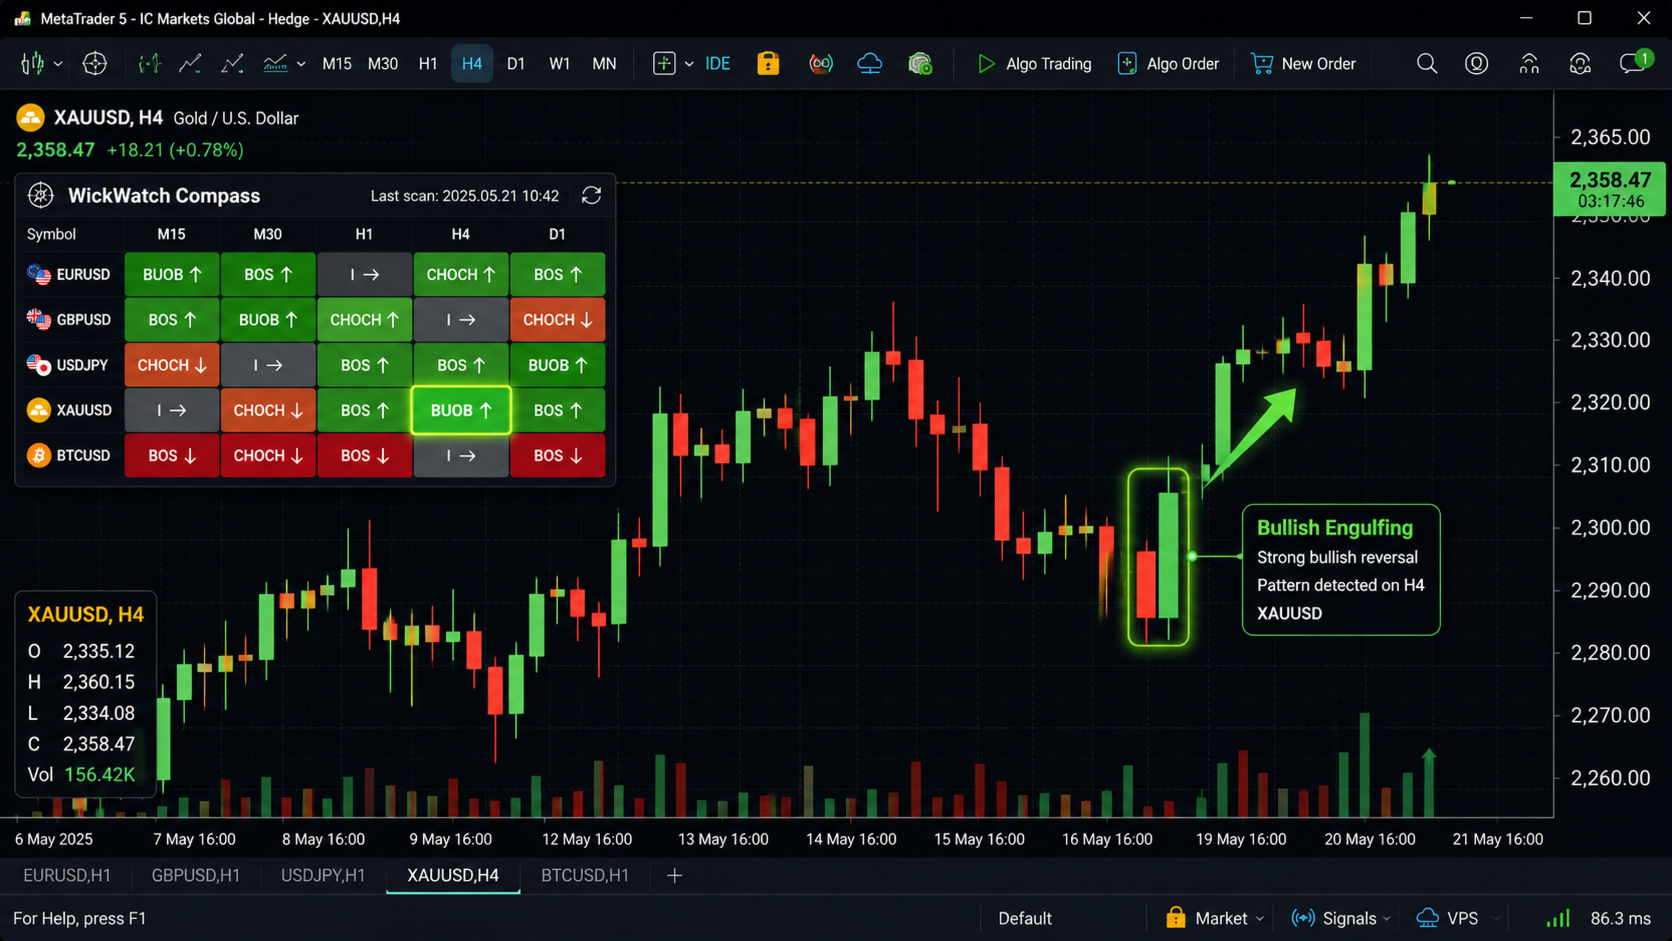
WickWatch Compass builds a grid directly on your chart: your chosen symbols run down the rows, your chosen timeframes run across the columns. Every cell represents one symbol/timeframe pair. On a fixed interval, the indicator pulls the most recently closed candles for every pair, runs them through its pattern engine, and colors the cell according to what it finds — bright green for a strong bullish signal, soft green for a weaker one, gray for no clear pattern, soft red for a weak bearish signal, and bright red for a strong bearish one. A short code inside each cell (with a directional arrow) tells you exactly which pattern was detected, so you never have to guess what a color means.
Pattern coverage
The engine recognizes seventeen formations spanning single, two, and three-candle patterns:
- Bullish Engulfing and Bearish Engulfing
- Morning Star and Evening Star
- Three White Soldiers and Three Black Crows
- Piercing Line and Dark Cloud Cover
- Bullish Harami and Bearish Harami
- Tweezer Bottom and Tweezer Top
- Hammer and Hanging Man
- Inverted Hammer and Shooting Star
- Doji
Each detected pattern is scored for strength based on body size, wick proportions, and the context of the prior candles, rather than a simple shape match, which keeps the signal count meaningful instead of noisy.
Click-through navigation
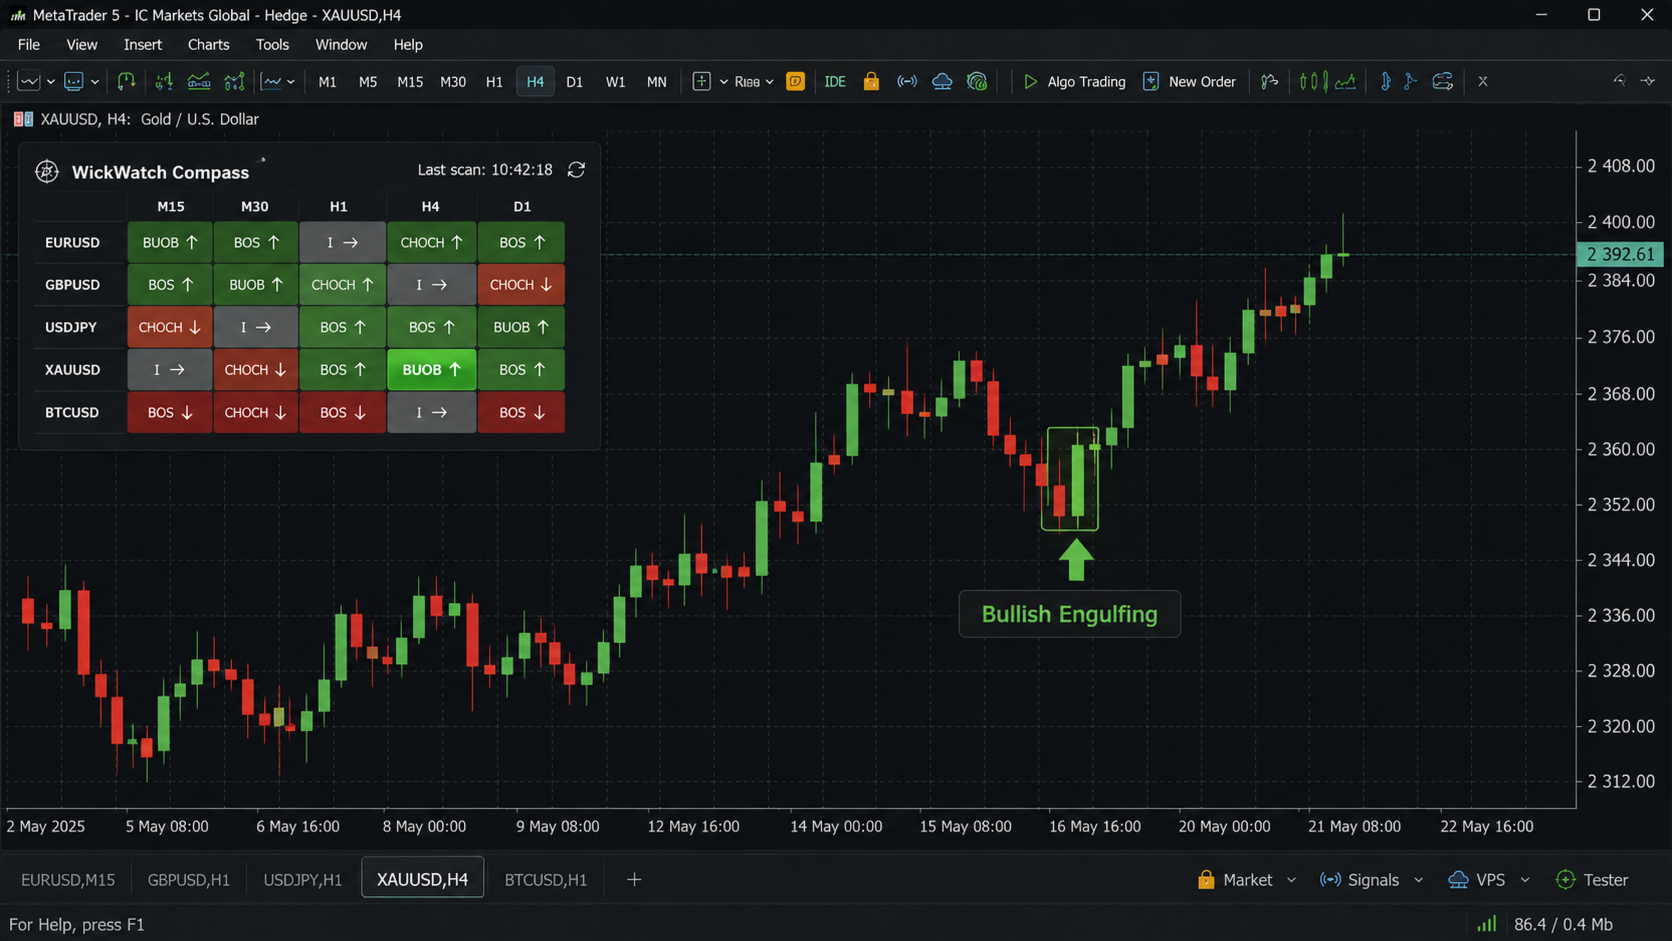
Every cell in the dashboard is clickable. Clicking a cell opens that exact symbol and timeframe in a new chart window and automatically marks the bar where the pattern was found with an arrow and a label, so you land straight on the setup instead of hunting for it.
Alerts on your terms
You choose which patterns are worth being interrupted for. WickWatch Compass can notify you through the MetaTrader terminal alert, a mobile push notification, an email, or a sound — any combination you like — and only for the patterns you have selected and only above the minimum strength you set. Each alert fires once per newly closed candle, so you are not flooded with repeat notifications while a bar is still forming.
Built for active multi-market trading
Whether you are watching a handful of forex majors across M15 to H4, tracking XAU/USD and BTC/USD alongside your usual pairs, or running a full watchlist across daily and weekly timeframes for swing setups, WickWatch Compass adapts to your list — you define the symbols and timeframes directly in the settings, and the dashboard resizes itself accordingly.
Key features
- Scans unlimited symbol and timeframe combinations on a configurable interval
- Detects 17 candlestick patterns with strength scoring, not just shape recognition
- Color-coded dashboard grid for instant visual reading
- One click opens the chart and marks the exact pattern bar
- Configurable alerts: terminal, push, email, and sound, filtered by pattern and strength
- Lightweight — dashboard only, no chart clutter, no drawn objects until you click a cell
- Fully adjustable dashboard position, cell size, and color scheme
WickWatch Compass is built for traders who want to monitor more of the market without giving up the depth of a manual read. Set your list once, and let the dashboard tell you where to look.