CRT Scanner MTF
- Göstergeler
- Sürüm: 1.1
- Etkinleştirmeler: 5

CRT Scanner MTF is a specialized indicator for traders who use the CRT — Candle Range Theory strategy. Its main purpose is to scan multiple timeframes in order to detect Mother Candles, R candles and active CRT ranges, helping traders identify which structures are currently active and which ones are aligned across different timeframes.
The indicator can scan up to 9 configurable timeframes at the same time. On each selected timeframe, it searches for relevant CRT ranges and identifies four main CRT models:
2-Candle CRT
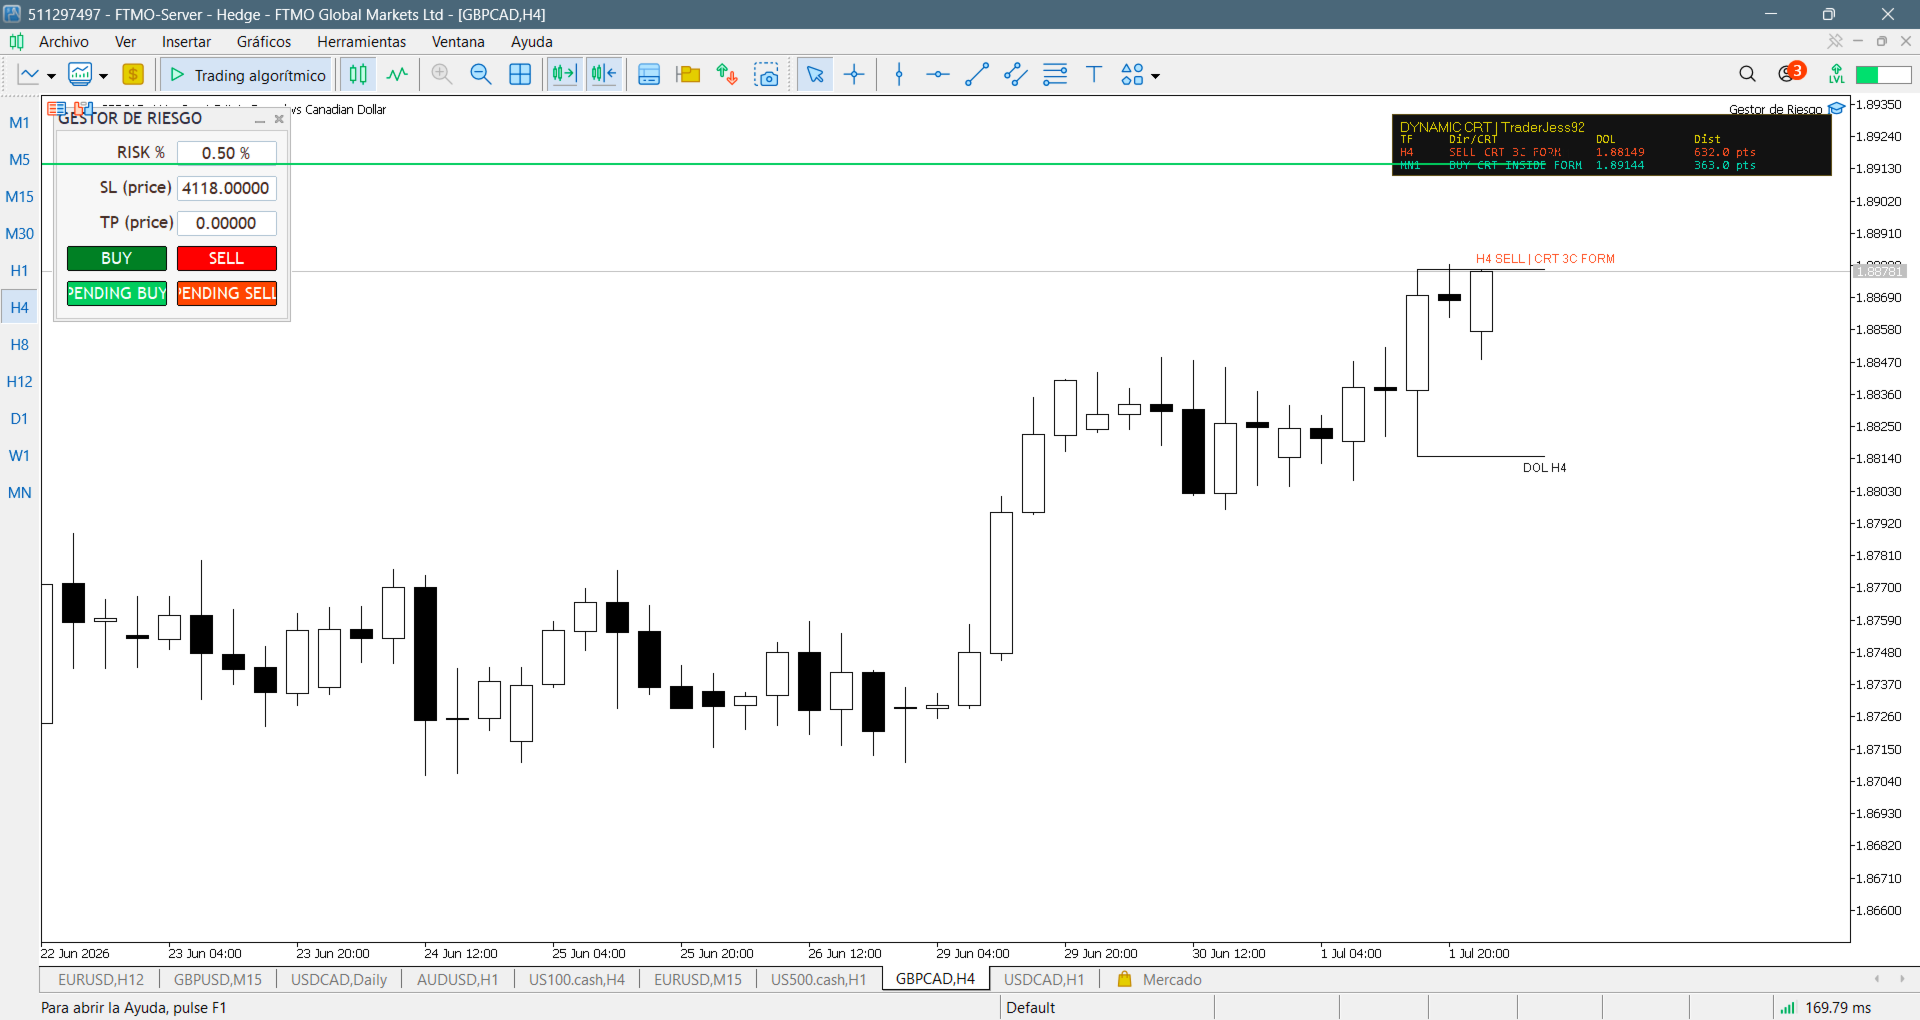
3-Candle CRT
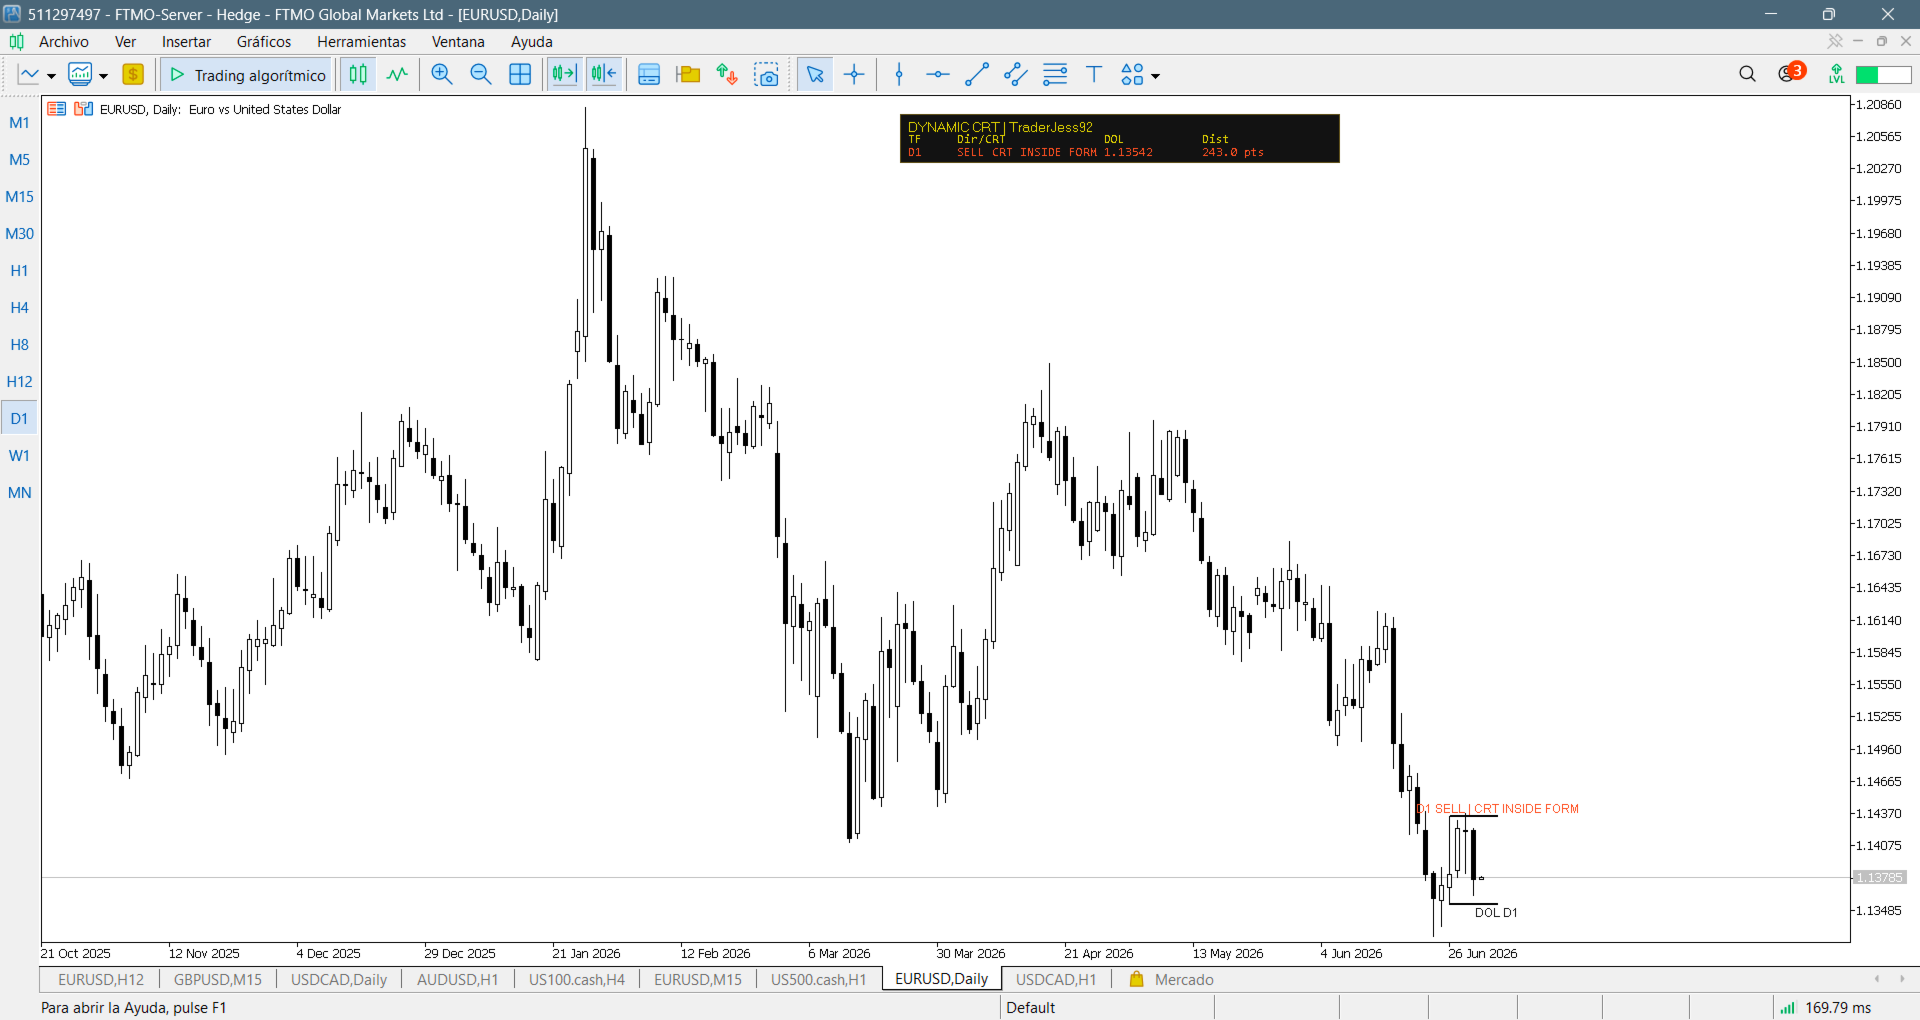
Inside CRT
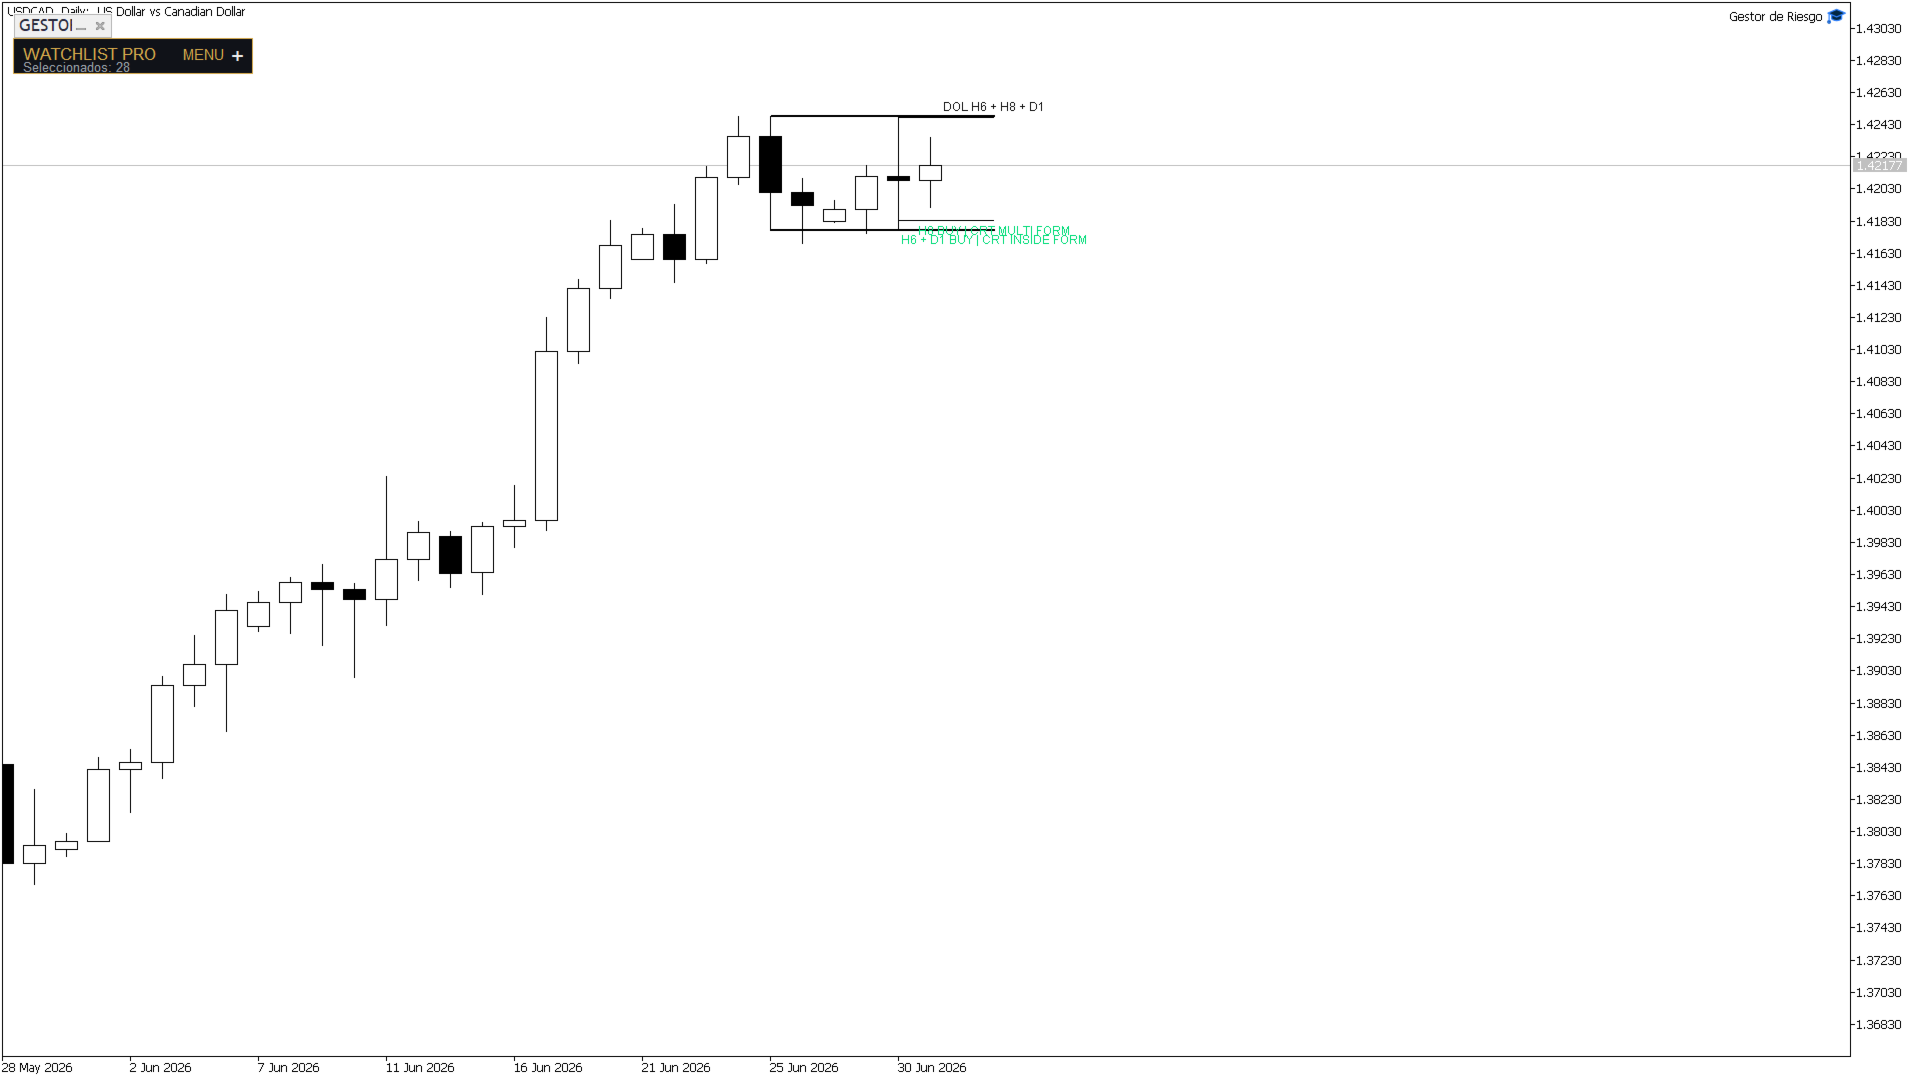
Multi-Candle CRT
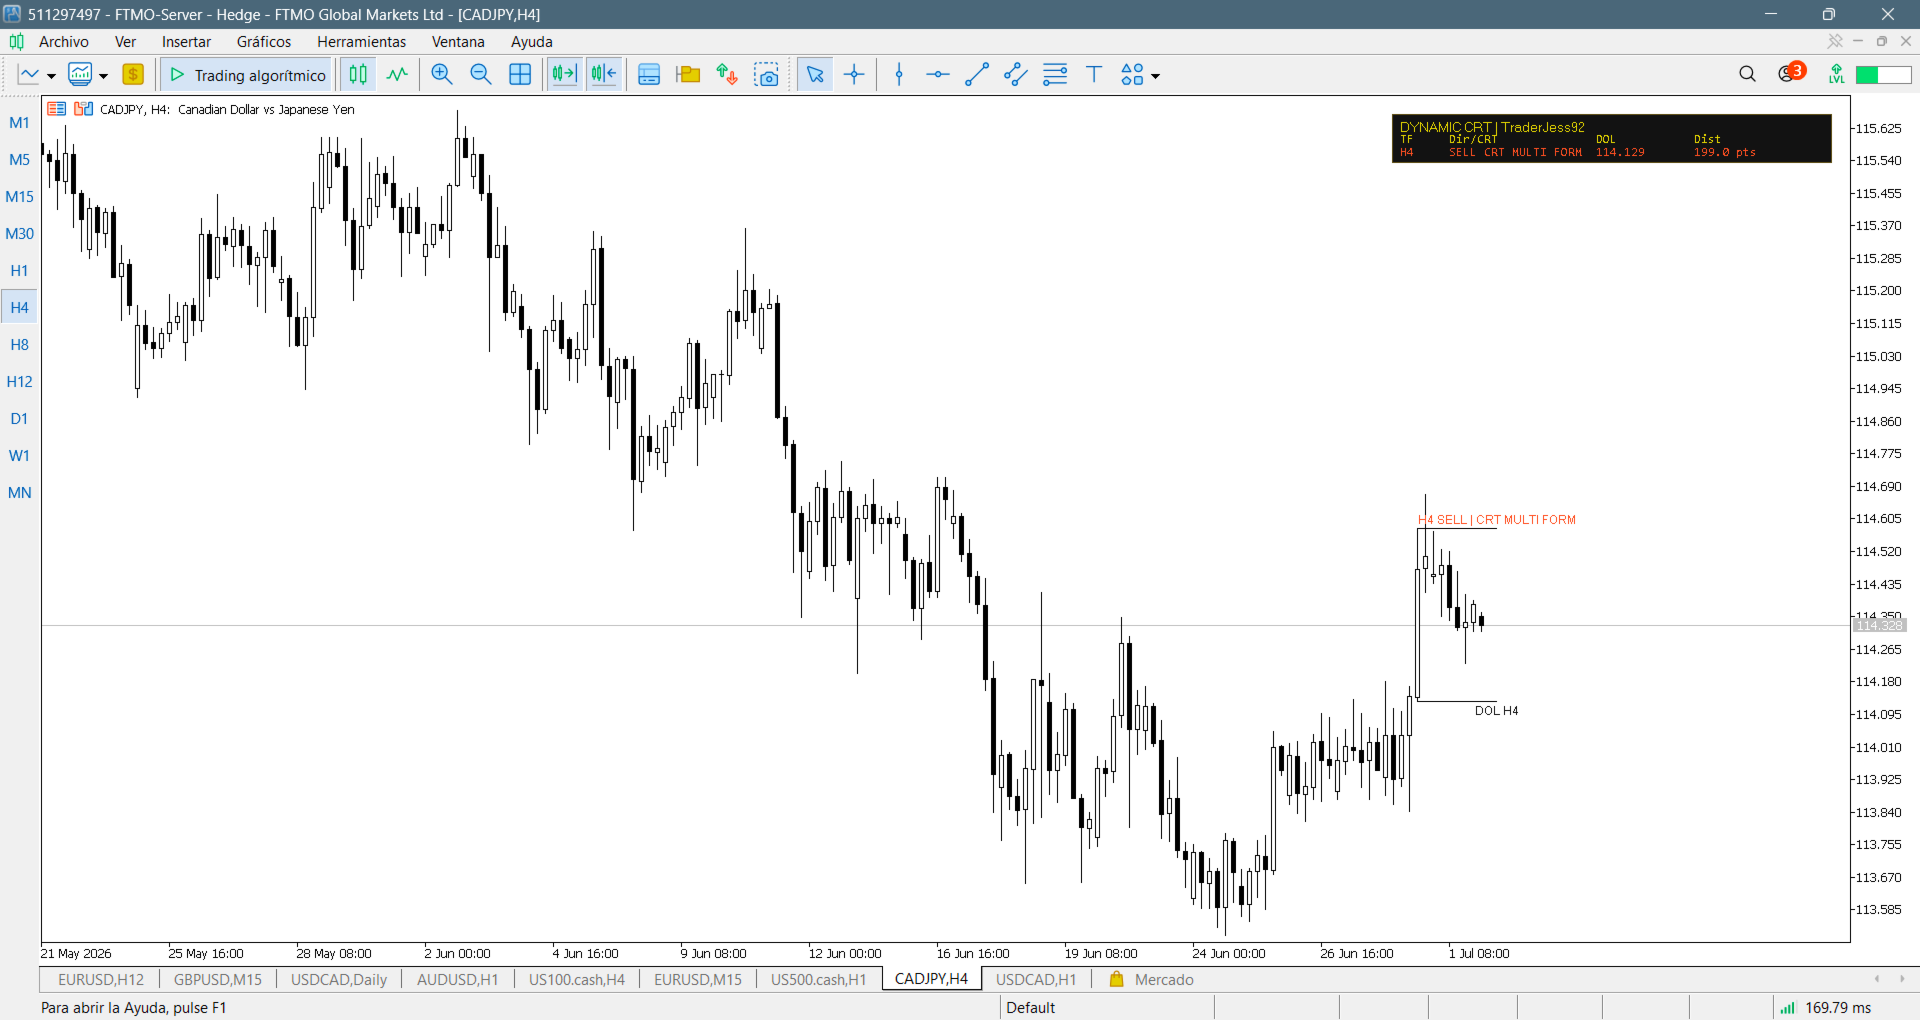
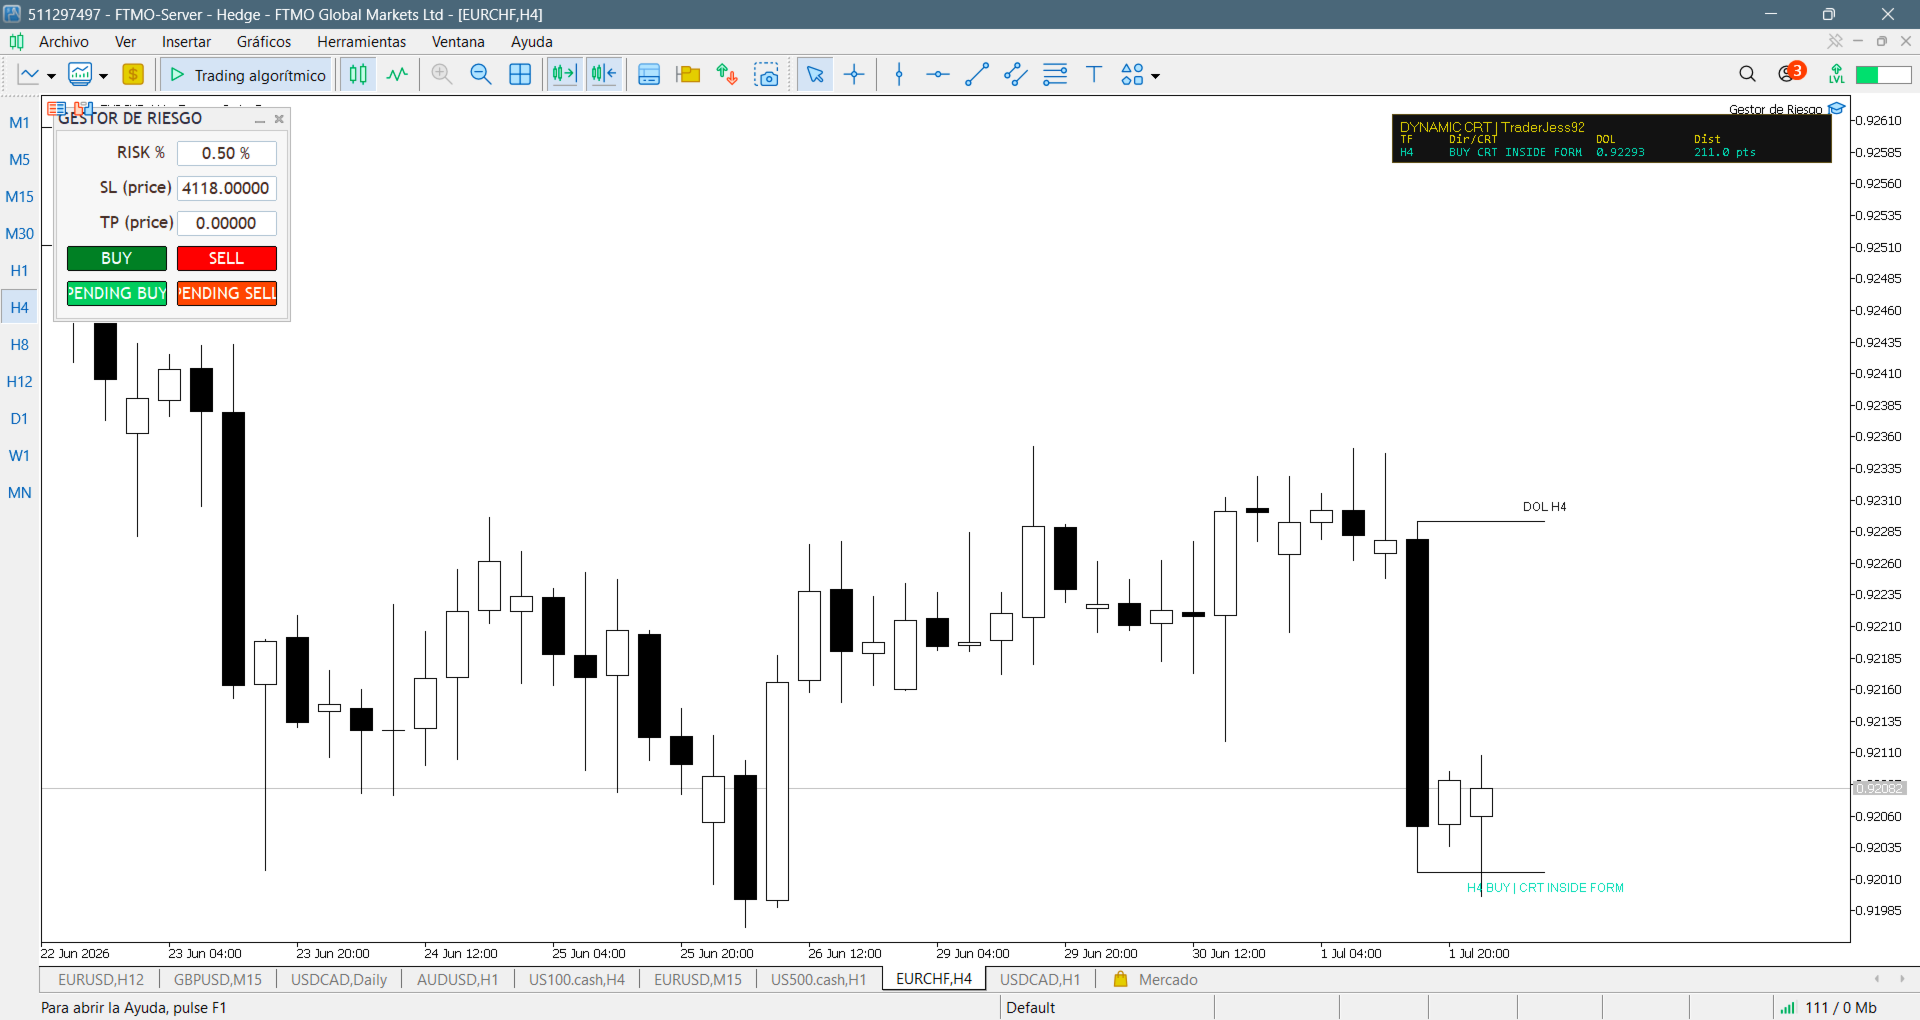
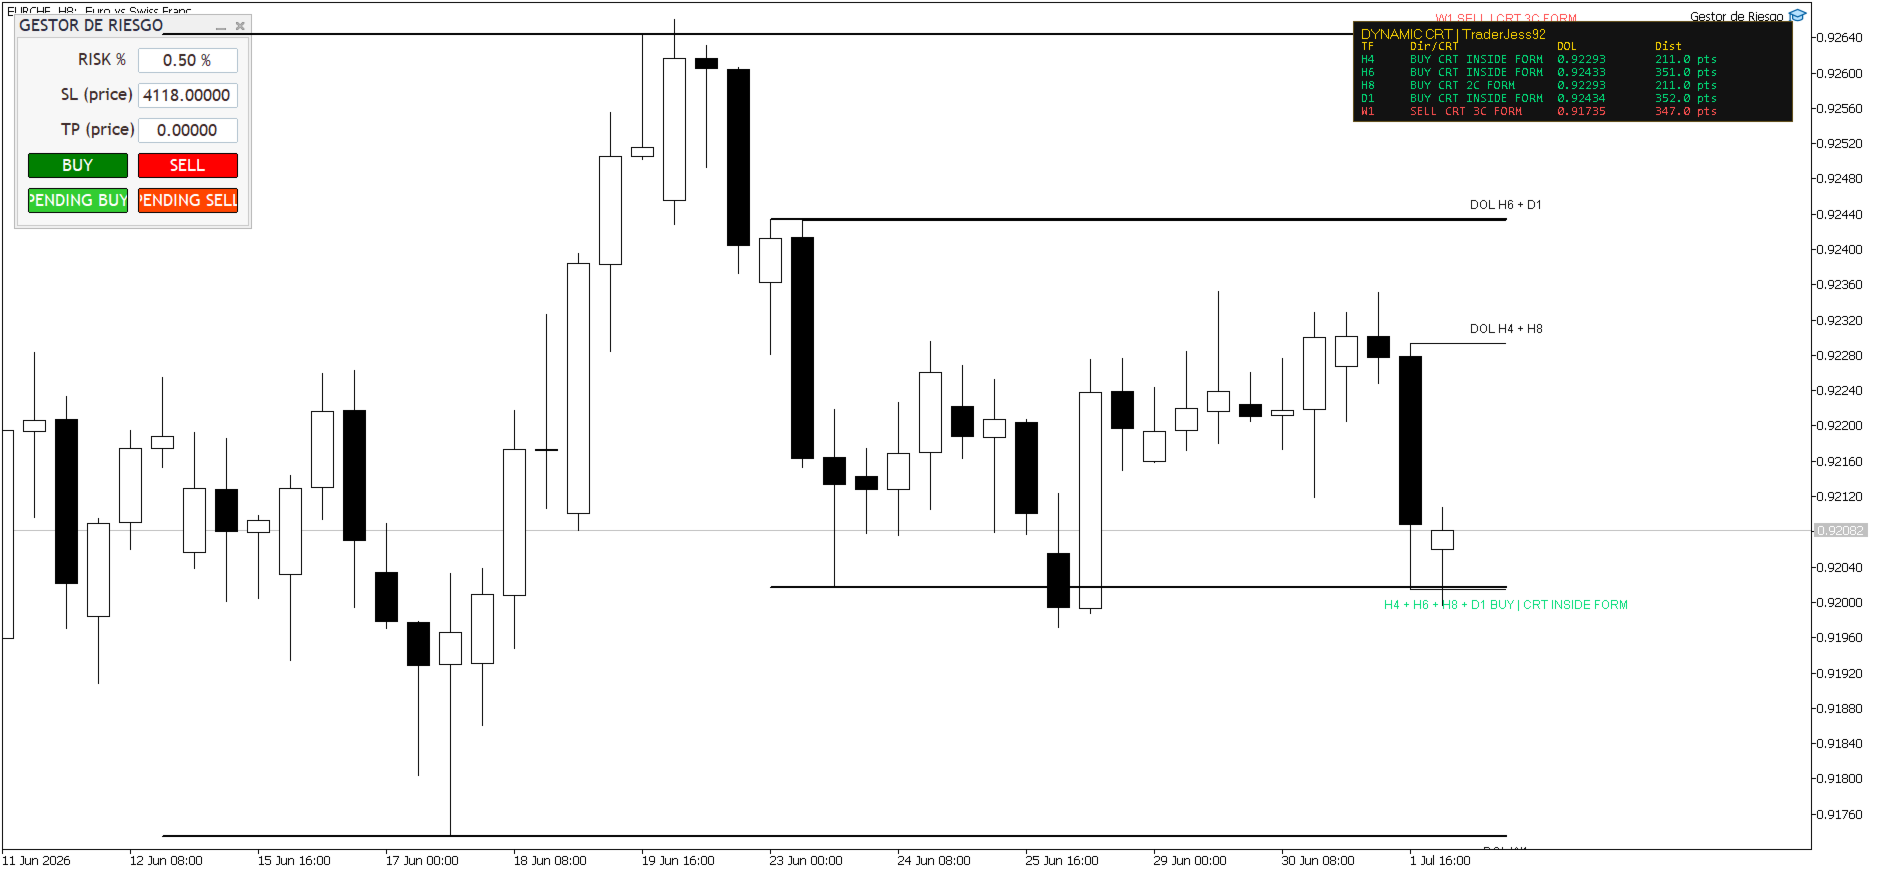
When a CRT range becomes active, the indicator displays its key levels directly on the chart, including the active range, the model direction, the DOL level and the distance in points to that target. This helps traders read the market context more clearly and make better decisions when applying the CRT strategy.
CRT Scanner MTF also includes an Active Ranges dashboard, where traders can see the timeframe of each active range, its direction, the detected CRT model, the pending DOL level and the current distance to the DOL. The indicator also helps identify aligned ranges across multiple timeframes, making multi-timeframe analysis cleaner and easier to manage.
This indicator does not open trades automatically. It is designed as a visual analysis tool for traders who want to improve their CRT range reading, liquidity analysis and multi-timeframe alignment.