Side Zone
- Göstergeler
- Sürüm: 1.0
- Etkinleştirmeler: 5

SideZone: Trend Intensity Oscillator – Filter the Noise, Ride the Trend
Overview
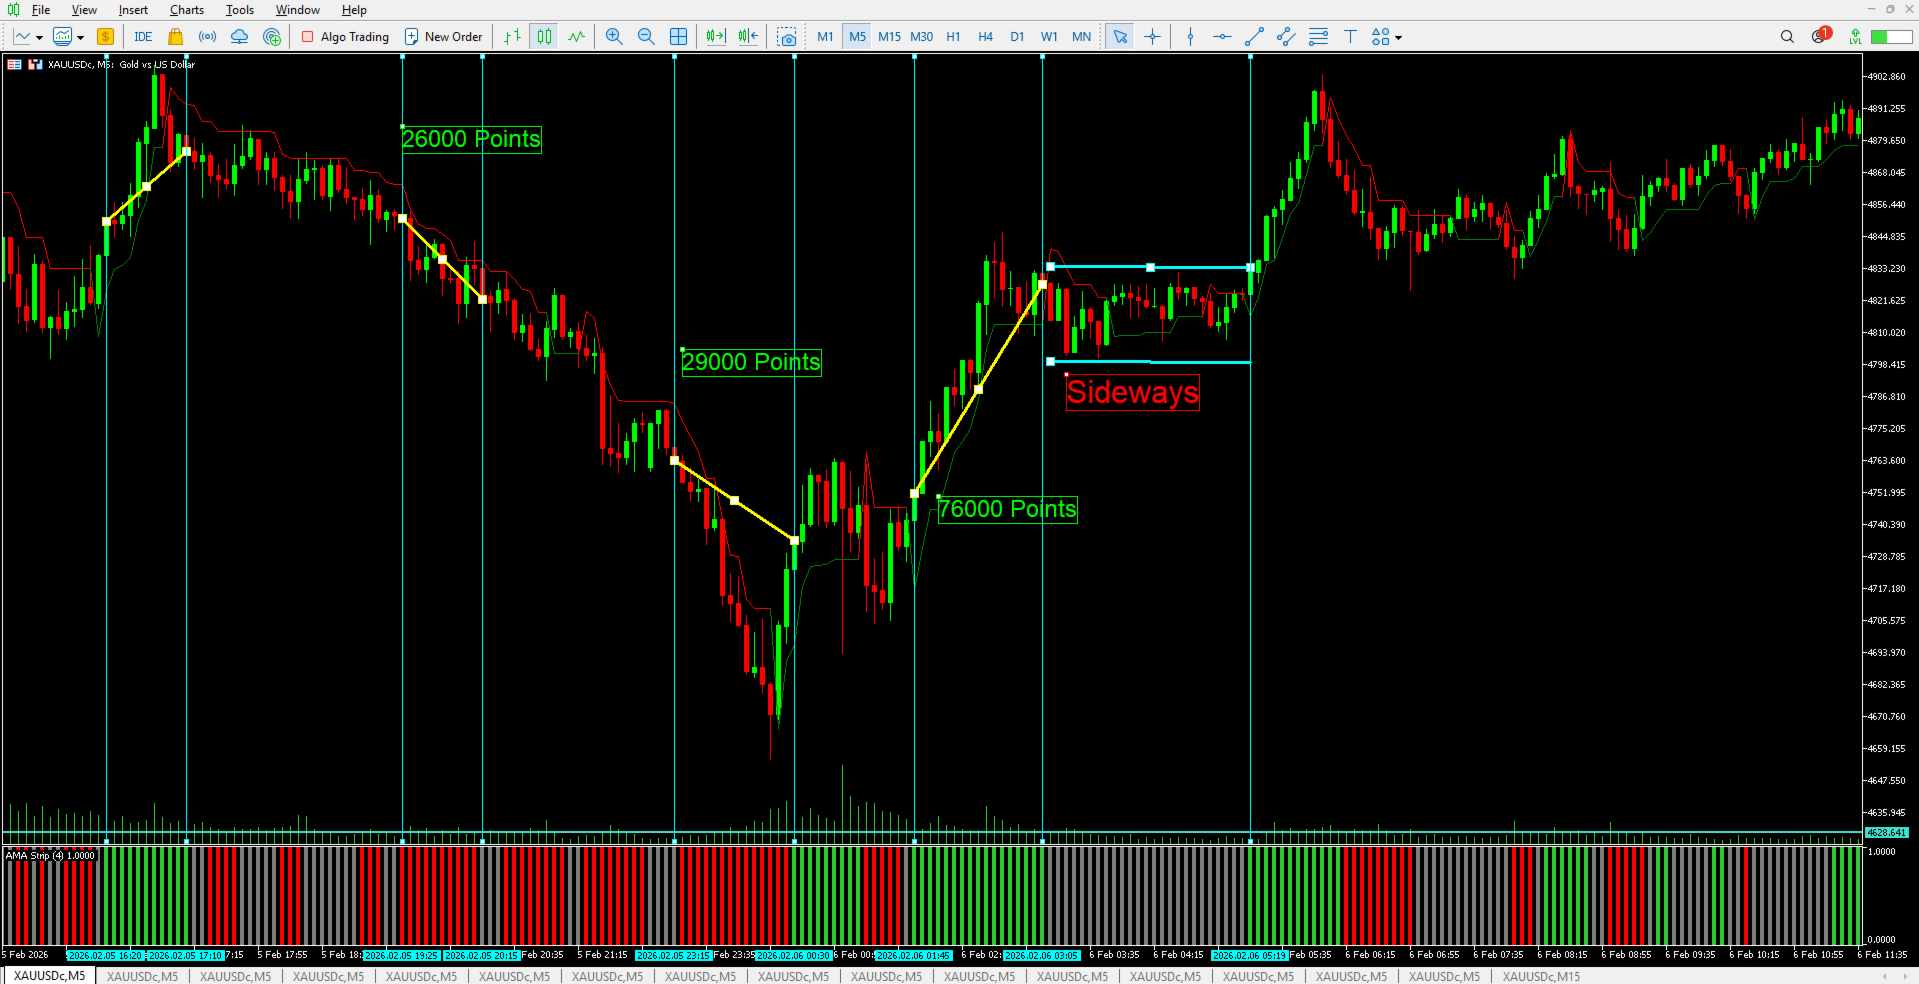
SideZone is a specialized oscillator engineered to solve a common trader's dilemma: distinguishing between a true trend and a ranging market. By clearly visualizing trend direction and sideways consolidation, SideZone helps you stay on the right side of the move while avoiding the whipsaw of low-volatility environments. Its core function is to provide a clear, color-coded visual representation of market sentiment directly on your chart.
Key Features & Functionality
This indicator processes market data to deliver an immediate visual context of price action:
-
Uptrend Strength (Green Histogram): When the histogram turns green, it signals the presence and intensity of upward momentum.
-
Downtrend Strength (Red Histogram): A red histogram indicates strong downward pressure and bearish momentum.
-
Sideways Market (Gray Histogram): When the market lacks a clear direction and consolidates, the histogram appears gray. This is a powerful signal to stand aside and avoid false breakouts.
[Placeholder for Screenshot 1: A clean chart showing the indicator in a separate window with distinct Green, Red, and Gray histograms.]
Why Use SideZone?
Many oscillators provide signals in all market conditions, often leading to poor entries during ranging periods. SideZone’s primary advantage is its ability to identify and highlight sideways action, allowing you to filter out low-probability trades. It acts as a sentiment filter, telling you when to trade (trending conditions) and when to wait (sideways conditions).
Input Parameters & Recommended Settings
To maximize performance, SideZone offers full customization. The key to its accuracy lies in adjusting the Sensitivity parameter based on the specific asset's volatility.
| Parameter | Default Setting | Description |
|---|---|---|
| Period 1 | 13 | Core calculation period for primary trend detection. |
| Period 2 | 2 | Secondary smoothing or signal period. |
| Period 3 | 30 | Longer-term lookback for context. |
| Sensitivity | 2000 | Adjusts the threshold for identifying sideways vs. trending markets. Crucial for different assets. |
| Price Type | Close Price | Defines the price data used for calculations (e.g., Close, Open, HL2). |
| Smoothing Period | 5 | Final smoothing applied to the histogram for cleaner visual output. |
A Note on Sensitivity:
The Sensitivity parameter is the most critical setting. It must be adjusted according to the volatility of the trading instrument.
-
For Gold (XAUUSD): After February 2026, the recommended starting point is 2000 points.
-
For other pairs: You will need to adjust this value. Lower values make the indicator more sensitive (identifying trends more easily), while higher values require stronger momentum to register as a trend, classifying more action as sideways. Always optimize this setting based on the Average True Range (ATR) of the asset you are trading.
[Placeholder for Screenshot 2: The indicator's input box highlighted, showing where to change the Sensitivity parameter.]
How to Use
SideZone is designed to be intuitive:
-
Apply the indicator to your MetaTrader 5 chart.
-
Adjust the Sensitivity parameter to suit the symbol's current volatility.
-
Look for Confluence: Trade in the direction of the green (long) or red (short) histograms.
-
Exercise Caution: When the histogram turns gray, it signals a sideways market. Avoid taking new trend-based positions and consider reducing trading activity.
Developer's Recommendations
SideZone is a powerful technical tool designed to interpret market sentiment, not a guaranteed profit system. It performs exceptionally well when used with discretion and as part of a comprehensive trading strategy. It does not predict the future but rather helps you analyze current market conditions with greater clarity. We recommend testing it thoroughly in a demo account to understand its behavior across different timeframes and assets before using it on a live account.
Important Disclaimer
Trading financial markets carries a high level of risk. This indicator is a tool for analysis; it does not provide financial advice. Past performance does not guarantee future results. Use this indicator with caution and sound risk management.