 MetaTrader 5
 Uzmanlar
 Göstergeler
 Kütüphaneler
 Yardımcı programlar
 Widget'lar
 Kurallar
YouTube'dan Mağaza ile ilgili öğretici videoları izleyin
Bir alım-satım robotu veya gösterge nasıl satın alınır?
Uzman Danışmanınızı
sanal sunucuda çalıştırın
sanal sunucuda çalıştırın
Satın almadan önce göstergeyi/alım-satım robotunu test edin
Mağazada kazanç sağlamak ister misiniz?
Satış için bir ürün nasıl sunulur?
MetaTrader 5 için yeni Uzman Danışmanlar ve Göstergeler - 531
 Forex alım-satımını daha karlı hale getirmek için alım-satım robotları ve göstergeler kullanın. Alım-satım robotları, işlem açma ve kapatma sürecini otomatikleştirmenize olanak tanırken, göstergeler piyasa davranışını daha doğru bir şekilde tahmin etmenize yardımcı olur.
Bu sayfa, MetaTrader 5 uygulamalarının kataloğunu içermektedir.
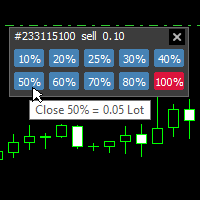
With this tool, you can easily and quickly close part of the trade. Click near the trade to display the closing panel. There are ten preset values for partial closing, but you can set your own values. You can also resize the panel according to Windows settings (125%, 150% ...) See the animation below for how it works. **********************************************************
Note: This tool does not work in the tester.

Some disadvantages of Rollover Scalper: Currently the markets aren't that favorable for night scalping because of the fundamentals, so the next few months the EA might show 0% or even negative return. However, it happened in the past too and it was still profitable over all ~20 years. It's a scalper, so you'll need a broker with low spread and good execution time, preferably an ECN broker. ICMarkets would be a good choice. It's susceptible to slippage (which can't be backtested or limited on ECN

With this indicator you have displayed on the chart the optimal lot size for the forex pair. No need for manual calculations or losing time on websites where you have to input the values to get the optimal lot size. The indicator values are preset for maximum percentage risk is 2% and for maximum pips loss is 50. For a customizable version you can buy using the this LINK . ATTENTION: This only works with forex pairs and it doesn't work on account deposits in YENS!!!!!!
FREE
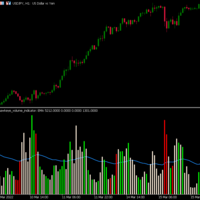
Hawkeye Volume Indicator contains a complex algorithm which executes over 300 calculations per bar in order to analyze the price action and associated volume, giving traders a tremendous advantage. Now Available in MT5 for U nlimited Use !
Volume is the only leading indicator which: .signals a price movement prior to it happening
.provides the fuel that drives the market Hawkeye Volume works in all markets and can be used in all timeframes for both tick and time charts – from longer term swing a

With this indicator you have displayed on the chart the optimal lot size for the forex pair. No need for manual calculations or losing time on websites where you have to input the values to get the optimal lot size. When adding the indicator to your chart change the values for maximum risk percentage (lossPrc) and for maximum loss in pips (lossInPips). If you like to try first the indicator you can download by clicking on this LINK . ATTENTION: This only works with forex pairs and it doesn't wor
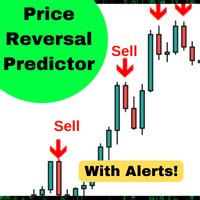
Bu algoritma, fiyattaki kısa vadeli değişiklikleri% 90 * doğrulukla öngörür. Fiyatın sinyal mumundan daha yüksek veya daha düşük olup olmayacağını tahmin eder. Daha büyük zaman dilimlerinde ortalama geri dönüş ticareti, ikili opsiyonlar veya vadeli işlem sözleşmeleri için mükemmeldir. Gösterge, 5 yıllık verilerle geriye dönük olarak test edildi ve zaman içindeki fiyat geri dönüşlerini tahmin etmek için% 90 doğruluğa sahip.
Özellikler: 1. Basit kurulum a. Herhangi bir grafiğe sürükleyip bırakın
FREE

DYJ CashRegisterEA DYJ teknik belirtilerinde çalışıyor. Pazar güçlü olduğunda ,
Bu EA'nin güvenli pazarların fırsatı ve ticareti. Satış zamanıyla uygun kazanmak.
EA, transaksyon sesini azaltmak ve kaza kapatma algoritmi stratejisini azaltmak için bir sıra modunu kullanır.
İnternet ticareti yok.
Araştırma yok.
Hedge yok.
Martingale yok.
Please download the setting file and the PDF file of the back test report in the product comment area
Recommendations
Synthetic and Forex. Developed for M1, Cra
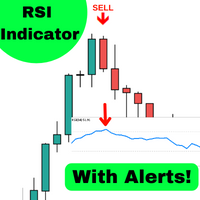
Bu algoritma, fiyattaki kısa vadeli değişiklikleri% 86 * doğrulukla öngörür. ATR tarafından belirlenen büyük bir hareket olduğunda, aşırı alım veya aşırı satım durumu sırasında gösterge sizi uyaracaktır. Fiyatın sinyal mumundan daha yüksek veya daha düşük olup olmayacağını tahmin eder. Daha büyük zaman dilimlerinde ortalama geri dönüş ticareti, ikili opsiyonlar veya vadeli işlem sözleşmeleri için mükemmeldir. Gösterge, 5 yıllık verilerle geriye dönük olarak test edildi ve zaman içindeki fiyat g
FREE
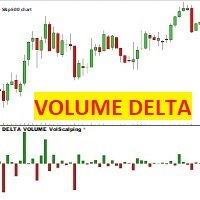
HACİM DELTA Volscalping Bu gösterge, her fiyat mumu için, alınan ve satılan sözleşmeler arasındaki fark olan bir Delta mumu çizer. Teklifte işlem gören (satılan) sözleşmeler satıştaki sözleşmeleri aşarsa mum kırmızı ve negatif, aksine ASK'da işlem gören (alınan) sözleşmeler teklifteki sözleşmeleri aşarsa mum yeşil ve pozitif olacaktır.
DİKKAT: Gösterge yalnızca gerçek piyasa veri akışı sağlayan ve imzalanan sözleşmeleri BID ve ASK olarak ayıran brokerlerle çalışır. Forex, CFD'ler ve Kripto pa
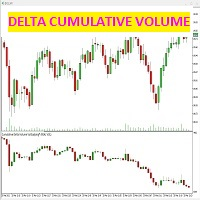
bu gösterge, her bir mum için teklifte ve talepte (saldırganlık) yapılan sözleşmeler arasındaki farkı tespit eder.
gösterge, fiyat grafiğinin altındaki özel pencerede, tam olarak satılan ve satın alınan sözleşmeler arasındaki farkla verilen ve piyasanın hacimsel gücünü oluşturan mumları gösterir.
(ekran görüntülerinden bakın) sadece kümülatif mum delta grafiğinin nasıl seçileceği veya hatta mumların kendi trend çizgisi ile nasıl seçileceği mümkündür: ikinci kutuyu seçerek u "HİÇBİR" trend çiz
genel bakış:
Çatallı yüzücü, belirli saat ve/veya günlerde bir EA açılış çiftliğidir. Kâr Al, ATR oranı kullanılarak dinamik olarak oluşturulur.
Gereksinimler:
Straddle'ları açmak için bir riskten korunma hesabına ihtiyaç vardır. Sıkı bir optimizasyon (açık fiyatlarla) zorunludur.
straddle nedir?
Bir straddle, aynı anda bir Alış ve Satış açma eylemidir.
Bu EA nasıl çalışır?
Başarılı bir şekilde optimize edildikten sonra EA, optimizasyon tarafından belirlenen her yeni çubukta (H1 Zaman Çe

KT Coppock Curve, yumuşatılmış bir momentum okumasını piyasa yönünün net bir görünümüne dönüştürür. Gösterge fiyat grafiğinin altındaki ayrı bir pencerede çalışır ve sıfır çizgisi ana referans noktasıdır. Eğrideki her küçük değişime tepki vermek yerine momentumun yükseliş veya düşüş tarafında kalıp kalmadığını hızlıca görebilirsiniz. Eğri, daha uzun ve daha kısa dönemli değişim oranlarını birleştirir ve sonucu yumuşatır. Böylece daha geniş momentum değişimlerini takip etmeye yardımcı olurken hız
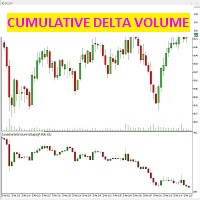
bu gösterge, her bir mum için teklifte ve talepte (saldırganlık) yapılan sözleşmeler arasındaki farkı tespit eder.
gösterge, fiyat grafiğinin altındaki özel pencerede, tam olarak satılan ve satın alınan sözleşmeler arasındaki farkla verilen ve piyasanın hacimsel gücünü oluşturan mumları gösterir.
(ekran görüntülerinden bakın) sadece kümülatif mum delta grafiğinin nasıl seçileceği veya hatta mumların kendi trend çizgisi ile nasıl seçileceği mümkündür: ikinci kutuyu seçerek u "HİÇBİR" trend çiz

THIS EA HAD A WINRATE OF 80% !!!
How to use: The EA must be attached to ONLY one chart Symbol must be EURUSD . Timeframe should be M5. Minimum deposit 100 USD. Recommended leverage 1:50 - 1:500. The EA should run on a VPS continuously. Recommended Inputs:
Use Risk Percent: true Risk Percent: 1 Lot Size: 0.01 Target Points: 100 Magic Number: 123456789
Recommended broker: XM or any broker that has a lower spread. If you choose XM as your broker please select MT5 for trading platform type an

ROC, fiyatın önceki bir döneme kıyasla ne kadar hızlı değiştiğini ölçer. Bu nedenle fiyat yeni bir salınım tepesi veya dibi oluştururken hareketin arkasındaki momentum bunu doğrulamadığında özellikle kullanışlıdır. KT ROC Divergence bu uyumsuzlukları otomatik olarak bulur ve fiyat grafiği ile ROC penceresinde birbirine karşılık gelen çizgiler çizer. Sabit bir aralıkta kalan osilatörlerin aksine ROC, piyasanın hızına göre genişler ve daralır. Ham değeri farklı semboller arasında karşılaştırmanız

Göstergemiz, aynı anda birden fazla çiftin yayılmasını izlemek için bir yayılma ayırıcı sağlar ve ayrıca bir mum zamanlayıcı geri sayımı, mevcut çubuk kapanmadan ve yeni bir çubuk oluşmadan önce kalan süreyi görüntüler.
SINIRLI SÜRELİ TEKLİF: Tüm premium göstergelerimiz sadece 50$ karşılığında mevcuttur, MQL5 blogumuza erişerek premium göstergelerimizin tüm ayrıntılarını bulacaksınız. Buraya Tıkla.
Ana Özellikler Aynı anda yayılan çoklu çiftleri izleyin. Yerel saati değil, sunucu saatini iz
FREE
Çift çizgi sinyalleri, sıfır seviye sistemi, çoklu zaman dilimi desteği, özelleştirilebilir görsel sinyaller ve yüksek oranda yapılandırılabilir uyarı sistemi ile gelişmiş Göreli Güç Endeksi (RVI) göstergesi.
Serbest programlama hizmetleri, güncellemeler ve diğer TrueTL ürünleri MQL5 profilimde mevcuttur.
Geri bildirim ve incelemeler çok değerlidir!
Göreli Güç Endeksi (RVI) Nedir? Göreli Güç Endeksi (RVI), John Ehlers tarafından geliştirilen bir momentum osilatörüdür; ticaret aralığına göre n
FREE
Hangi forex seansında işlem yaptığınızı ve her seansın kaç pip hareket ettiğini doğrudan MetaTrader 5 grafiğinizde görün. KT Forex Sessions MT5, Tokyo, Londra ve New York seanslarını renkli kutular olarak çizen ve her seansın büyüklüğünü pip cinsinden kendi kutusunun üzerine yazan bir seans indikatörüdür. İndikatör brokerınızın GMT farkını kendisi okur ve her seans kendi şehrinin yerel saatini ve yaz saatini takip eder. Kutular bütün yıl doğru yerde durur, ayarlamanız gereken hiçbir şey yoktur.
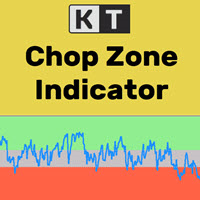
Finansal piyasalarda zamanın yalnızca %30’u trend hareketlerle geçerken, geri kalan %70’i yatay yani belirli bir aralıkta dalgalanarak geçer. Ancak, çoğu yeni başlayan yatırımcı için piyasanın gerçekten bir trend içinde mi yoksa yatay bir aralıkta mı hareket ettiğini anlamak oldukça zordur. KT Chop Zone bu sorunu çözmek için geliştirilmiştir. Piyasa durumunu açıkça üç bölgeye ayırarak gösterir: Ayı Bölgesi, Boğa Bölgesi ve Chop Zone (Yatay Bölge).
Özellikler
Yatay piyasalarda işlem yapmaktan ka
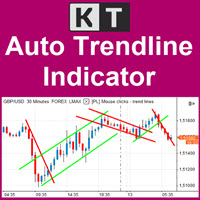
Önemli trend çizgilerini grafikte güncel tutun KT Auto Trendline, son ZigZag salınım noktalarından otomatik olarak bir üst ve bir alt trend çizgisi oluşturur, ardından iki çizgiyi de aktif grafikte ileriye doğru uzatır. Böylece aynı çizgileri sürekli elle yeniden çizmeden oluşan kırılmaları, tepkileri ve fiyat yönündeki değişimleri net bir yapı üzerinden izleyebilirsiniz. Yakın ve daha geniş salınım yapısını birlikte takip edin İlk trend çizgisi seti varsayılan olarak etkindir ve daha duyarlı bi
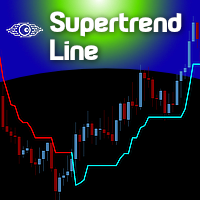
The Supertrend indicator was originally created by a french fellow named Olivier Seban , and its goal is to identify the Primary Trend of prices . Its calculation is easy and based on the average of Highs and Lows and then we add the volatility of a custom period, plus a multiplier. This way we get the Supertrend Line. You can find in the web several approaches and trading strategies using this very useful indicator.
HOW TO "READ" THIS INDICATOR
If the closing prices are above Supertrend Line,
FREE

An equity protection EA for MetaTrader that enforces your loss limits and profit target for you: when your account reaches a rule you set, it closes your trades on every symbol, before one bad day turns into a lost account. It suits prop firm challenges and personal accounts alike. Attach it to one chart, answer a few questions in the on-chart setup wizard, and it watches your whole account in the background while you trade by hand or with other EAs. What it protects Daily loss limit: a percenta

The Analytical cover trend indicator is a revolutionary trend trading and filtering solution with all the important features of a trend tool built into one tool! The Analytical cover indicator is good for any trader, suitable for any trader for both forex and binary options. You don’t need to configure anything, everything is perfected by time and experience, it works great during a flat and in a trend.
The Analytical cover trend indicator is a tool for technical analysis of financial markets

Stargogs Spike Catcher EA V3 !!!PLEASE MESSAGE ME AFTER PURCHASING THE EA I WILL HELP AND SET IT UP FOR YOU OR I'LL SEND YOU THE RIGHT SETFILES!!! !!! IMPORTANT THIS ROBOT WON'T WORK OR MAKE PROFIT WITH DEFAULT SETTINGS!!! With The Right Settings so that you can make your daily or monthly Income. This Is the best version so far. With the right Parameters you won't fail. I will also show you the results. In Version 3.0 you can Switch on/off to Choose on which indices to catch spikes on Boom and
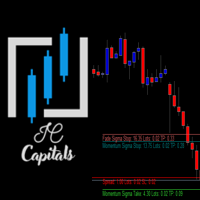
Key Features: Multi-Target Volatility: Configure multiple Take Profit and Stop Loss levels based on real-time market volatility. Fully Customizable: Set specific volatility multipliers (e.g., 4x for Stop, 10x for Take) using any look-back period (e.g., previous 20 bars on a 2-minute chart). Clear Visuals: Assign unique names to each level to be displayed directly on your symbol's chart for easy monitoring. Consistency: Every level calculated is synchronized with the volatility of your chosen per
FREE

Volume profile indicator that tells you which levels price is likely to reach today. Daily profiles with POC, VAH and VAL, naked POCs and a drag box for any range, and every level labelled with how often price reached a level at that distance on your own chart. What you see on the chart A profile for every day on M1 to H1 charts, with the value area in a stronger colour. Yesterday's POC, VAH and VAL across today, each with its odds for today, or "reached" once price gets there. Naked POCs: earli

According to Sir Isaac Newton's 3rd law, every action has its reaction and every movement must be compensated by an opposite movement of equal magnitude. The market cannot be oblivious to this physical principle, so when the force of gravity in the market of the big sharks hides like the sun behind the horizon, the night session allows us to see this law in all its splendor. This EA takes advantage of this movement to trade in the night session . Newton´s third law is designed to operate in the
Smart Moving Averages Indicator Smart Moving Averages is an exclusive indicator for Metatrader platform.
Instead of calculating moving averages for the selected chart time frame, the Smart Moving Averages indicator gives you the opportunity to calculate moving averages independently from the chart time frame.
For instance you can display a 200 days moving average in a H1 chart.
Inputs of the indicator are:
Timeframe : timeframe to be used for the calculation of the moving average Period : m

OBOS indicator
OBOS Indicator is an exclusive indicator to spot entries based on price action.
The OBOS Indicator is both effective and user friendly.
Indicator uses simple color codes and levels to indicate Overbought and Oversold conditions. No more headache.
The OBOS Indicator will only gives you indication when there are possible entries. Means you only get useful information.
Inputs of the indicator are:
MaxBars : number of bars to display in your chart Smoothing period : number of b
Tick imbalance bars (TIB), described in the book Advances in Financial Machine Learning (2018) by Marcos López de Prado. Indicator that show candlestick bars with an different sampling method than time fixed. Real time data is sourced to the indicator and it may be used as substitute of the default graph. Each bar is formed when a predefined tick balance is exceeded, showing in the graph the OHLC of this cluster of ticks. The input variable is the amount of ticks of each bar. The indicator may
FREE
Assistant_for_Reopen - an Expert Advisor that helps to re-set pending orders. Many brokers force the order to expire at the end of the trading session or at the end of the trading day. Therefore, a trader has to restore all pending orders manually every time at the beginning of a new trading session. Assistant_for_Reopen frees the trader from this routine work. It controls expiration by the order expiration time and resets it if the trader ticked the checkbox. The maximum number of orders the EA
FREE
Daily Pivots Multi Indicator Daily Pivots Multi is an exclusive indicator to draw your pivots levels and much more.
Most indicators draw daily pivots for the day. Daily Pivots Multi is able to draw levels for different days.
The indicator can do the calculation for unlimited number of days backward. It means that you can draw the levels for today but also for the past days.
This is very useful if you want to study a strategy with Pivots levels over a period of time.
Another problem is that e
Breakout Impulse Indicator Breakout Impulse Indicator is a pattern recognition indicator for Forex, Stocks, Indices, Futures, Commodities and Cryptos.
The Breakout Impulse is a multi-bar pattern.
The purpose of the pattern is to identify a fast change in momentum.
This type of change can announce the start of a big directional move.
Inputs of the indicator are:
Distance : distance in pixel relative to top or bottom of candle to display the arrow symbol MaxBars : number of bars back used to
Matrix Indicator Matrix Indicator is a simple but effective indicator.
Matrix indicator displays usual oscillators indicators in a user friendly color coded indicator.
This makes it easy to identify when all indicators are aligned and spot high probability entries.
Inputs of indicator are:
Indicator: RSI, Stochastic, CCI, Bollinger Bands Param1/Param2/Param3: usual settings for the indicator ValueMin: Oversold level for oscillator ValueMax: Overbought level for oscillator The indicator can
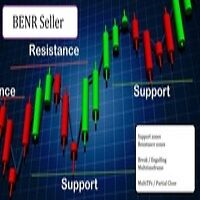
This EA allows you to manage support and resistance zones on MetaTrader 5…but not only: To your buying and selling zones (you can configure 2 sellings zones and 2 buyings zones),
you can add 3 options (2 with multiframes) to enter a position:
Option 1: this is the option that enters a position without a signal: as soon as the price reaches the zone, the robot sends a trade.
Option 2: here the robot will wait for a break in the selected timeframe. Example: you put your zones on an H4 graph (fo

Professional robot Move reliably , which implements the classic MACD trading strategy. The signal from the intersection of the signal line with the main MACD line. When the signal line crosses the main line from top to bottom, it will be a buy signal, if the signal line crosses the main line from bottom to top, it will be a sell signal. In other cases, the absence of a signal will be recorded. Also, the signal can be inverted. The principle of operation is very simple and reliable. Gives a smal
The indicator is a trading system for AUDUSD or NZDUSD currency pairs.
The indicator was developed for time periods: M15, M30.
At the same time, it is possible to use it on other tools and time periods after testing.
"Kangaroo Forex" helps to determine the direction of the transaction, shows entry points and has an alert system.
When the price moves in the direction of the transaction, the maximum length of the movement in points is displayed.
The indicator does not redraw, all actions occ
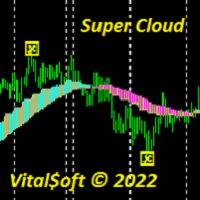
The Super Cloud indicator helps to determine the direction of the trend when trading. Shows on the chart signals about a possible upcoming trend change. The indicator provides an opportunity to detect various features and patterns in price dynamics that are invisible to the naked eye. Based on this information, traders can anticipate further price movement and adjust their strategy accordingly. Works on all timeframes except MN.
Trend Direction ADX indicator Trend Direction ADX is part of a serie of indicators used to characterize market conditions.
Almost any strategy only work under certain market conditions.
Therefore it is important to be able to characterize market conditions at any time: trend direction, trend strength, volatility, etc..
Trend Direction ADX is an indicator to be used to characterize trend direction:
trending up trending down ranging Trend Direction ADX is based on ADX standard indicator.
Tre

Trend Strength MA indicator Trend Strength MA is a part of a series of indicators used to characterize market conditions.
Almost any strategy only works under certain market conditions.
Therefore, it is important to be able to characterize market conditions at any time: trend direction, trend strength, volatility, etc.
Trend Strength MA is an indicator to be used to characterize trend strength:
Up extremely strong Up very strong Up strong No trend Down strong Down very strong Down extremely

Trend Direction Up Down Indicator Trend Direction Up Down is part of a series of indicators used to characterize market conditions.
Almost any strategy only works under certain market conditions.
Therefore it is important to be able to characterize market conditions at any time: trend direction, trend strength, volatility.
Trend Direction Up Down is an indicator to be used to characterize trend direction (medium term trend):
trending up trending down ranging Trend Direction Up Down is based
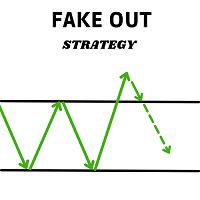
This expert advisor finds and operates the Fake out pattern, the search algorithm and its management can be adjusted from the Bot's configuration parameters.
Features: - Designed to operate with any type of asset.
- It is possible to set the time range in which the expert advisor will operate.
- Trailing stop managed internally by the algorithm.
- Partial position closing (partial profit taking), when the price has moved in favour of the position.
- Take profit automatically adjusted by t

Only 5 copies of the EA at $30! Next price --> $45 This robot works on the basis of bowling band and has stepped entrances at safe points.
benefits:
Works on all instruments and time series,
It has excellent inputs for position management that can avoid a lot of risk.
Input settings:
Volume: Selects a fixed volume for the trade that uses its own risk management if it is zero.
Risk for all positions: The amount of risk for all positions in one direction, for exam

BEHOLDD!!!!!!!
Investogenie is now in the Market. The Profound Algorithm designed in investogenie helps in scalping in the quiet time at night with a Stop Loss. The Markets conditions help the EA to decide taking the entries and exits at the proper time. Backtests and results are evident of the strength of the product.
Live results will be updated soon.
RECOMMENDATION
PAIRS: All Currency pairs
TIMEFRAME: This is Designed on M5 only
Use the set file in comment 3 or DM me
LIVE MONITORING
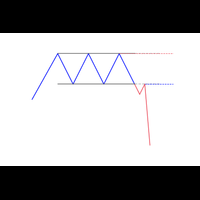
A new box will be added, if the closing price is higher than the maximum (lower than the minimum) of the current box series no less than for the specified value. Reversal will be made, if the closing price is higher (lower) than the last box on a value no less than the specified.
T his is a trend indicator and it can be used as an alternative for the trend definition instruments which use averaging.

KT Risk Reward shows the risk-reward ratio by comparing the distance between the stop-loss/take-profit level to the entry-level. The risk-reward ratio, also known as the R/R ratio, is a measure that compares the potential trade profit with loss and depicts as a ratio. It assesses the reward (take-profit) of a trade by comparing the risk (stop loss) involved in it. The relationship between the risk-reward values yields another value that determines if it is worth taking a trade or not.
Features
Be sure to consult with me before buying.
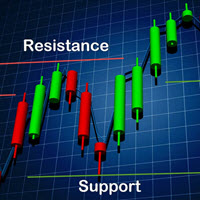
The robot trades based on support and resistance levels. You can use weekly and monthly times for less risk. More risk in daily and 4-hour times. Be sure to disable the robot at news times.Works on all currency pairs, indices, commodities and metals. Only observing the trade at the time of news will make this robot profitable. Automatic news management will be added in future versions.
benefits:
Works on all instruments and time series,
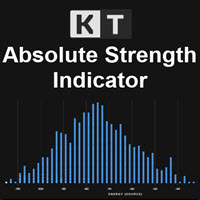
KT Absolute Strength measures and plots the absolute strength of the instrument's price action in a histogram form. It combines the moving average and histogram for a meaningful illustration. It supports two modes for the histogram calculation, i.e., it can be calculated using RSI and Stochastic both. However, for more dynamic analysis, RSI mode is always preferred.
Buy Entry
When the Absolute Strength histogram turns green and also it's higher than the previous red column.
Sell Entry
When th
KT Custom High Low shows the most recent highs/lows by fetching the data points from multi-timeframes and then projecting them on a single chart. If two or more highs/lows are found at the same price, they are merged into a single level to declutter the charts.
Features
It is built with a sorting algorithm that declutters the charts by merging the duplicate values into a single value. Get Highs/Lows from multiple timeframes on a single chart without any fuss. Provide alerts when the current pri
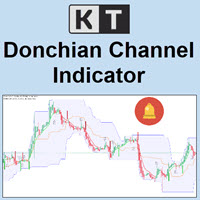
KT Donchian Channel is an advanced version of the famous Donchian channel first developed by Richard Donchian. It consists of three bands based on the moving average of last high and low prices. Upper Band: Highest price over last n period. Lower Band: Lowest price over last n period. Middle Band: The average of upper and lower band (Upper Band + Lower Band) / 2. Where n is 20 or a custom period value is chosen by the trader.
Features
A straightforward implementation of the Donchian channel ble
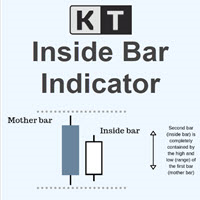
KT Inside Bar plots the famous inside bar pattern in which the bar carries a lower high and higher low compared to the previous bar. The last bar is also known as the mother bar. On smaller time-frames, the inside bar sometimes appears similar to a triangle pattern.
Features
Also plots entry, stop-loss, and take-profit levels with the inside bar pattern. No complex inputs and settings. Erase unwanted levels when the price reaches the entry line in either direction. All Metatrader alerts include
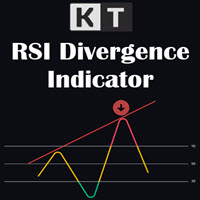
KT RSI Divergence shows the regular and hidden divergences built between the price and Relative Strength Index (RSI) oscillator. Divergence can depict the upcoming price reversal, but manually spotting the divergence between price and oscillator is not an easy task.
Features
Ability to choose the alerts only for the divergences that occur within an overbought/oversold level. Unsymmetrical divergences are discarded for better accuracy and lesser clutter. Support trading strategies for trend reve

THEN vs NOW. Then: the first SELL could only start when BUY orders were allowed, and a refused order still moved the grid. Now: each side has its own switch, and the ladder moves only after the broker confirms a fill. What changed for you: a new TO TARGET and NEXT LEVEL readout tells you, in pips, how far price is from closing each basket and from adding the next level. Works with: hedging and netting accounts, manual trades and other EAs on the same symbol (everything is filtered by symbol and

Best indicator for MT5 providing accurate and sniper signals to enter a trade without repainting!
It can be applied to any financial assets: forex, synthetic, cryptocurrencies, metals, stocks, indices . It will provide pretty accurate trading signals and tell you when it's best to open a trade and close it. Most traders improve their trading results during the first trading week with the help of the Power Indicator Pro.
Benefits of the Power Indicator Pro
Entry signals without repaint

Hunt markets with Hunttern ZigZag . Easy to use with one parameter
You can use it for the following: -Classic patterns -Heads and shoulders -Harmonic patterns -Elliott Wave -Support and resistance -Supply and Demand
Single parameter: -Period (1-120)
Features: -Candle time -Single parameter -Light mode template
This is version 1 of Hunttern ZigZag. We are very happy to receive feedback from you.
FREE

主要城市的时间。北京时间、东京时间、悉尼时间、惠灵顿时间、纽约时间、法兰克福时间、伦敦时间、迪拜时间。 城市时间可选择开启或者关闭。 点差变色提醒。设置点差提醒点数,例如,设置100点,点差大于100点,文字会变红色。 Time in major cities. Beijing time, Tokyo time, Sydney time, Wellington time, New York time, Frankfurt time, London time, Dubai time. City time can be turned on or off. Dot difference color change reminder. Set the point difference reminder points. For example, set 100 points. If the point difference is greater than 100 points, the text will turn red.
FREE

EA PRO is a 100% adaptive expert advisor based on price action, indicators and chart patterns. It has a built-in unique Smart Recovery algorithm which insures that your win rate is higher and that you recover your losses. Number of trades and lot size is decided by EA so that you get the most rewards from each trade. Every trade can be set with Stop loss and Take profit, the EA has an active trailing stop which is automatically activated once your trade is in profit. The EA can scalp the spikes

Парный трейдинг по-прежнему остается самым безопасным видом трейдинга. В советнике используется интересный информационный индикатор, который показывает силу тренда на конкретной паре в процентах. Также применяются другие индикаторы. Пример на скриншоте. На EURUSD сила бычьего тренда 78%. На USDCHF сила бычьего тренда 70%. Советник открывает позиции на обоих инструментах на sell одинаковым лотом. Закрывает когда числовые значения силы тренда обоих инструментов немного подравнялись, чтобы был пол

FX STEWARDS Trading Signals Alert (v5.00) – The Ultimate Hybrid Signal System (Heritage Edition) Built for traders. Engineered for precision. Designed to dominate. Harness the power of cutting-edge quantitative research with FX STEWARDS Trading Signals Alert, a professional-grade hybrid indicator that fuses a 73-feature neural network, a 30+ pattern candlestick engine, an institutional-style probability model, and full auto-timeframe intelligence into tiered BUY/SELL trade alerts — filtere
Automatic trend lines. Type 1. With two extremums. 1) From the current bar "go" to the left and look for the first (right) extremum point with the InpRightExmSide bars on both sides. 2) From the first point again "go" to the left and look for the second (left) extremum point with the InpLeftExmSide bars on both sides.
Fotokopi->Kullanışlı ve hızlı arayüz etkileşimi, kullanıcılar hemen kullanabilir ->>>> Windows bilgisayarlarda veya VPS Windows'ta kullanılması önerilir Temel işlevler: Kopyalama ticaretinin normal etkileşim hızı 0,5 saniyeden azdır Sinyal kaynaklarını otomatik olarak algıla ve sinyal kaynağı hesaplarının bir listesini görüntüle Sembolleri otomatik olarak eşleştirin, farklı platformlarda yaygın olarak kullanılan ticaret sembollerinin %95'i (farklı ekler gibi özel durumlar) otomatik olarak

LT Easy Trend - Tek Bir İndikatörde Kesişimin (Confluence) Gücü Bir indikatör al sinyali verirken diğerinin sat sinyali vermesi yüzünden hiç kafa karışıklığı yaşadınız mı? LT Easy Trend, bu kararsızlığı ortadan kaldırmak amacıyla, dünyanın en saygın 9 teknik indikatörünün matematiksel ortak kararına dayanan yüksek olasılıklı sinyaller sunmak için geliştirilmiştir. Grafiğinizi düzinelerce pencereyle doldurmak yerine, Easy Trend tüm verileri gerçek zamanlı olarak işler ve yalnızca trend tüm filtre

Trend yönünü doğrudan grafikte okuyun KT Trend Magic, momentum ile volatiliteyi fiyatı izleyen renkli bir çizgide birleştirir. Çizgi aktif trend durumunu sürekli gösterir ve hesaplanan yön değiştiğinde renk değiştirir. Yeşil çizgi: yükseliş trendi durumunu gösterir. Kırmızı çizgi: düşüş trendi durumunu gösterir. Renk değişimi: grafikte yeni bir yön geçişini işaretler. Süregelen bir hareket sırasında çizgi, geri çekilmeler ve devam hareketleri için dinamik bir grafik referansı olarak da kullanıla

Traders Toolbox Overwatch - tüm Traders Toolbox çalışan örnekler için bir izleme aracıdır.
Basit bir grafik değiştirme aracı ve tüm Traders Toolbox Çalışan çizelgeleri için bir piyasa saati.
Özellikler:
1. Özelleştirilebilir Düğme Renkleri, Satırlar ve Sütunlar.
2. Üç Sinyal Tipi (Tut - Sarı / Sat - Kırmızı / Al - Yeşil)
3. Traders Toolbox 'ın yeni veya kapalı örneklerine bağlı olarak dinamik olarak güncellenen düğme listesi
4. Tek Tıklama Butonları ilgili grafiği ön plana çıkarır.

STARGOGS DERIV EA V3.4 This Version Works with 6 STRATEGIES. You can Choose which strategy to use by turning the other 5 OFF or you can use all 6 strategies. Strategy 5 Uses Buy & Sell Stops / Buy & Sell Limits. ALL IN ONE ROBOT THIS EA WORKS ON ALL CURRENCY PAIRS, ALL INDICES, WORKS WITH ALL INSTRUMENTS/PAIRS ON DERIV INCLUDING "BOOM & CRASH Stargogs Deriv EA V3.4 - NEW STRATEGIES MORE ACCURACY, FASTER AND MORE DAILY RETURN. NO MARTINGALE NO GRID VERY SAFE ROBOT EA HAS THE FOLLOWING: - You ca

It is a strategy throughout the history of trading. This since it uses a divergence between the RSI and the price. Many traders use this. The backtest is done in 4 hours, but it can work in other timeframes. It is a risk-benefit ratio of 2:1 since the stop loss is 50 pips and the target to be reached is 100 pips. All these values can be modified at the discretion of the trader. PARAMETERS: LotSize: Its use is recommended at 0.1 for accounts that operate full lots and 1 for accounts that operat
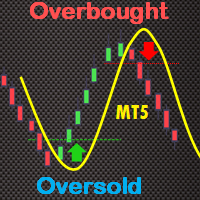
The True Oversold Overbought indicator provides you with ability to swiftly check whether the asset is oversold or overbought. Other than complementing your trading with True Oversold Overbought, you can use the indicator as your only trading system. It works with all forex instruments and will save you the headache of estimating when the market is due for a reversal or retracement. When the "Super Charge" feature is enabled, the areas where the price is in oversold/overbought status are ampli

Bar Strength Divergence Indicator BarStrength Indicator is an exclusive indicator to trade Forex, Stocks, Indices, Futures, Commodities and Cryptos.
BarStrength Indicator shows the strength of each candle.
The indicator shows in a separate windows candles relatively to 2 price levels representing resistance and support in the market.
Once candle is near resistance it is highly probable that price movement will change direction and will go down in the next candles.
Once candle is near support

HighLow Arrow Indicator HighLow Arrow is a simple indicator to be used to signal major lows and major highs in your chart.
This indicator is not intended to be used to trade alone but more as an alert that a turning point might be forming.
In this case the HighLow Arrow indicator signals that a new high or a new low is forming and that traders can prepare for seeking new signals.
The formation of the High or the Low is confirmed after 2 bars have been closed. In the meantime, the alert can b
Buy Sell Signal Low TF gives buy/sell signals and alerts with up and down arrow at potential reversal of a pullback or a trend continuation pattern in low timeframe. This is an indicator which gives signals based on trend => It works best in trend market with the principle is to ride on the trend not trade against the trend.
The components of Buy Sell Signal Low TF: - The trend is determined by SMMA 13 , SMMA 21 and SMMA 35 ( can be changed manually to suit your preference). - The signal is b
FREE
MetaTrader Mağazası, alım-satım robotları ve teknik göstergelerin benzersiz bir deposudur.
Yatırımcılara sunduğumuz benzersiz hizmetler hakkında daha fazla bilgi edinmek için MQL5.community - Kullanıcı Notunu okuyun: alım-satım sinyallerini kopyalama, freelancer'lar tarafından geliştirilen özel uygulamalar, Ödeme Sistemi aracılığıyla otomatik ödemeler ve MQL5 Bulut Ağı.

Alım-satım fırsatlarını kaçırıyorsunuz:
- Ücretsiz alım-satım uygulamaları
- İşlem kopyalama için 8.000'den fazla sinyal
- Finansal piyasaları keşfetmek için ekonomik haberler
Kayıt
Giriş yap
Web sitesi politikasını ve kullanım şartlarını kabul edersiniz
Hesabınız yoksa, lütfen kaydolun