Cumulative Delta Volume
- Göstergeler
- Sürüm: 1.1
- Güncellendi: 26 Mart 2022
- Etkinleştirmeler: 5
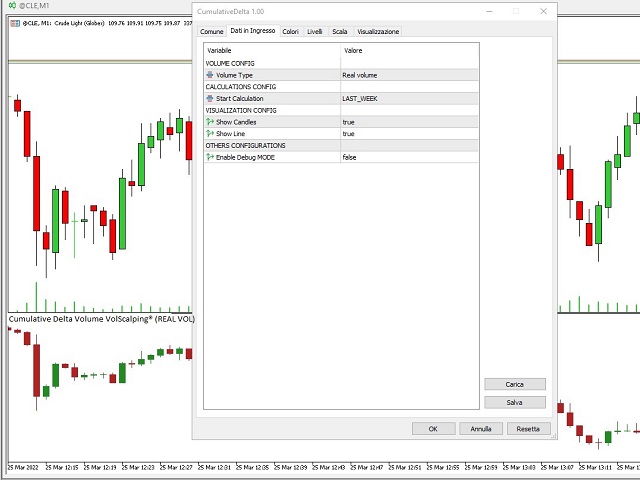
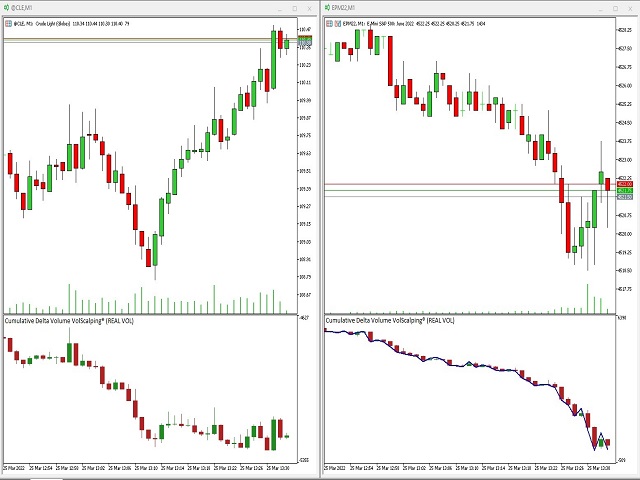
bu gösterge, her bir mum için teklifte ve talepte (saldırganlık) yapılan sözleşmeler arasındaki farkı tespit eder.
gösterge, fiyat grafiğinin altındaki özel pencerede, tam olarak satılan ve satın alınan sözleşmeler arasındaki farkla verilen ve piyasanın hacimsel gücünü oluşturan mumları gösterir.
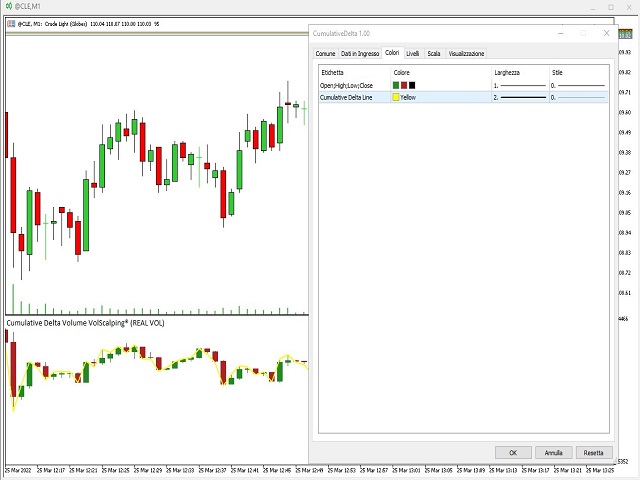
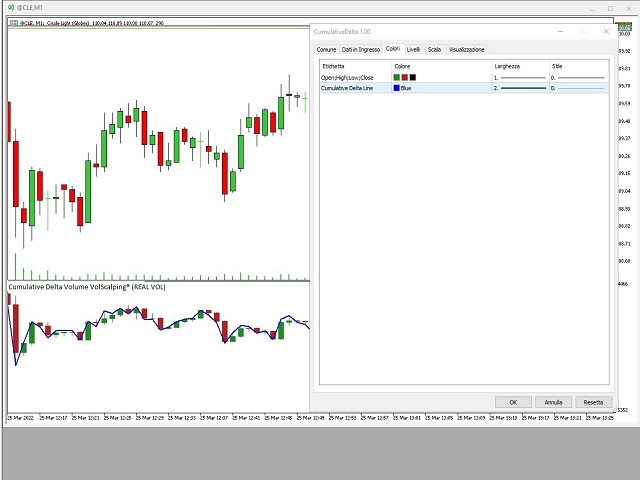
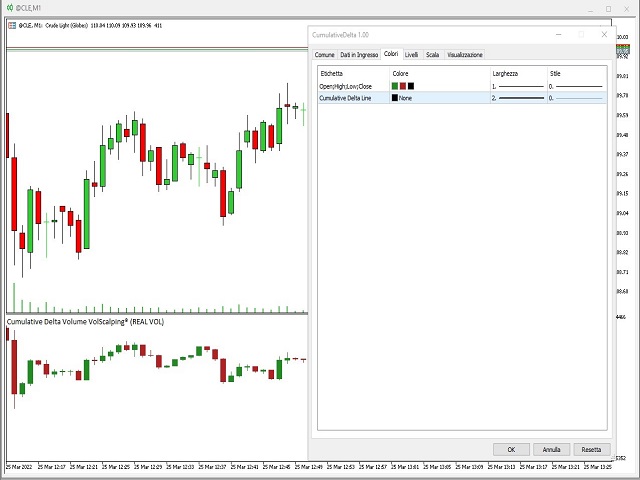
(ekran görüntülerinden bakın) sadece kümülatif mum delta grafiğinin nasıl seçileceği veya hatta mumların kendi trend çizgisi ile nasıl seçileceği mümkündür: ikinci kutuyu seçerek u "HİÇBİR" trend çizgisi çizilmez, bir renk seçildiğinde ise, hacimsel mumların trend çizgisi onlarla birlikte grafikte görünecektir.
BU GÖSTERGE NE İÇİN? fiyat grafiğini hacimsel delta grafiği ile karşılaştırdığınızda, piyasanın gerçek gücünü görebilirsiniz, iki grafiğin yakınsaması fiyatlarda doğru bir yükseliş / düşüş belirleyecektir, fiyatlar ile hacimsel delta arasındaki bir sapma bir sinyal uyarısı olmalıdır. tüccar için, çünkü fiyat tersine dönmelidir. Bu gösterge, yanlış sinyalleri filtrelemek için bir ticaret stratejisi ile birlikte kullanılmalıdır, fiyat ve hacim arasındaki bir farklılık aşamasında meydana gelenleri ortadan kaldırmalıdır.
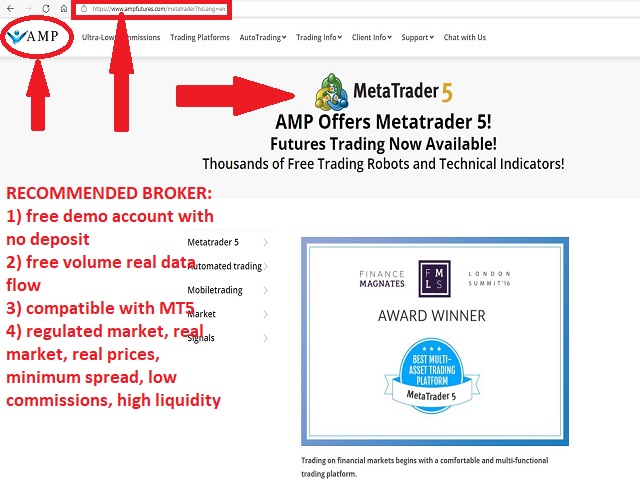
DİKKAT: Gösterge SADECE gerçek piyasanın veri akışını sunan ve satılan / satın alınan sözleşmeleri (BID / ASK) bölen brokerlerle çalışır. CFD, FOREX VE KRİPTO PARA BİRİMLERİ sentetik piyasaya aittir, gerçek bir veri akışına sahip değildirler ve bu nedenle gösterge bu araçlarla ÇALIŞMAZ-
AMP FUTURE, para yatırmadan ve gerçek veri akışıyla ücretsiz demo hesabı sunan, göstergenin üzerinde çalıştığı bir broker.