 MetaTrader 5
 专家
 指标
 程序库
 实用工具
 窗口小部件
 规则
适用于MetaTrader 5的新EA交易和指标 - 531
 使用EA交易和指标,使外汇交易获得更多盈利。EA交易可使您自动开启和关闭交易,而指标将帮助您更准确地预测市场行为。
该页面提供MetaTrader 5应用程序的目录。
It's a two (2) pairs correlation system to use 3 currencies to make 2 pairs to open hedge orders on those.
The expert starts opening four orders for each couple (2 plus and 2 minus) and wait to move prices in one direction to make a grid of orders.
The expert can use a maximum of 5 currencies to make 10 pairs and make 30 couples.
It is important the order of currencies is from the strongest to the weakest.
Strongest... EUR/GBP/AUD/NZD/USD/CAD/CHF/JPY ...weakest.
Canto inputs minimum of thr
FREE

3 Moving averages crossover , with customizable Notifications and pop ups. Comment for any ideas. Its a demo version , could use some work, hope you at least find it useful. Hit me up with anything or any ideas you feel might be helpful and i will try and add them in if i get the time. Thank you. This version is free as of now . I can't promise anything about the future. But enjoy and have fun. Truly PVRPLE BLVCK. PS don't forget to share and like.
FREE
The Forex grid trading strategy is a technique that seeks to make a profit on the natural movement of the market. The robot is designed to trade on GBPUSD, but can also trade on other pairs. EA has the advantage of simplicity and a unique position enhancer. What is important. Positions are opened at the close of the candle.
Input parameters: Start Trend in pips. Comment; Max Spread (Digits 5) Slippage Magic Number Stop Loss Take Profit (first position) Average Take Profit PipsStep for gri

Торговая стратегия. Советник применяет в торговле 4 трендово-сеточные стратегии с различными параметрами. Тем самым обеспечивается распределение рисков по торговым объемам в рынке. Авторская система определения тренда и учет волатильности торгуемой пары позволяют автоматически подстраиваться советнику под настроения рынка. Используется автоматическая фиксация убытка при достижении заданной в настройках просадки. Доступно широкое количество фильтров сигналов, которые позволяют минимизировать л

Camaleão Bands B3 Trader é o robô de negociação automatizado para a bolsa Brasileira B3, tanto para trade em miniínidice WIN, quanto para trade em minidólar WDO. O robô usa as Bandas de Bollinger para análise de ordens de entradas, permitindo trades a favor ou contra a tendência, dependendo da volatilidade das bandas, afinal, quando as bandas estão estreitas, é mais provável que o mercado fique lateral, realizando mais trades contra a tendência. Porém, quando o mercado explode, as bandas se alar

Всем привет. Представляю Вашему вниманию Индикатор TRUE ATR. Так же есть данный индикатор для mt4 https://www.mql5.com/ru/market/product/82414 Данный индикатор работает на всех рынках. TRUE ATR высчитывает среднестатистическое движение инструмента за 1 день и показывает сколько в инструменте осталось энергии внутри дня. В отличие от классического индикатора АТР которые без разбора учитывает все бары(свечи), TRUE ATR при расчете среднестатистического движения инструмента использует ближайших 5

HiLo B3 Trader é o robô de negociação automatizada para a bolsa brasileira B3, para ativos miniíndice WIN, minidólar WDO e também ativos como milho (CCM). O robô opera calculando o indicador HiLo e emitindo ordens de acordo com a tendência. Além da configuração do período do HiLo, pode-se configurar filtros de tendência, bem como ajustar o takeprofit e stoploss para fixos ou dinâmicos com o indicador ATR. Ativos recomendados: WIN, WDO, CCM. Timeframes: M10. Atenção: alterar o parâmetro BR1 para
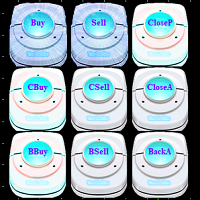
1.系统简介 它是一种三维便捷交易和信号指示按钮,功能不仅包括:买、卖 、平亏损仓、平盈利仓 、买平仓 (可选1/5~1仓位) 、卖平仓(可选1/5~1仓位)、 清仓(清除所有物体、所有持仓以及所有挂单) 、买反手 (可选1~5倍反手) 、卖反手(可选1~5倍反手)、全部反手 (可选1~5倍反手) ,还能通过三维按钮闪烁提供当前账户的单一品种和所有品种的获利信号。
2.系统设置 2.1 lot:买入或卖出仓位 2.2 cbuytimes:买平仓倍数 2.3 cselltimes: 卖平仓倍数 2.4 bbuytimes:买入反手倍数 2.5 bselltimes:卖出反手倍数 2.6 backatimes: 所有仓位反手倍数 2.7 closepl:选择平掉全部盈利、亏损仓位; 2.8 buttonstyle:按钮样式。 2.9 buttonsize:按钮大小样式。 2.10 buttoncorner:按钮位置。 2.11 buttonname:按钮名称;用户可以自定义名称。 2.12 buttoncolor:按钮颜色,用户可以按照RGB值自定义颜色。
3.交易按钮功能 3.1
FREE
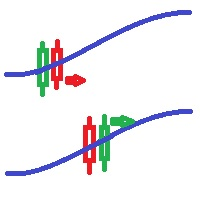
Bollinger bands out/in strategy A strategy created by Joe Ross, and very useful for finding trades when the market is overloaded. Indicator You don't need to find where there are entries on the chart, this indicator shows them for you. The entrance The trade is confirmed when the price closes outside the bollinger bands on a candle and the candle after the price closes inside the bands. comment I want to improve this indicator, so you can help me sending me your reviews and comments, thanks :).
FREE

描述。 该产品是作为“ PULSE_OF_MARKET ”项目的一部分创建的。
EA“Undefeated Triangle”是一个先进的系统,利用澳元、加元和新西兰元货币之间的独特波动。历史结果表明,组合中使用的这些对总是在向一个方向快速移动后返回第一个移动的对。这种观察可以允许包含一个网格-鞅系统,该系统可以获得这些独特情况的最大点数。
EA“不败三角”仅使用 3 对:AUDCAD、AUDNZD 和 NZDCAD。 MT4 version 好处。
真实账户监控 ;
比类似的替代品便宜得多;
操作迷你账户甚至 1 美元;
没有复杂的针参数;
便于使用。
参数。
Short Name (In Comment Section) – 出现在评论部分的日记或帐户历史中; Print Logs On Chart - 开/关信息面板; Display Options – 允许调整 4K 显示分辨率; One Chart Setup Pairs – 选定的交易对列表(必须更改后缀); Magic - 交易头寸标识符; No more Initial Trades (onl

LT HiLo Activator 将知名交易员 Robert Krausz 创建的经典趋势跟踪方法带到您的图表中。它是一款重要的技术分析工具,可帮助您捕捉市场的大幅波动,并避免逆市场趋势交易。 HiLo 实用、直观且易于快速解读,它就像一条方向性的支撑与阻力“阶梯”,帮助您更轻松地确定进场、出场以及资金保护位置。
如何在实际交易中应用 上升趋势(动态支撑): 指标线绘制在 K 线下方,作为一个优秀的技术区域,方便您设置并移动多单止损。 下降趋势(动态阻力): 指标绘制在价格上方,提示市场走弱,并帮助保护您的空头仓位。 周期反转: 当价格穿越并收盘于 HiLo 线之外时,指标会“翻转”到另一侧,提示新的潜在趋势可能开始。
指标主要功能 简洁客观的设置: 只需点击几下,您仅通过调整基础周期即可校准指标,使其能够轻松适配从短周期快速剥头皮交易到中长线持仓交易的不同风格。 精准时刻提醒: 可配置屏幕弹窗、手机 Push 推送通知或电子邮件提醒。一旦发生趋势交叉,系统会自动通知您,无需一直盯盘。 图表视觉信号: 可选择在图表上启用买入/卖出箭头,并可调整其垂
FREE

一种全自动高级工具,可交易短期市场波动,使用自定义震荡指标预测价格反转。可插拔自动手数计算,内置重叠恢复算法,订单间步进策略可调。 MT4版本 -> 这里 / 问题解决 -> 这里 优点: 能够添加手动订单的自动化系统 固定和可调的动态音调 可调重叠恢复算法 能够在一个或两个方向上进行交易 在相反方向移动时使用平均 可插拔自动体积计算 内置发送所有类型通知的能力 输入参数: 主要设置 Size_of_the_first_order - 定义第一个订单大小的变量
Enable_Autolot_calculation - 此功能允许您在更改存款时保存风险设置
Autolot_deposit_per_0.01_lots - 使用 autolot 时每 0.01 手的存款金额
Maximum_size_of_orders - 一个订单的最大交易量,以手为单位 止盈设置 Take_Profit - 虚拟止盈的大小。它是从盈亏平衡价格为当前订单组计算的,以点为单位
Overlap_Recovery_Algorithm - 使用第一个订单与最后一个订单的重叠,有助于更快地关闭部分头寸
Us

ClickDrag可以轻松地在图表上画线和移动对象。
点击,然后拖动,开始绘制趋势线。
水平移动鼠标可以画出价格线。
垂直移动鼠标可画出日期线。
现有的线和对象可以通过点击和拖动来移动。
显示开始点到结束点之间的价格和时间差。
开始后点击&拖动。
左右摇动来改变颜色。
向上和向下摇动可以删除。
- 什么是Click & Drag ?
1. 按下鼠标左键(按)。
2. 松开鼠标左键(释放)
3. 按下鼠标左键(按住)
4.保持按住并移动鼠标(拖动)
这个动作允许你画趋势线,移动对象,改变颜色和擦除。
箭头、价格对象、斐波那契、吉安线、周期线和形状也可以移动。
如果你不小心画了一条线,请移动到图表外,然后释放按钮。这条线就会消失。
比中间点击更容易。比中间点击的可见性更好。
但它不能用于不可选择的对象。
外汇的PIPS和差价合约的货币。
FREE
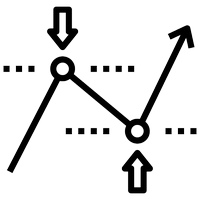
该指标显示最佳止盈和止损水平。这些水平是根据历史数据计算的。在第一次开始时,指标是根据历史训练的。之后,他评估价格在未来克服这个或那个水平的可能性,并选择最优化的选项来放置止损单。例如,选择止盈值以使利润最大并且价格达到其水平的概率尽可能高。止损水平应该是最小的,但达到它的可能性应该是最小的。这导致了具有最高可能获胜数学期望的级别。 此外,该指标可以以支撑位和阻力位的形式使用。为此,您可以组合不同的预测长度和偏移量。 指标参数: 长度 - 预测长度。此参数表示未来柱线交易的预期持续时间。 Shift - 在小节中移动。由于此参数,您可以查看过去的指标读数。 宽度 - 线宽。 ClrBuy - 买入头寸的线条颜色。 ClrSell - 卖出头寸的线条颜色。 StyleTP - 获利线样式。 StyleSL - 止损线样式。 信息 - 启用此选项时,止损和止盈值将显示在终端的“专家”选项卡中。
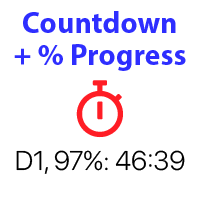
倒计时至酒吧关闭,+ 进度状态 %: #1 多功能工具 : 66+ 功能,包括此工具 | 联系我 如有任何问题 | MT4 版本 在指标的设置中,您可以配置: 计算时间框架; true / false: 更高时间框架选项(从当前使用的下一个:M15->M30,H4->D1...) 位置:
1 = 左下角;
2 = 右下角;
3 = 左上角;
4 = 右上角; 字体大小; 颜色; 字体样式; #1 多功能工具 : 66+ 功能,包括此工具 | 联系我 如有任何问题 | MT4 版本 #1 多功能工具 : 66+ 功能,包括此工具 | 联系我 如有任何问题 | MT4 版本 #1 多功能工具 : 66+ 功能,包括此工具 | 联系我 如有任何问题 | MT4 版本 #1 多功能工具 : 66+ 功能,包括此工具 | 联系我 如有任何问题 | MT4 版本
FREE

Plot History Mt5,一个交易者不可或缺的脚本,用于分析您的交易终端和由专家顾问执行的账户的交易历史。分析方法基于运行脚本的符号图以及魔术数字,对一位或多位专家使用的所有魔术进行具体或完整的分析。该脚本分析交易数据并可以将其绘制在图表上,在专家日志中打印出详细的交易信息并将分析数据导出到 csv。 脚本的优点 能够分析帐户上使用的一种或所有魔法 将所有交易数据导出到 csv 文件 在图表上绘制所有交易、进入和退出。这可以设置为,绘制或不绘制什么。 在专家日志中打印详细的交易信息 如何执行账户交易分析 首先选择您要分析的品种,然后选择是通过特定的魔术编号执行分析,还是对账户中使用的所有魔术进行完整分析。笔记;这是一个脚本,不是专家顾问!该脚本仅在附加到图表时运行一次,并在完成后自行删除。 具体魔术分析 - 输入所需的魔术数字(数字) 所有魔法 - 仅输入 -1 如何将数据导出到csv 首先将此功能设置为“真”。将脚本附加到图表后,将创建一个目录和文件,并保存所有数据。该文件可以在 MQL5/Files 中找到。您应该重命名“HDPsample.csv”以包含已分析的符号,例

Multi Chart Refresh Mt5,是一个快速、流畅的不可或缺的脚本,可以同时从同一个图表刷新多个图表。多任务处理使这成为可能,因为您可以提前选择要刷新的符号。 它是如何工作的?
打开任何图表,将脚本从导航器中拖放到图表上。设置所需的符号,然后单击确定,完成!请注意,这是一个脚本而不是智能交易系统,当任务完成时,程序会将自己从图表中删除。终端日志中的详细信息会打印出来,说明哪些符号已更新为所需的柱数,哪些未更新。再简单不过了!
脚本菜单设置 符号选择 - 设置您想要的符号 符号前缀 - 如果存在则输入符号前缀,只有它是前缀! 符号后缀 - 如果存在则输入符号后缀,只有它是后缀! 用多少条刷新图表? - 设置要刷新多少条柱/图表
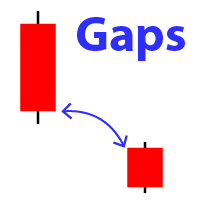
显示图表上的缺口外观 (当上一根K线的收盘价与新K线的开盘价不同时)。 #1 多功能工具: 66+ 功能,包括此指标 | 联系我 如有任何问题 | MT4 版本 在初始设置中 您可以配置: 缺口大小 : 超过此值的缺口将被显示。 大小类型: 点 / 点值 / %; 箭头颜色 : 分别为向上和向下缺口。 终端 / 电子邮件 / 推送通知 当您将鼠标悬停在图表上的缺口箭头时, 将显示其大小 ; 我建议您为不同的时间框架和货币对选择合适的缺口大小。 #1 多功能工具: 66+ 功能,包括此指标 | 联系我 如有任何问题 | MT4 版本 #1 多功能工具: 66+ 功能,包括此指标 | 联系我 如有任何问题 | MT4 版本 #1 多功能工具: 66+ 功能,包括此指标 | 联系我 如有任何问题 | MT4 版本
//----

价格观察的常识方法 价格上涨时买入,价格下跌时卖出 上面关于价格上涨时买入或价格下跌时卖出的声明可能过于宽泛,因此可能需要一些指导和规则,这就是 The 3 Duck's 发挥作用的地方。
价格平均 Mt5 指标将帮助您识别在最后一个上升趋势方向的买入机会和在最后一个下降趋势方向的卖出机会。标题中的“duck's”来自“让所有的鸭子排成一行”的说法,意思是让所有东西都按正确的顺序排列。共有三只鸭子,第一只鸭子将帮助您识别最后的上涨或下跌趋势,第二只鸭子有助于确认趋势方向,第三只鸭子将帮助您识别趋势方向的买入或卖出机会。该指标涉及使用三个不同的时间框架,一个 4 小时图(第一只鸭子)、一个 1 小时图(第二只鸭子)和一个 5 分钟图(第三只鸭子)。
我们需要做的第一件事是查看我们最大的时间范围(4 小时第一只鸭子),看看当前价格是高于还是低于。这只鸭子告诉我们当前价格高于或低于。这告诉我们,我们可能希望买入或卖出。 我们需要做的第二件事是查看我们的(1 小时第二只鸭子),我们还需要在此图表上查看当前价格高于或低于,这给了我们确认,例如,如果这两只鸭子现在低于平均水平,我们关注出售,
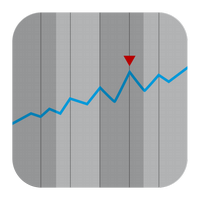
超几何级数用于计算该滤波器的权重系数。这种方法使您可以对时间序列进行相当有趣的平滑处理。 超几何滤波器权重的衰减速度不如指数和线性加权移动平均,但比平滑移动平均快。因此,此过滤器的行为在许多方面类似于移动平均线的行为。但是,它有几个优点。它的滞后远小于移动平均线。但与此同时,它比指数移动平均线保留了更多的信息。因此,超几何过滤器可以更好地突出金融时间序列的趋势和周期性成分。因此,该指标可用于那些使用不同类型移动平均线的交易策略。 指标的操作取决于一个参数: iPeriod - 此参数的有效值为 2 - 149。 该参数的值越小,指标对最新价格变化的反应越强。此参数的较大值可让您突出显示长期趋势。图中显示了具有不同 iPeriod 值的指标操作示例。

Investopedia FIVE EA 基于这篇文章:
https://www.investopedia.com/articles/forex/08/five-minute-momo.asp
交易条件
- 寻找低于 X 周期 EMA 和 MACD 的货币对交易处于负区域。 - 等待价格上穿 X 周期 EMA,然后确保 MACD 处于从负向正的交叉过程中,或者在五个柱内进入正区域。 - 在 X 周期 EMA 上方做多 X 个点。 - 在入场时卖出 X 个头寸加上风险金额;移动下半场的止损点以达到盈亏平衡。 - 使用追踪止损
- 风险警告 - 在您购买 ADX PRO 之前,请注意所涉及的风险。 - 过去的表现并不能保证未来的盈利能力(EA 也可能亏损)。 - 显示的回溯测试(例如在屏幕截图中)经过高度优化以找到最佳参数,但因此无法将结果转移到实时交易中。 - 该策略将始终使用止损,但 SL 的执行仍取决于您的经纪商。
如果您对 EA 有任何建议,请给我留言。谢谢!

This Expert Advisor works on the signals of the Parabolic indicator, while analyzing the readings of other indicators, especially Stochastic. Sets pending orders, as a rule, they are triggered when a local trend reversal occurs. If the trading conditions become unsuitable, it can delete pending orders. It has many settings, the stop loss can also move along the parabolic with other parameters.
Recommended timeframes: M5, M15, M30, H1. Before trading, optimize the EA parameters for your account
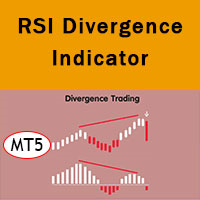
RSI divergence indicator finds divergences between price chart and RSI indicator and informs you with alerts (popup, mobile notification or email). Its main use is to find trend reversals in the chart. Always use the divergence indicators with other technical assets like support resistance zones, candlestick patterns and price action to have a higher possibility to find trend reversals. Three confirmation type for RSI divergences: RSI line cross 50 level Price returns to previous H/L C
FREE
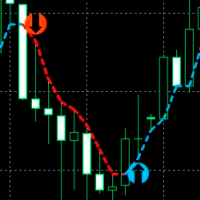
An indicator for accurately determining price reversal points on all timeframes and all currency pairs. With the help of technical analysis of the market and mathematical diagnostic models, this indicator determines the price reversal points and the current trend direction with great efficiency. The indicator displays this information on the chart in the form of arrows and lines. The arrows show the trend reversal points and the lines show the current trend direction. INDICATOR trades in real t
RSI Divergence Scanner is a multi-timeframe and multi-symbol dashboard and alert that checks all timeframes and symbols to find regular and hidden divergences between price chart and RSI indicator. This divergence scanner is integrated with support and resistance zones so you can check the RSI divergences in the most important areas of the chart to find trend reversals in price chart. Download demo version (works on M4,M6,M12,M20,H3,H8 timeframes of 20 symbols of Market Watch window) Full desc

Donchian Channel is an indicator created by Richard Donchian. It is formed by taking the highest high and the lowest low of the last specified period in candles. The area between high and low is the channel for the chosen period.
Its configuration is simple. It is possible to have the average between the upper and lower lines, plus you have alerts when price hits one side. If you have any questions or find any bugs, please contact me. Enjoy!
FREE

Informações Importantes sobre o Brazil Index Bot (BACKTEST VISUAL desativado para proteger parte da Estratégia.)
Se você está procurando um robô que cumpre aquilo que promete, você acabou de encontrar! O Brazil Index Bot irá superar todas as suas expectativas com certeza! E o melhor de tudo, é só colocar na sua conta, ligar e já começar a lucrar! Deseja conhecer mais sobre o Brazil Index Bot e seus resultados? Baixe agora os relatórios detalhados em: https://bit.ly/INFOSBRAZILINDEXBOT (Utilize e

Informações Importantes sobre o Bra50 Index Bot (BACKTEST VISUAL desativado para proteger parte da Estratégia.)
Se você está procurando um robô que cumpre aquilo que promete, você acabou de encontrar! O Brazil Index Bot irá superar todas as suas expectativas com certeza! E o melhor de tudo, é só colocar na sua conta, ligar e já começar a lucrar! Deseja conhecer mais sobre o Bra50 Index Bot e seus resultados? Baixe agora os relatórios detalhados em: https://bit.ly/INFOSBRAZILINDEXBOT (Utilize es
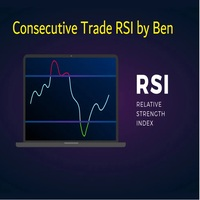
This EA takes trades based on a configured RSI level. At each candle close, it will resume a position if the one closes above the previous one.... The SL and TP are positioned and it is the sum of all the trades initiated that will close the positions: Either in % of capital, or in pips. IMPORTANT :
it is the magic number that allows the EA to properly close positions. so be sure to put different magic numbers on each graph. Important : have a good money management with this type of EA (little
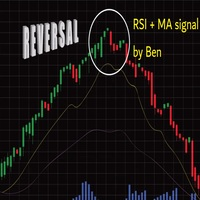
Important : have a good money management with this tpe of EA (little lot size....and avoid margin call)
The EA takes a trade when 2 conditions are met: The achievement of an RSI level, and the break of a moving average of your choice.
When the trade is initiated: the SL is positioned (in pips) the TP1 can be: the kijun, or another moving average, you can configure a value approaching the TP1 (which avoids the price shift of brokers) the partial close is done the SL after TP1 can be configured
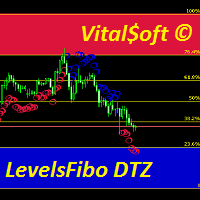
The combined Levels Ib DTZ indicator helps to determine the trend direction when trading. Displaying signals on the chart about a possible upcoming trend change. The indicator is a combination of Fibonacci levels with overbought and oversold zones and a trend indicator based on ZigZag and ATR indicators. The Levels Ib DTZ indicator helps traders predict future price movements and adjust their strategy accordingly. It works on all timeframes.
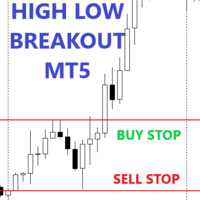
This expert advisor will make a pending order at a certain time, pending orders are made in the form of buying at the highest price and selling at the lowest price (in a predetermined time frame) you can make a pending order breakout at the highest and lowest prices according to your wishes, thus it can be used for the following strategies: - Asian Session BreakOut - European Session BreakOut - US Session Breakout - News Trading - Etc.
Main parameter description Notes : order type 4 is not part
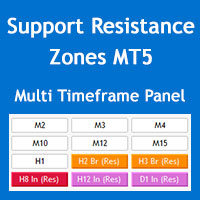
Support and Resistance zones indicator for MT5 is a multi-timeframe panel and alert that finds support and resistance zones and pivot points for all timeframes of MetaTrader 5 and gives alert when price has interaction with them. Download demo version (works on GBPUSD, EURJPY and NZDUSD symbols) Read the full description of scanner parameters in the blog page . Many unique features in one indicator: Integrating support and resistance zones and pivot points in one indicator with powerful filterin
Support and Resistance Dashboard for MT5 is a multi-timeframe and multi-symbol scanner and alert system that finds S/R zones and pivot points for all timeframes and symbols and alerts when price has interaction with them. If you are using support and resistance (or supply and demand) zones in your trading strategy, this dashboard and its alert and filtering system is a big time saver for you. Download demo version (works on M4,M5,M6,M12,H3,H8 timeframes) Full description of scanner parameters
The idea of this trading system from the EMA with a Mediante price from the EMA indicators is based exactly 100% from Ripster47 trading system, me is just the person to create it on the MT5 platform, but with alerts for your own buy/sell settings. Hereby I make a copy from Ripster47 explanation for using that system: " EMA Cloud By Ripster
EMA Cloud System is a Trading System Invented by Ripster where areas are shaded between two desired EMAs. The concept implies the EMA cloud area serv

1. The Expert Adviser is built with a basic, simple and stable trading strategy with a touch of Price Action Principle that is highly effective and accurate for a sniper entry system. The EA have a good money management System.. 2. The expert advisor works best as from 5minutes time frame and above, The higher the time frame, the more accurate is the signal.... 3. The expert advisor work with all broker all currency pair and synthetic indices... 4. Use a reasonable lot size and correct settings
FREE

1. The Expert Adviser is built with a basic, simple and stable trading strategy with a touch of Price Action Principle that is highly effective and accurate for a sniper entry system. The EA have a good money management System.. 2. The expert advisor works best as from 5minutes time frame and above, The higher the time frame, the more accurate is the signal.... 3. The expert advisor work with all broker all currency pair and synthetic indices... 4. Use a reasonable lot size and correct settings
FREE
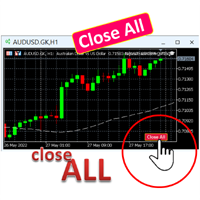
A simple button to completely close all existing open trades (both Buy and Sell) on the current chart .
Warning : Once the button is pressed, all open trades on the current chart will be deleted immediately without any more questions or dialogue.
Use this utility very carefully. We recommend that you do a trial of removing open trades on a demo account first, before trying to use this utility on a real account.
FREE
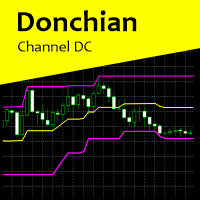
Donchian Channel DC is the indicator of Donchian Channels, that plots maximum and minimum values of a specific period, besides mean value line. It´s possible to configure simple period for analysis and the indicator will plot all three values. You can trade with this indicator as trend or reversal, according to each strategy. Do not let to test others indicators as soon as others expert advisors.
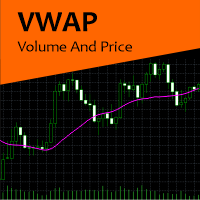
VWAP Volume And Price is the indicator for Volume Weighted Average Price, designed according to regular calculation. The average price is calculated using typical price - (high + low + close) / 3 - and weighted by volume for each candle. So, the indicator can be used to trend trades, balanced with volume. Try other products and expert advisors too. Any doubt, PM.

Supimpa B3 Trader é o robô de negociação automatizada para a bolsa brasileira B3, para os ativos miniíndice WIN e minidólar WDO. A estratégia de negociação é baseada na média VWAP - Volume Weighted Average Price - que utiliza uma média ponderada dos preços em relação ao volume de negociação em cada vela. O robô é de configuração simples, com entrada do valor do período da média de análise e do takeprofit e stoploss fixos. Além disso, pode-se configurar também o número de contratos, configuração

GBP Scalper 03 is a simple EA that can work automatically to carry out trading activities. Like the previous version (GBP Scalper 01 & GBP Scalper 02 (MT4 platform)), this EA is kept simple and only requires Lot, TP, and SL settings to use.
And because of the absence of the Buy_only and Sell_only options on the MT5 platform, an option is added to manage the activation of Buy Trade or Sell Trade
As the name implies, this EA is only suitable for trading with the GBPUSD pair, and is design

British stuff The Expert Advisor tool has been developed for GBPJPY 1H based on SMA 200 and pending orders. It has been backtested on more than 18-year long tick data with 99% quality of modeling. The enclosed screenshots demonstrate the complexity. A broker with a small spread and slippage is recommended for better performance. There is no need to set up any parameters, except Magic number and Friday exit time, lot size . All other settings are already optimized and fine-tuned. Strategy worki

Basato sull'indicatore RSI aiuta a capire quando il trend sta cambiando in base ai periodi impostati. E' possibile impostare intervalli di tempo personalizzati e colori delle frecce. Segui l'andamento e valuta anche in base alla volatilità dell'asset. Funziona con ogni coppia di valuta ed è da considerare come un'aiuto ad una valutazione. Puoi associarlo con altri indicatori.

没有 EA 会在短时间内将数亿变成数百万,这是一个谎言。 EA 的交易 1 分钟图表并不多,更不用说黄金了。 这个 EA 是独一无二的,它使用烛台和商品通道指数在 1 分钟的时间范围内交易 XAU/USD。 相应地调整输入,优化。 使用 VPS 进行交易或仅用于日间交易目的。 推荐用于日间交易,但如果您选择这样做,请尝试不同的设置和时间范围。
在需要时进行优化以供您使用。 EA 需要持续优化以获得最佳结果
设置文件位于测试的评论中。
没有 EA 会在短时间内将数亿变成数百万,这是一个谎言。 EA 的交易 1 分钟图表并不多,更不用说黄金了。 这个 EA 是独一无二的,它使用烛台和商品通道指数在 1 分钟的时间范围内交易 XAU/USD。 相应地调整输入,优化。 使用 VPS 进行交易或仅用于日间交易目的。 推荐用于日间交易,但如果您选择这样做,请尝试不同的设置和时间范围。
在需要时进行优化以供您使用。 EA 需要持续优化以获得最佳结果
设置文件位于测试的评论中。

///XShea////
基於應用於電平交叉的指標 (MFI) 的邏輯。 只剝頭皮
經過幾個月的真實賬戶測試和應用,我決定提供
的買家 如果遵循相應的規則,這個有價值的工具
您將能夠在您的外匯賬戶上獲得非常可觀的利潤。
該指示器被編程為發送聲音警報和推送通知。
應用方式:
僅在大於 M5 的時間段內工作 對於止損 (SL) 水平,以之前的最後支撐或阻力作為參考 對於止盈 (TP) 水平參考此應用模式的第二點設置 1/4
聯繫以獲取更多信息:
WhatsApp:+5930962863284
購買後,請與我聯繫以向您發送有關如何從該工具中獲得最大好處的附加指南。
關於如何獲得最佳門票的 PDF 實用指南。 VIP模板引導您走向更好的趨勢。 個性化建議。

FREE
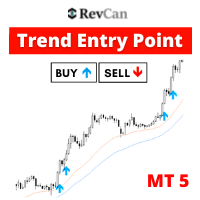
[75% OFF - SALE ENDS SOON] - RevCan Trend Entry Point is a trend based trade alert indicator for serious traders. It does all the price and chart analysis all by itself, and whenever it finds any potential high quality trading opportunity(Buy or Sell) using its revolutionized price prediction algorithms, it sends instant trade alert directly on the chart, MT4 terminal and on the mobile device. The trade signals will be visible on the chart as Up and Down arrows, while the instant audible ale

Robo =Crisis= is a completely new unique approach to trading in the "swamp" of trading. Trading in automatic and semi-automatic mode. The robot works according to the current market situation, no stories, redraws, grids and other things. One of the main advantages of the robot is the love of strong volatility. He's not afraid of the news. Absolutely any volatility in the market is our friend. Features of trading: - The adviser includes ( Robo =Crisis= and the Flat indicator, which will be added
Multiple Timeframe Trend Alert
I. Overview
Real-time analysis of trends on nine time frames (M1, M5, M15, M30, H1, H4, D1, W1, MN1) based on the calculation of highs and lows using swing highs and lows and Dow Theory. Indicator sends notifications (alerts) when the trends of the specified time frames match.
II. Advantage
Since this indicator notifies you when a trend coincides, you can seize trading opportunities without having to stay on the charts.
In addition, by introducing this indica

Only 5 copies of the EA at $333! Next price --> $1111 The robot only works on the Nasdaq for 30 minutes or less
Please contact me for optimal settings.
The robot only trades two times a day in American Time. Very low risk. Limits specified. Opens only one position. Martingale does not. Absolutely scalp.
You can contact us via Instagram, Telegram, WhatsApp, email or here. We are ready to answer you.
FREE
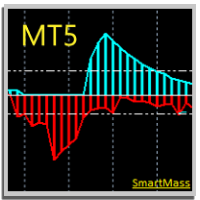
SMARTMASS INDICATOR
This indicator is different from all known volume indicators. It has a significant distinction; it is an algorithm that relates price movement to volume, attempting to find proportionality and efficient movement while filtering out noise and other movements that are more random and do not follow a trend or reversal. Ultimately, it reveals the true strength of the movement, indicating whether it has genuine support from bulls or bears or if it's merely a high-volume movement
Expert Advisor Stop and Reverse Cut Switch Hedge based on Parabolic SAR indicator. There are two setting in EA: 1. Cut Switch 2. Hedging
Recommended settings: TimeFrame = H4 Risk = 0.1 Minimum Balance = 1.000 MaxToBep = 4
Main Parameter Description: - Hedging Mode False = Cut Switch True = Hedging - Max Martingale Level = Lot / Volume will reset after "n" Losses - Risk = Based % of Balance -MaxOP to BEP = Target BEP will be active if there is a certain number op open position - Percent BEP =
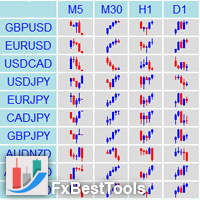
Definition : Market View is a dashboard (scanner) to view price graphs of all symbols and all timeframes at a glance. The utility is designed user friendly and added a wide range of customization options.
Main features of Market View : Visual settings window on the chart Customizable list of symbols and timeframes Different shapes : Real Candles, Schematic Candles, Arrows Customizable number of candles Changeable size of dashboard (scanner)
Highlight timeframes with gaps on candles Open approp
I'm sure after a lot of research on the internet, you haven't found any indicator that can help you with forex or binary trading in the latest probability strategy created by famous trader Ronald Cutrim. The strategy is based on a simple count of green and red candles, checking for a numerical imbalance between them over a certain period of time on an investment market chart. If this imbalance is confirmed and is equal to or greater than 16%, according to trader Ronald Cutrim, creator of the pro
FREE
Daily Projection Levels , as the name implies, is an indicator that project the price changes in percentage above and below the opening of the day (or closing of the previous day.
These are "psychological" support and resistance areas where price tries to retrace or break out.
With this you have a powerful tool to predict what these zones will be! You can define which projection levels you want (up to 5 above and below), in addition to have alert messages and visual customization. If you want to

Do you want an EA with small stoploss? Do you want an EA that is just in and out of market?
Gold looks at several MT5 It is ONLY buying when the market opens and with a window of 10 minutes or less.
It uses pre-market price so be sure your broker has that.
This strategies (yes, it is 2 different strategies that can be used with 3 different charts) have tight stoplosses and a takeprofit that often will be reached within seconds!
The strategies are well proven. I have used them manually for

Only gold and bitcoin can be profitable. Trade time is 30 minutes and trend time is 1 hour.
You should check the efficiency of this robot at the end of three months.
Strong trends make very good profits.
There are many inputs for your personalization, but the best settings are defined by default.
This indicator will have many updates and special settings will be added to it.
You can contact us via Instagram, Telegram, WhatsApp, email or here. We are ready to answer you.
FREE

1. The Expert Adviser is built with a basic, simple and stable trading strategy with i touch or Price Action Principle that is highly effective and accurate with a sniper entry system for a good money management.. 2. The expert advisor works best as from 15 minutes time frame and above.... 3. The expert advisor work with all broker all currency pair and synthetic indices... 4. Use a reasonable lot size and correct settings if you want to get the best of the Expert Advisor.. 5. With Default setti
FREE

The most sensitive indicator you've ever seen! And now with Alerts
POscillator Alert is a sensitive indicator that finds each trend direction change in every timeframe and then notifies you with the necessary alarms. It's a new version of the POscillator Indicator, with the addition of its alarm sending capability. The Indicator can send multiple alerts: email, mobile phone notification, alert window and alert sound. All of these different alarms are optional and you can choose the ones you w

OPTIMIZE BEFORE BACKTEST AND USE Trade crude oil with this EA. No EA turns hundreds into millions in a year or 2, This is a lie if presented this way. Black Gold trades Brent Crude on 1 min charts. It uses RSI, moving averages and directional indicators. Try it out, load it onto the tester if you have the history and ability to trade Brent crude.
Adjust and optimize to get the most out of the expert advisor

New Trend Alerts finds new trends at the changing bar very quickly. If the trend has enough power and a quality up/down angle, then the indicator sends multiple alarms to alert you: via email, mobile notification, alert window and alert sound. All of these different alarms are optional, and you can choose which ones you would like to use. The indicator calculates the derivative of the price chart to reveal the slope of price curve and its sign changes. Red bars indicate a positive sign or uptre

CHART OBJECTS: Blue box : Bullish Order Blocks (OB) Red box : Bearish OB Orange box : Mitigated OB. Price bounce from this area the made a new high/low Light gray box : Price bounced from this area but did not made a new high/low Dark gray box : Broken OB. Filled boxes : TimeFrame 1 Order Blocks
Unfilled boxes : TimeFrame 2 Order Blocks
INDICATOR SETTINGS: Order Block Required Length: Required number of subsequent candles in the same direction to identify Order Block. Default value: 5 Imba

In this indicator, Heiken Ashi candles are calculated with the most optimal method. You can also customize the results by adjusting the amount of period and method input. But the most important advantage of this indicator is the adjustment of the time frame value. You can use this to calculate the Heiken Ashi chandels to See in time frames with lottery in the lower time chart. In this case, you get the best signal to buy or sell using two or more Heiken Ashi indicators with different timeframes
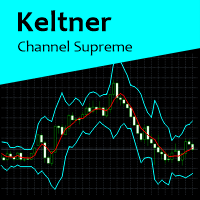
Keltner Channel Supreme is a indicator based on Keltner Channels, with some configuration besides period and Keltner multiplier factor. In this indicator, it is possible to change to an exponential moving average and if prices will be calculated according to close price or typical price. This indicator works on all graphics. If you have some doubt, please PM.
Скальпирующий алгоритм полностью автоматической торговли на FORTS для фьючерсов Сбербанка и Газпрома Московской биржи. Рабочий таймфрейм 5 минут. Алгоритм анализирует:
1) Импульсное изменение цены в моменте и на истории сопряженных активов. 2) Глубину рынка на наличие повышенных объемов в стакане. 3) Роботизированные и айсберг заявки в стакане. 4) Потенциальные ценовые и фрактальные уровни. 5) Историю на хорошо отработавшие паттерны прайс экшен. В случае когда алгоритму удалось выбрать подходящ
John Bollinger's normalized MFI (Fund Flow Index). Bollinger bands are used to calculate overbought/oversold areas. It takes three input parameters: MFI period - MFI calculation period MFI Applied Volume - Calculates the volume of MFI transactions BB period - Calculation period of the Bollinger band BB deviation - Brin deviation Calculation: NormMFI = (MFI-BL) / (TL-BL) Among them: TL = BBands(MFI, BB period, BB deviation, UPPER_BAND) BL = BBands(MFI, BB period, BB deviation, LOWER_BAND) MFI - M
Gold instrument scanner is the chart pattern scanner to detect the triangle pattern, falling wedge pattern, rising wedge pattern, channel pattern and so on. Gold instrument scanner uses highly sophisticated pattern detection algorithm. However, we have designed it in the easy to use and intuitive manner. Advanced Price Pattern Scanner will show all the patterns in your chart in the most efficient format for your trading. You do not have to do tedious manual pattern detection any more. Plus you

BBMA Dancer EA is Expert Advisor base on trend following strategy. This expert using BBMA to cathching the market trend. With this EA orders that are made seem to be dancing in the market in tune with the BBMA trend signal. This EA have a good performance that has been tested more than five years with real ticks history data. Forex market is a risky investment so please using BBMA Dancer EA wisely.
Although this EA can be use on any pairs, but please Use this EA on EURUSD Pair at M15 timeframe

Gold Wire Trader MT5 trades using the RSI Indicator. It offers many customizable RSI trading scenarios and flexible position management settings, plus many useful features like customizable trading sessions, a martingale and inverse martingale mode.
The EA implements the following entry strategies, that can be enabled or disabled at will:
Trade when the RSI Indicator is oversold or overbought Trade when the RSI comes back from an oversold or overbought condition Four different trading behavio
MetaTrader市场是 出售自动交易和技术指标的最好地方。
您只需要以一个有吸引力的设计和良好的描述为MetaTrader平台开发应用程序。我们将为您解释如何在市场发布您的产品将它提供给数以百万计的MetaTrader用户。
