 MetaTrader 5
 Uzmanlar
 Göstergeler
 Kütüphaneler
 Yardımcı programlar
 Widgetlar
 Kurallar
YouTube'dan Mağaza ile ilgili öğretici videoları izleyin
Bir alım-satım robotu veya gösterge nasıl satın alınır?
Uzman Danışmanınızı
sanal sunucuda çalıştırın
sanal sunucuda çalıştırın
Satın almadan önce göstergeyi/alım-satım robotunu test edin
Mağazada kazanç sağlamak ister misiniz?
Satış için bir ürün nasıl sunulur?
MetaTrader 5 için yeni Uzman Danışmanlar ve Göstergeler - 510
 Forex alım-satımını daha karlı hale getirmek için alım-satım robotları ve göstergeler kullanın. Alım-satım robotları, işlem açma ve kapatma sürecini otomatikleştirmenize olanak tanırken, göstergeler piyasa davranışını daha doğru bir şekilde tahmin etmenize yardımcı olur.
Bu sayfa, MetaTrader 5 uygulamalarının kataloğunu içermektedir.
Forex alım-satımını daha karlı hale getirmek için alım-satım robotları ve göstergeler kullanın. Alım-satım robotları, işlem açma ve kapatma sürecini otomatikleştirmenize olanak tanırken, göstergeler piyasa davranışını daha doğru bir şekilde tahmin etmenize yardımcı olur.
Bu sayfa, MetaTrader 5 uygulamalarının kataloğunu içermektedir. 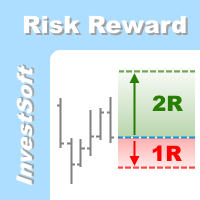
This is the forex visual orders tool & forex position size (lot) calculator with intuitive panel. Risk Reward Ratio Indicator works on all kind of symbols: currency pairs, indices, metals, commodities, cryptocurrencies, etc.
If you want to make sure that Risk Reward Ratio Indicator works on your favorite symbols contact us ( visit our profile ) and ask for 7-day free trial to test this tool without limits. If you want to place orders easier, faster and more intuitive? If you like to mark trad
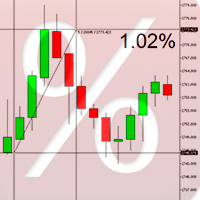
Percent Crosshair is a powerful and easy percentage measure tool. Measure the chart percentage very quick! Don't waste your time anymore! Just attach the Percent Crosshair indicator in the chart, select crosshair mode at toolbars or press "Ctrl+F" and start using the crosshair as you always do! The percent measure will be next to the indicative price. Customize your indicator the way you want! There are 4 entry parameters: Positive % color: set the desired color when % is positive. Negative % co

The Volume indicator is an excellent tool for measuring tick volume or real volume activity. It quickly and easily helps traders evaluate the volume's current size. The indicator for classification of the volume size uses the moving average and its multiples. Accordingly, the area where the volume is located (relative to the moving average) is labeled as ultra-low, low, average, high, very high, or ultra-high. This indicator can calculate the moving average by four methods: SMA - Simple Moving

The ATR indicator is a helpful tool for measuring the range of bars. It quickly and easily helps evaluate the ATR's current spread (range), which is especially useful for VSA traders. The indicator for classifying the range of bars (candles) uses the moving average and its multiples. Accordingly, the area where the volume is located (relative to the moving average) is labeled as ultra-low, low, average, high, very high, or ultra-high. Our ATR indicator is rendered as a histogram. This indic
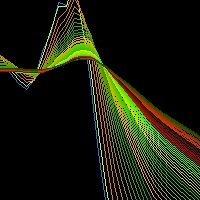
Moving Average RAINBOW Forex traders use moving averages for different reasons. Some use them as their primary analytical tool, while others simply use them as a confidence builder to back up their investment decisions. In this section, we'll present a few different types of strategies - incorporating them into your trading style is up to you! A technique used in technical analysis to identify changing trends. It is created by placing a large number of moving averages onto the same chart. When a

The signal is generated using standard Gator indicator. Gator Oscillator is based on Alligator and shows the degree of convergence/divergence of its balance lines (smoothed Moving Average). The upper histogram is the absolute difference between the values of blue and red lines. The lower histogram is the absolute difference between the values of red and green lines with the 'minus' sign since the histogram moves downwards. The EA works with any Forex symbol. Optimization is performed for one wee

This is a professional robot based on the Parabolic SAR indicator set. The Expert Advisor is designed for the analysis of trending markets. On the "bull market" the indicator is below the prices, on the "bearish market" it is above the price. If the price crosses the Parabolic SAR lines, the indicator reverses, and its further values are located on the other side of the price. The EA correctly processes errors and works reliably in the market. It can work with the initial deposit of $100! It i

KL Visual Risk Manager Pro – the tool for traders for whom capital preservation is a top priority. Let me present my new revolutionary method of sending orders according to what you see on a chart, which is in full accordance with Risk Management. Sending orders without human errors, using an appropriate currency pair, without gambling a lot size and with SL and TP set on chart according your technical analysis and methodology - all these are made in four mouse clicks and in a matter of seconds.

This indicator is based on the classical indicator RSI (Relative Strangth Index) and will be helpful for those who love and know how to use not a visual but digital representation of the indicator. All TimeFrames RSI MT5 indicator shows values from each timeframe. You will be able to change the main input parameters for each RSI for every TF. Example for M1: sTF1_____ - label (string) of M1 TF. Period1 - number of bars used for the indicator calculations. Price1 - price used. Can be any of the p

The product works with any Forex pair. The Expert Advisor is designed for intraday trading. The signal is generated by means of the AC indicator using different combinations of signal generation according to the indicator data. Optimization is performed for one week on a minute chart. The predicted time before re-optimization is one week as well. The screenshots show examples of optimization and forecast. The first parameter (the top one when sorting by the result) is selected for the used param

This is a ready-made professional position tracking system. It works on all currency pairs and timeframes. The product processes the errors correctly and works on the market efficiently. The trading robot applies basic concepts - breakeven and trailing. The trailing is based not on indicators but on the last bar of the specified time interval ( TrailingStep Period ) or points ( Trailing Stop =0). Parameters: Deviation – requotes. Sleeps – waiting for position modification. Trailing Period – the
The Commodity Channel Index computes the deviation of the typical price of each bar from the average price over a particular time period. Multiplying the median deviation by 0.015 facilitates normalization, which makes all deviations below the first standard deviation less than -100, and all deviations above the first standard deviation more than 100. This adaptive version is based on the indicator described by John Ehlers, in the book Rocket Science for traders. The indicator uses the homodyne
FREE

The Relative strength index is an oscillator that follows price, it was introduced by Welles Wilder, who went on to recommend the 14 period RSI. This adaptive version is based on the indicator described by John Ehlers, in the book 'Rocket Science for Traders'. The indicator uses the homodyne descriminator to compute the dominant cycle. To apply the homodyne descriminator, real and imaginary parts have to be calculated from the Inphase and Quadrature components. (Inphase and Quadrature components
FREE
Complete Pending Orders Grid System opens any combinations of Buy Stop, Sell Stop, Buy Limit and Sell Limit pending orders and closes all existing pending orders. You just need to drop this script on the chart of a desired currency pair. Before placing all pending orders, the input window is opened allowing you to modify all input parameters: DeleteAllPendings – if 'true', then all pending orders (for current currency) are deleted. BuyStop – if 'true', Buy Stop order is opened. SellStop – if 'tr

BuyLimit_SellLimit_Grid script opens Buy Limit and Sell Limit pending orders. You just need to drop this script on the chart with a desired currency pair. Before placing all pending orders, the input window is opened allowing you to modify all input parameters: DeleteAllPending – if 'true', all pending orders are deleted. BuyLimit – if 'true', Buy Limit order is opened. SellLimit – if 'true', Sell Limit order is opened. InitLot – initial lot. LotCoeff – if 1, all pending orders have the same lot

BuyStop_SellStop_Grid script opens BuyStop and SellStop pending orders and deletes all existing pending orders. You just need to drop this script on the chart with a desired currency pair. Before placing all pending orders, the input window is opened allowing you to modify all input parameters: DeleteAllPending - if TRUE, then all pending orders are deleted; BuyStop - if TRUE, BuyStop order is opened; SellDtop - if TRUE, SellStop order is opened; InitLot - initial lot; LotCoeff - if 1, all pen

This indicator is based on the classical indicator Parabolic SAR and will be helpful for those who love and know how to use not a visual, but digital representation of the indicator. All TimeFrames PSAR MT5 indicator shows values from each timeframe (M1, M5, M15, M30, H1, H4, D1, W1 and MN1). You will be able to change the main input parameters for each Stochastic from every TF. Example for M1: sTF1 = M1 pStep1 = 0.02 pMax1 = 0.2

Bollinger Bands Technical Indicator (BB) is similar to envelopes. The only difference is that the bands of Envelopes are plotted a fixed distance (%) away from the moving average, while the Bollinger Bands are plotted a certain number of standard deviations away from it. Standard deviation is a measure of volatility, therefore Bollinger Bands adjust themselves to the market conditions. When the markets become more volatile, the bands widen and they contract during less volatile periods. This ada
FREE

This indicator is based on the classical indicator CCI (Commodity Channel Index) and will be helpful for those who love and know how to use not a visual but digital representation of the indicator. All TimeFrames CCI MT5 indicator shows values from each timeframe. You will be able to change the main input parameters for each CCI for every TF. Example for M1: sTF1_____ = "M1"; Period1 = 13; Price1 = PRICE_CLOSE.

This indicator is based on the classical STOCHASTIC indicator and will be helpful for those who love and know how to use not a visual, but digital representation of the indicator. All TimeFrames Stochastic MT4 indicator shows values from each timeframe (M1, M5, M15, M30, H1, H4, D1, W1 and MN1). You will be able to change the main input parameters for each Stochastic from every TF. Example for M1: sTF1_____ = M1 K_Period1 = 5 D_Period1 = 3 S_Period1 = 3 Method1 = MODE_EMA
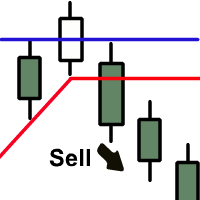
The indicator plots two lines by High and Low prices. The lines comply with certain criteria. The blue line is for buy. The red one is for sell. The entry signal - the bar opens above\below the lines. The indicator works on all currency pairs and time frames It can be used either as a ready-made trading system or as an additional signal for a custom trading strategy. There are no input parameters. Like with any signal indicator, it is very difficult to use the product during flat movements. You
FREE

Many indicators are based on the classical indicator Moving Average . The indicator All_TF_MA shows crossing of 2 MA from each TimeFrames . You will be able to change main input parameters for each MA for every TF. Example for M1 TF: Period1_Fast = 5 Method1_Fast = MODE_EMA Price1_Fast = PRICE_CLOSE Period1_Slow = 21 Method1_Slow = MODE_SMA Price1_Slow = PRICE_TYPICAL

The Zig-Zag indicator is extremely useful for determining price trends, support and resistance areas, and classic chart patterns like head and shoulders, double bottoms and double tops. This indicator is a Multi Time Frame indicator. The indicator is automatically calculate the 3 next available TF and sows ZigZag from those TimeFrames. You cannot use this indicator for the TF greater than D1 (daily). You have to have ZigZag indicator in the Indicators/Examples tab.
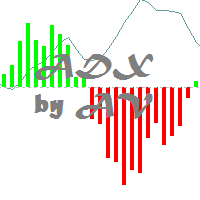
This is an unusual representation of the Average Directional Movement Index. The indicator has been developed at the request of a trader and for the purposes of learning the development of indicators in MQL5. The line shows the same as the standard Average Directional Movement Index (ADX); The upward histogram shows the difference between +DI and -DI, when +DI is above -DI; The downward histogram shows the difference between +DI and -DI, when +DI is below -DI.
FREE
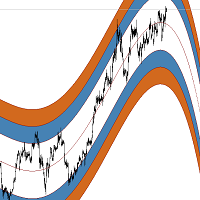
ExpertRegression is a professional trading robot, which implements the classic trading strategy inside a channel based on regression signal. The signal is formed at a breakthrough of the upper and lower limits of the regression range. If the price pierces the upper border of the regression and the price is fixed above this border, it is the signal for buying. If the price pierces the lower border of the regression and the price is fixed below this border, then it's the signal for selling. Can wo

The script allows to close all opened positions if Sum of Profit from all opened positions is greater than value of the input parameter: SumProfit .
Input parameters SumProfit = 100 You can change SumProfit to any positive value ( in dollars , not in the points!). This script will close all positions for a given currency pair only. Keep in mind that you have to " Allow automated trading " on the "Expert Advisors" tab (Tools->Options).
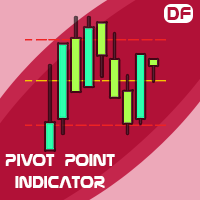
This indicator calculates support and resistance prices in multi-timeframe with different formulation and draw them on the chart that style do you choose. And If you want, Indicator can alert you when the current price arrive these pivot levels. Formulations: Classic, Camarilla, Woodie, Demark, Floor, Fibonacci
Alert Options: Send Mobil Message, Send E-mail, Show Message, Sound Alert
Levels: PP, S1, S2, S3, S4, S5, R1, R2, R3, R4, R5, TC, BC and Middle Points Why do you need this indicator:
Ti
FREE

This indicator calculates the next possible bar for each currency pair and timeframe. If the next possible Close will be greater than Open, the next possible bar will be in Aqua color. If the next possible Close will be less than Open, the next possible bar will be in Orange color. Of course, the next possible bar will not show the big price movement. This indicator is most useful in the quiet time.

The signal is formed in the direction of Momentum. The product processes the errors correctly and works on the market efficiently. It can work with the deposit as small as $100! The signal can also be inverted. The Expert Advisor also has built-in progressive optimization sorting function, i.e., it is recommended that the optimization is performed in Custom max mode.
Parameters OnOptimizationSharp —Additional Sharpe ratio is used when optimizing in Custom max mode. Work Period —Expert Advisor's

The idea of enhancing the free Slider utility appeared after the release of a lite version of the EA trade panel Trading Chaos Expert Lite , which operates in the Current Chart mode without the possibility to maintain trades of several symbols in a single window. The purpose of Slider profy Ease search for trading signals by automatic display of charts of currency pairs from the "Market Watch" one by one at a specified interval of time in seconds. Automation of one-click placing of pending ord
FREE

This indicator is designed for M1 timeframe and shows: sum of ticks when the price goes up divided by sum of ticks when the price goes down (red color); sum of points when the price goes up divided by sum of points when the price goes down (green color). The correlation between the number of ticks and the number of points for each and every minute will give enough data for scalping.

Introduction to Harmonic Pattern Scenario Planner
The present state of Forex market can go through many different possible price paths to reach its future destination. Future is dynamic. Therefore, planning your trade with possible future scenario is an important step for your success. To meet such a powerful concept, we introduce the Harmonic Pattern Scenario Planner, the first predictive Harmonic Pattern Tool in the world among its kind.
Main Features Predicting future patterns for scenario

News Trader Pro is a unique robot that allows you to trade the news by your predefined strategy. It loads every piece of news from several popular Forex websites. You can choose any news and preset the strategy to trade it, and then News Trader Pro will trade that news by selected strategy automatically when the news comes. News release gives opportunity to have pips since the price usually has big move at that time. Now, with this tool, trading news becomes easier, more flexible and more exciti

Trade Receiver Free is a free tool to copy trades/signals from multiple MT4/MT5 accounts. The provider account must use copier EA to send the signal. This version can be used on MT5 accounts only. For MT4 accounts, you must use Trade Receiver Free . Reference: - For MT4 receiver, please download Trade Receiver Free .
- For MT5 receiver, please download Trade Receiver Free MT5 .
- For cTrader receiver, please download Trade Receiver Free cTrader .
- If you only need copy from MT4 account to u
FREE

This is a utility created to ease charts watching on tablet PCs. The indicator allows you automatically alternately display "slide show" of all currency charts from "MarketWatch". The user can set the display time interval (in seconds) between charts in indicator settings. In addition, there is an option of selecting the angle of Start/Stop button which starts and stops the display of charts. This function is very useful if a trader noticed a trading signal and would like to study it in more det
FREE
This indicator shows the ratio of the number of buyers'/sellers' orders for the Russian FORTS futures market. Now, you can receive this information in real time in your МetaТrader 5 terminal. This allows you to develop brand new trading strategies or improve the existing ones. The data on the ratio of the orders number is received from the database (text CSV or binary one at user's discretion). Thus, upon completion of a trading session and disabling the terminal (or PC), the data is saved and u
This indicator shows the ratio of the volume of buyers'/sellers' orders for the Russian FORTS futures market. Now, you can receive this information in real time in your МetaТrader 5 terminal. This allows you to develop brand new trading strategies or improve the existing ones. The data on the ratio of the volumes of orders is received from the database (text CSV or binary one at user's discretion). Thus, upon completion of a trading session and disabling the terminal (or PC), the data is saved a

The indicator is designed for easy construction of synthetic charts based on data of various financial instruments. It will be useful both arbitrage and pair trading, as well as for analysis purposes. Its main advantage is simplicity and clarity. Each chart is given as a common mathematical formula. For example, if you want to plot the spread (difference) between EURUSD and GBPUSD with coefficients 4 and 3, then set the following formula: EURUSD * 4 - GBPUSD * 3 The resulting chart is shown in t
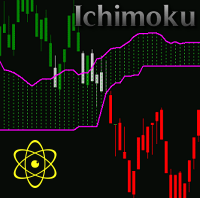
This is a professional trading robot, which implements the classical Ichimoku based trading strategy. A signal is formed when the Ichimoku trend changes. For this purpose we will analyze intersection of the Tenkan-sen and Kijun-sen lines. The signal to buy is generated when the Tenkan-sen line crosses the Kijun-sen bottom-up. The top-down crossing is the signal to sell. The EA correctly processes errors, and works reliably in the market. Can work with the initial deposit from $100! It is importa

News Loader Pro is a tool that automatically updates every economic news in real time with detailed information from several online data sources. It uses the unique technology to load data with full details from popular Forex websites. An alert will be sent to your mobile/email before an upcoming news release. Moreover, it also marks the news release points on the chart for further review and research. In Forex trading, news is one of the important factors that move the market. Sticking with ne
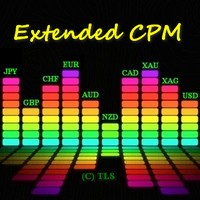
Algoritma, Para Birimi Güç Ölçer göstergesi fikrine dayanmaktadır. Bu versiyonda, görüntülenen değerlerin sayısı sınırsızdır, kodu daha kompakt ve hızlıdır, mevcut çubuğun değerleri gösterge tamponları aracılığıyla elde edilebilir. Göstergenin gösterdiği şey : ince bir bant ve para biriminin önündeki üst sayı, son N saat için bağıl güç endeksini gösterir (N, 'Saat' değişkenindeki parametrelerde ayarlanır), daha geniş bir bant günlük endeksi gösterir. Giriş parametrelerinde bu para birimini ne
FREE
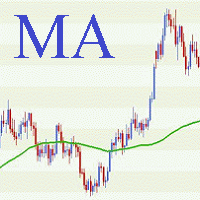
This is a professional trading robot, which implements the classic strategy of trading on price crossing MA. When the price crosses a moving average, a Buy or a Sell signal is formed. Signal direction is set up in the EA parameters. The EA correctly processes errors, and works reliably in the market. Can work with the initial deposit from $100! It is important to choose the direction of the EA operation: both sides, only buy or only sell. The Expert Advisor uses the basic concepts, breakeven, tr
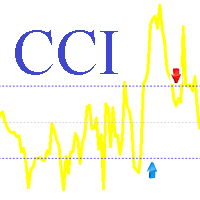
This is a professional trading robot, which implements the classical CCI based trading strategy. The signal is produced upon exiting of CCI from the overbought/oversold areas; the levels of those areas will be levels with the values of LevelMax and LevelMin . We buy, as CCI falls lower then level LevelMin and then rises above it. We sell, as CCI rises above level LevelMax and then falls below it. Also, the signal can be inverted. The EA correctly processes errors, and works reliably in the marke
The indicator determines and marks the short-term lows and highs of the market on the chart according to Larry Williams` book "Long-term secrets to short-term trading". "Any time there is a daily low with higher lows on both sides of it, that low will be a short-term low. We know this because a study of market action will show that prices descended in the low day, then failed to make a new low, and thus turned up, marking that ultimate low as a short-term point. A short-term market high is just
FREE

This is a professional trading robot, which implements the classical Envelopes based trading strategy. A signal is generated when prices rolls back from the boundaries of the Envelopes. If the price pierces or touches the upper border of the Envelopes channel and then returns back, it's the signal to sell. If the price pierces or touches the lower border of the Envelopes channel, it's the signal to buy. The EA correctly processes errors and works reliably in the market. It is important to choose

Isı Haritası Göstergesi Bu Isı Haritası göstergesi, Piyasa İzleme'de seçilen tüm sembollerin bir "ısı haritasını" görüntülemenizi sağlar. Bu versiyonda, son günlük kapanışa göre yüzde fiyat değişimini gösterir , bu da piyasaya hızlı bir genel bakış sağlayabilir. Bu, yatırımcıların bir para biriminin diğer tüm çiftlere göre ne kadar güçlü olduğunu belirlemelerine yardımcı olan bir araçtır. Bu görsel bir araçtır ve Uzman Danışmanlar içinde kullanılamaz. Bu anlamda, otomatik tüccarlar yerine daha ç
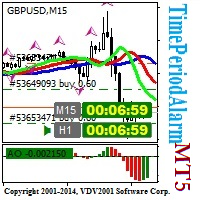
The TimePeriodAlarm indicator shows time till closure of a bar. If the 'Time period' is specified explicitly (i.e. not 'current'), the indicator displays the time till bar closure of the current period and the explicitly specified period. Ten seconds before the closure of the bar (at the period specified explicitly), a preliminary sound alert is played and a color alert is generated, then the main signal (can be set by the user) in the parameter 'Sound file(.wav)' is played. The sound file shoul

This is a multiple timeframe version of the classic Parabolic SAR indicator (stands for "stop and reverse"). PSAR follows price being a trend following indicator. Once a downtrend reverses and starts up, PSAR follows prices like a trailing stop. You can choose the timeframes for displaying PSAR on the chart. Of course, you can see PSAR only from the current and higher timeframes. Input parameters: bM15 - PSAR from M15 bM30 - PSAR from M30 bH1 - PSAR from H1 bH4 - PSAR from H4 bD1 - PSAR from D1
This is a utility for storing the data on open interest (OI), ratio of buyer/seller orders' number and the ratio of buyer/seller orders' volumes on the Russian FORTS futures market. This is the first product of the series. Now, you can trace history of the specified data in real time in МТ5 terminal. This allows you to develop brand new trading strategies or considerably improve the existing ones. The data received from FORTS market is stored as a database (text CSV or binary one at user's discr
FREE
This is an open interest indicator for the Russian FORTS futures market. Now, you can receive data on the open interest in real time in МТ5 terminal. This allows you to develop brand new trading strategies or considerably improve the existing ones. The data on the open interest is received from the database (text CSV or binary one at user's discretion). Thus, upon completion of a trading session and disabling the terminal (or PC), the data is saved and uploaded to the chart when the terminal is

Trade Copier Pro MT5 is a tool to copy trade remotely to multiple MT4, MT5 and cTradfer accounts at different computers/locations over internet. This is an ideal solution for you if you are a signal provider and want to copy your trades to other receivers globally on your own rules. One provider can copy trades to multiple receivers and one receiver can get trade from multiple providers as well. The provider can even set the subscription expiry for each receiver, so that receiver will not be abl
Attention: Demo version for review and testing can be downloaded here . It does not allow trading and can only be run on one chart. Active Lines - a powerful professional tool for operations with lines on charts. Active Lines provides a wide range of actions for events when the price crosses lines. For example: notify, open/modify/close a position, place/remove pending orders. With Active Lines you can assign several tasks to one line, for each of which you can set individual trigger conditions

Trade in the opposite directions with HedgeTerminal HedgeTerminal is a full-featured trading terminal inside MetaTrader 5. This is a graphic panel resembling MetaTrader 4 terminal. It allows you to track oppositely directed positions in the manner it is possible in MetaTrader 4. In other words, we can open unlimited number of positions on a single symbol even if positions are in complete or partial hedge (lock). Thus, you can maintain long and short positions simultaneously, which is impossible
FREE
Introduction to Sideways Market Analyzer Notable period of Low volatility and non-trending movements in the financial market is considered as Sideways Market. Sooner or later, the low volatility will increase and the price will pick up a trend after Sideways Market. In terms of trading point of view, Sideways Market can serve as the very good entry timing for traders. Sideways Market is also quite often the representation of accumulation of large orders from big investors. Therefore, knowing the

Trade Controller provides multiple methods to protect and maximize your profits. This powerful weapon helps you to set the protect and trailing-stop rules on your trade automatically in many effective methods. Once it is set and turned on, you don't need to monitor your orders anymore, the software will keep watching and control your orders with your predefined rules. It's designed to support multi-protection and trailing strategy: Protect by break-even, protect by percentage, protect by pip, pr
Vates is a Latin word meaning a prophet. Vates is a multicurrency trend Expert Advisor that can run on any type real accounts, on any timeframe, with any initial deposit, with a fixed or varying lot size, with four and five-digit quotes, with brokers offering different order filling types. A distinctive feature of the EA is its stability and reliability. The results of Expert Advisor testing in the Strategy Tester in four modes (two main modes – normal and with a delay, and two additional modes

My Money Manager like a risk controller, which places your trades with the exact volume that meets your desired stop loss risk percentage. It can also help you to preview your EP/SL/TP levels before placing an order by dragging these levels directly on a chart, and keep reporting about them during the position opening. With this tool, you will feel more comfortable when deciding to open orders, as well as forecasting your profit/loss with your orders. Placing orders is a very precise and profess

This tool is designed to measure the distance between two points on a chart and much more.
List of measured values:
Distance in points Profit (with and without spread) Time difference Percentage price change Slope angle Number of bars (various variations) Ratio of distance in points to the reference value Features:
Snap to OHLC prices Automatic color profile setting based on chart background color Various types of pointers to choose from Display of values of selected points on th
FREE

The Expert Advisor works with ticks on both netting and hedging account types. The internal algorithm uses a tick (not a bar) as a unit for analysis. The product works with 5-digit quotes. Requotes are critical. A broker with the minimum execution delay is required. The Expert Advisor does not use history stored in the database. It downloads history data online creating its own database stored in the internal memory. After the restart, the database is deleted and should be downloaded again. The

Currency Power Meter shows the power of major currencies against each other. The indicator shows the relative strength of currency/pair at the current moment in a period of time (H4, daily, weekly, monthly). It is useful for day traders, swing traders and position traders with suitable period options. Currency power is the true reason of market trend: The strongest currency against the weakest currency will combine into a most trending pair. As we know, trend makes money and all traders love tre
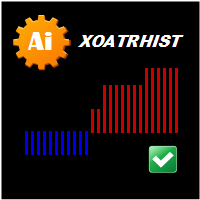
Version for MetaTrader 5. The indicator is based on point and figure chart, but their period is equal to ATR indicator values. Displays in the form of steps. Steps above zero indicate an uptrend. Below zero on a downtrend. Parameters: ATRPeriod - ATR period for calculation of steps. Note: The indicator uses closes price, thus it is recommended to consider completed bars.

Trend indicators tell you which direction the market is moving in , if there is a trend at all because they tend to move between high and low values like a wave
This indicator shows Up Trend (Green Histogram), Down Trend (Red Histogram) and Sideways Trend (Yellow Histogram). Only one input parameter: ActionLevel. This parameter depends of the length of the shown sideways trend.

MAPC (Moving Average Percent's Change) shows the Moving Average's percent change from one period to another selected period allowing you to track the smoothed price change rate. MAPC is calculated according to the following equation: MAPC[i] = 100 * (MA[i] - MA[i - n]) / MA[i], where: MA[i] - current Moving Average value; MA[i - n] - value of the Moving Average that is n periods away from the current Moving Average value.
Input Parameters Period - Moving Average period; Method - smoothing me
FREE

MA Crossing displays two moving averages on the chart painting their crossing points in different colors - blue (buy) and red (sell). The indicator clearly defines the trend direction and power and simplifies the perception of market signals. The indicator may be useful in the strategies involving two moving averages' crossing method. The indicator's input parameters allow you to select the following settings for each moving average: period (Fast Period, Slow Period); smoothing period (Simple, E
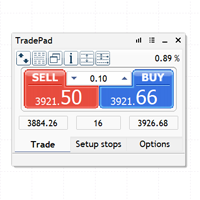
TradePad hem manuel hem de algoritmik ticaret için bir araçtır. Size hızlı ticaret işlemleri ve çeşitli ticaret enstrümanlarındaki pozisyonların kontrolü için basit bir çözüm sunuyoruz. Dikkat, uygulama strateji test cihazında çalışmıyor! Demo hesabı için uygulamanın deneme sürümü ve tüm araçların açıklaması Uygulama arayüzü yüksek çözünürlüklü monitörler için uyarlanmıştır, basit ve sezgiseldir. Rahat bir çalışma için, tüccara aşağıdaki araç seti sunulur: Ticaret işlemlerini yönetmek, ana grafi
Only Exponential Moving Average at Close Price is used in standard Bulls Power limiting the possibilities of that indicator to some extent. Bulls Power Mod enables you to select from four Moving Averages and seven applied prices, thus greatly expanding the indicator's functionality.
FREE
Only Exponential Moving Average at Close Price is used in standard Bears Power limiting the possibilities of that indicator to some extent. Bears Power Mod enables you to select from four Moving Averages and seven applied prices, thus greatly expanding the indicator's functionality.
FREE

В стандартном индикаторе DeMarker используется простая скользящая средняя - Simple Moving Average, что несколько ограничивает возможности этого индикатора. В представленном индикаторе DeMarker Mod добавлен выбор из четырех скользящих средних - Simple, Exponential, Smoothed, Linear weighted, что позволяет существенно расширить возможности данного индикатора. Параметры стандартного индикатора DeMarker: · period - количество баров, используемых для расчета индикатора; Параметры индикат
FREE

This indicator is a visual combination of 2 classical indicators: Bulls and MACD. Usage of this indicator could be the same as both classical indicators separately or combined. Input parameters: BearsPeriod = 9; ENUM_MA_METHOD maMethod = MODE_SMA; ENUM_APPLIED_PRICE maPrice = PRICE_CLOSE; SignalPeriod = 5.

This indicator gives full information about the market state: strength and direction of a trend, volatility and price movement channel. It has two graphical components: Histogram: the size and the color of a bar show the strength and direction of a trend. Positive values show an ascending trend and negative values - a descending trend. Green bar is for up motion, red one - for down motion, and the yellow one means no trend. Signal line is the value of the histogram (you can enable divergence sea
FREE
MetaTrader Mağazası, MetaTrader platformu için uygulama satın almak adına rahat ve güvenli bir ortam sunar. Strateji Sınayıcıda test etmek için Uzman Danışmanların ve göstergelerin ücretsiz demo sürümlerini doğrudan terminalinizden indirin.
Performanslarını izlemek için uygulamaları farklı modlarda test edin ve MQL5.community Ödeme Sistemini kullanarak istediğiniz ürün için ödeme yapın.

Alım-satım fırsatlarını kaçırıyorsunuz:
- Ücretsiz alım-satım uygulamaları
- İşlem kopyalama için 8.000'den fazla sinyal
- Finansal piyasaları keşfetmek için ekonomik haberler
Kayıt
Giriş yap
Web sitesi politikasını ve kullanım şartlarını kabul edersiniz
Hesabınız yoksa, lütfen kaydolun