 MetaTrader 5
 Experts
 지표
 라이브러리
 유틸리티
 위젯
 규칙
MetaTrader 5용 새 Expert Advisor 및 지표 - 510
 트레이딩 로봇과 지표를 사용하여 외환 거래를 더 수익성 있게 만들 수 있습니다. 트레이딩용 로봇을 사용하면 개점 및 폐점 거래를 자동화할 수 있으며, 지표는 시장 행동을 보다 정확하게 예측할 수 있습니다.
이 페이지에는 MetaTrader 5 응용 프로그램의 카탈로그가 나와 있습니다.
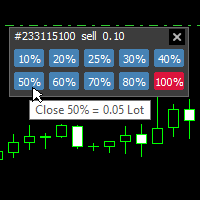
With this tool, you can easily and quickly close part of the trade. Click near the trade to display the closing panel. There are ten preset values for partial closing, but you can set your own values. You can also resize the panel according to Windows settings (125%, 150% ...) See the animation below for how it works. **********************************************************
Note: This tool does not work in the tester.

• Please test the product in the Strategy Tester before purchasing to understand how it works.
• If you face any issues, contact me via private message—I’m always available to help.
• After purchase, send me a screenshot of your order to receive a FREE EA as a gift.
Time frame: M1
Leverage : Higher the better
Spread: Lower the better
Account type : All types
(EA may enter hedge positions, if you want to
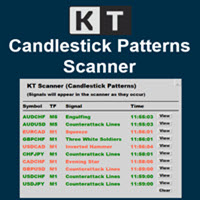
KT Candlestick Patterns Scanner is a Multi-Symbol and Multi-Timeframe scanner that fetches and shows various candlestick patterns on 28 currency pairs and 9 time-frames concurrently . The scanner finds the candlestick patterns by loading the KT Candlestick Patterns indicator as a resource in the background.
Features
The scanner can find the candlestick patterns on 252* combinations of symbols and time-frames from a single chart. Open the signal's chart loaded with a predefined template with a s

• Please test the product in the Strategy Tester before purchasing to understand how it works.
• If you face any issues, contact me via private message—I’m always available to help.
• After purchase, send me a screenshot of your order to receive a FREE EA as a gift.
Time frame: M1
Leverage : Higher the better
Spread: Lower the better
Account type : All types
(EA may enter hedge positions, if you want to
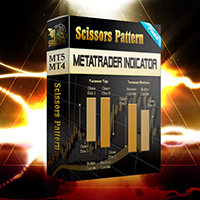
Configure scaffolding charts and signals based on the scissor pattern, which works great at low times.
Buy and sell signs based on 2 previous candle patterns
It works on the active time form, and when detecting the pattern in 4 time frames, 5 minutes, 15 minutes, 30 minutes and one hour, the alert can be set to notify us of the formation of this pattern.
MetaTrader version 4 click here
How to use:
When there is an opportunity to buy or sell, the marker places a scissors mark on the candle

• Please test the product in the Strategy Tester before purchasing to understand how it works.
• If you face any issues, contact me via private message—I’m always available to help.
• After purchase, send me a screenshot of your order to receive a FREE EA as a gift.
Time frame: M1
Leverage : Higher the better
Spread: Lower the better
Account type : All types
(EA may enter hedge positions, if you want to

With this indicator you have displayed on the chart the optimal lot size for the forex pair. No need for manual calculations or losing time on websites where you have to input the values to get the optimal lot size. The indicator values are preset for maximum percentage risk is 2% and for maximum pips loss is 50. For a customizable version you can buy using the this LINK . ATTENTION: This only works with forex pairs and it doesn't work on account deposits in YENS!!!!!!
FREE

With this indicator you have displayed on the chart the optimal lot size for the forex pair. No need for manual calculations or losing time on websites where you have to input the values to get the optimal lot size. When adding the indicator to your chart change the values for maximum risk percentage (lossPrc) and for maximum loss in pips (lossInPips). If you like to try first the indicator you can download by clicking on this LINK . ATTENTION: This only works with forex pairs and it doesn't wor
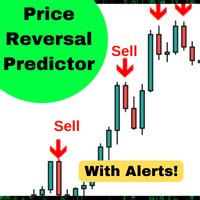
이 알고리즘은 90%*정확도로 가격의 단기 변화를 예측합니다. 가격이 신호 촛불보다 높거나 낮은 경우 예측한다. 더 큰 시간 프레임에 평균 복귀 거래,바이너리 옵션 또는 선물 계약에 적합합니다. 이 지표는 5 년간의 데이터에 대해 백 테스트되었으며 시간 경과에 따른 가격 반전을 예측하는 데 90%의 정확도가 있습니다.
특징::
간단한 설정 모든 차트로 드래그 앤 드롭 경고 사용(선택 사항) 그리고 당신은 완료! 시각 및 오디오 경고 휴대 전화로 직접 전송 경고 터미널로 전송 된 팝업 알림 높은 승률 거래의 90%까지 승리 백 테스트 5 년 여러 통화. (백 테스트 세부 정보 및 분석은 웹 사이트를 참조하십시오). 많은 수의 신호 활성 모드에서 심볼 당 하루에 3~6 개의 신호를 기대합니다 기대 1 에 2 수동 모드에서 기호 당 하루 신호. 당신이 표시가있는 경우*이입니다 30 분 촛불. 유연한 외환,지수,상품 및 주식에서 작동합니다. 어떤 시간 프레임에서 작동 매일 바 5 분에
FREE

DYJ CashRegisterEA는 DYJ 기술 지표에 주력하고 있습니다.시장이 강할 때, 가격은 높은 위치에 있고, 가격은 낮은 위치에 있을 때 많다.하루 종일 거래 유지
이것이 바로 안전 시장에서의 기회와 거래다.안전한 거래 시간과 일치하는 수익.
EA는 단일 주문 패턴을 사용하여 거래량을 최소화하고 이윤 결제 알고리즘을 극대화하는 전략을 사용한다.DYJ 기술 지표에 따라 자동으로 창고를 닫고 EA는 항상 1개의 주문을 유지한다
격자 거래가 없습니다.
차익이 없다.
맞히지 않았습니다.
마틴이 없어요. Please download the setting file and the PDF file of the back test report in the product comment area
권장 사항
최소 저장 $100, 권장 $1000 이상 Synthetic and Forex. Developed for M1, Crash 500 Index. Backtest: Deposit $100 DD
이 알고리즘은 86%*정확도로 단기간의 가격 변화를 예측합니다. 과매수 또는 과매도 상태인 경우,이 표시기가 사용자에게 알립니다. 가격이 신호 촛불보다 높거나 낮은 경우 예측한다. 더 큰 시간 프레임에 평균 복귀 거래,바이너리 옵션 또는 선물 계약에 적합합니다. 이 지표는 5 년간의 데이터에 대해 백 테스트되었으며 시간 경과에 따른 가격 반전을 예측하는 데 90%의 정확도가 있습니다.
특징::
간단한 설정 모든 차트로 드래그 앤 드롭 원하는대로 매개 변수 조정(선택 사항) 경고 사용(선택 사항) 그리고 당신은 완료! 시각 및 오디오 경고 휴대 전화로 직접 전송 경고 터미널로 전송 된 팝업 알림 높은 승률 거래의 90%까지 승리 백 테스트 5 년 여러 통화. (백 테스트 세부 정보 및 분석은 웹 사이트를 참조하십시오). 많은 수의 신호 기대 1 에 2 기호 당 하루 신호*. 당신이 표시가있는 경우*이입니다 30 분 촛불. 유연한 외환,지수,상품 및 주식에서 작동합니다. 어떤 시간
FREE
명확한 MACD 모멘텀 신호 KT MACD Alerts는 깔끔한 색상 구분 MACD 화면을 통해 시장 방향과 모멘텀의 변화를 쉽게 파악할 수 있도록 도와줍니다. 상승 및 하락 교차를 명확하게 확인할 수 있으며, 차트의 수직선과 유연한 알림 기능이 새로운 신호에 빠르게 주목할 수 있도록 지원합니다. 신호는 캔들이 마감된 후 확정되므로 차트 전반의 MACD 모멘텀 변화를 명확하고 일관되게 확인할 수 있습니다. 상승 및 하락 상태를 색상으로 구분한 MACD 표시. 교차 신호를 빠르게 찾을 수 있는 선명한 수직선. 조정 가능한 MACD 기간과 적용 가격. 선 색상, 굵기, 스타일 및 차트 확장 설정 지원. 9개 시간대 MACD 스캐너 내장 대시보드는 현재 차트 종목의 MACD 방향을 M1, M5, M15, M30, H1, H4, D1, W1, MN1의 9개 시간대에서 보여줍니다. 각 행은 최신 확정 데이터를 사용해 Bullish, Bearish 또는 Neutral을 표시하므로 단기 모멘텀과
개요:
스트래들 스캘퍼는 특정 시간 및/또는 요일에 스트래들을 여는 EA입니다. 이익실현은 ATR 비율을 사용하여 동적으로 생성됩니다.
요구 사항:
스트래들을 개설하려면 헤징 계정이 필요합니다. 엄격한 최적화(공개 가격)는 필수입니다.
스트래들이란?
스트래들은 매수와 매도를 동시에 여는 행위입니다.
이 EA는 어떻게 작동합니까?
성공적으로 최적화된 후 EA는 최적화에 의해 지정된 각각의 새로운 막대(H1 시간 프레임)에서 스트래들을 엽니다. 신규 거래 개시 결정은 요구되는 최소 변동성(ATR에 의해 측정되고 거래 내역에 대해 통계적으로 측정됨)에 따라 이루어집니다. A 최적화에 의해 계산된 ATR 비율에 따라 이익실현이 동적으로 배치됩니다. 동시에 1 또는 2개의 거래만 있을 수 있으며 이익 실현 또는 새로운 바에 의해 마감됩니다. 이 EA는 헤징, 그리드, 마틴게일 시스템을 사용하지 않습니다.
최적화하는 방법? 사진을 보시면 최적화 설정 파일의 기본 설정을 보여주는

KT Coppock Curve는 평활화된 모멘텀 값을 시장 방향을 보기 쉬운 형태로 보여 줍니다. 가격 차트 아래의 별도 창에 표시되며, 제로 라인이 가장 중요한 기준이 됩니다. 곡선의 작은 변화마다 반응하는 대신 모멘텀이 상승 쪽에 있는지 하락 쪽에 있는지를 빠르게 확인할 수 있습니다. 이 곡선은 장기와 단기의 변화율을 결합한 뒤 결과를 평활화합니다. 따라서 빠른 오실레이터에서 자주 나타나는 노이즈를 어느 정도 줄이면서 더 큰 모멘텀 변화를 추적하는 데 유용합니다. 먼저 위치를 보고 그다음 교차를 확인하세요 곡선이 제로 위에 있으면 양의 모멘텀이 우세합니다. 제로 아래에 있으면 음의 모멘텀이 우세합니다. 곡선이 제로 라인의 한쪽에 계속 머무르면 캔들 하나마다 관점을 바꾸지 않고 현재의 방향 압력에 맞춰 거래하는 데 도움이 됩니다. 제로 라인을 위로 돌파하면 위쪽 화살표가 표시되고, 아래로 돌파하면 아래쪽 화살표가 표시됩니다. 정확한 교차 지점을 눈으로 판단하지 않아도 새로운 모멘텀

THIS EA HAD A WINRATE OF 80% !!!
How to use: The EA must be attached to ONLY one chart Symbol must be EURUSD . Timeframe should be M5. Minimum deposit 100 USD. Recommended leverage 1:50 - 1:500. The EA should run on a VPS continuously. Recommended Inputs:
Use Risk Percent: true Risk Percent: 1 Lot Size: 0.01 Target Points: 100 Magic Number: 123456789
Recommended broker: XM or any broker that has a lower spread. If you choose XM as your broker please select MT5 for trading platform type an

ROC는 현재 가격이 이전 기간에 비해 얼마나 빠르게 변했는지를 측정합니다. 따라서 가격이 새로운 스윙 고점이나 저점을 만들었지만 그 움직임을 뒷받침하는 모멘텀이 따라오지 않을 때 특히 유용합니다. KT ROC Divergence는 이런 불일치를 자동으로 찾아 가격 차트와 ROC 창에 서로 대응하는 선을 표시합니다. 고정된 범위 안에서 움직이는 오실레이터와 달리 ROC는 시장의 속도에 따라 값의 폭이 커지거나 작아집니다. 서로 다른 종목의 절대 수치를 비교할 필요는 없습니다. 중요한 정보는 가격 스윙과 오실레이터 스윙 사이의 관계입니다. 트레이더의 언어로 보는 네 가지 패턴 일반 상승 다이버전스: 가격은 더 낮은 저점을 만들지만 ROC는 더 높은 저점을 만듭니다. 가격이 더 내려갔더라도 매도 모멘텀이 약해지고 있을 수 있습니다. 일반 하락 다이버전스: 가격은 더 높은 고점을 만들지만 ROC는 더 낮은 고점을 만듭니다. 가격이 여전히 오르는 동안 매수 모멘텀이 약해지고 있을 수 있습니
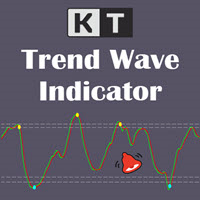
시장 흐름과 함께 Trend Wave 교차 확인 KT Trend Wave는 가격 움직임을 메인 웨이브와 부드러운 신호선으로 구성된 집중형 오실레이터로 보여 줍니다. 가격 차트 아래의 별도 창에 표시되므로 캔들을 가리지 않고 웨이브, 기준 영역 및 교차 마커를 선명하게 확인할 수 있습니다. 선, 영역 및 마커를 함께 해석 연두색 메인선: 더 빠르게 반응하는 추세 웨이브를 보여 줍니다. 빨간색 신호선: 웨이브를 부드럽게 만들어 방향 변화를 쉽게 비교할 수 있게 합니다. 하늘색 상승 마커: 하단 기준 영역에서 메인선이 신호선 위로 교차하는 강세 움직임을 표시합니다. 노란색 하락 마커: 상단 기준 영역에서 메인선이 신호선 아래로 교차하는 약세 움직임을 표시합니다. 차트를 복잡하게 만들지 않고 반응 조절 Wave Period는 메인 웨이브의 가격 반응을 조절하고 Avg. Period는 적용되는 평활화를 조절합니다. 이 두 설정으로 긴 기술 입력 목록 없이 반응성과 부드러움의 균형을 선택할 수

지표는 여러 쌍의 스프레드를 동시에 모니터링하는 스프레드 스크리너를 제공하며 캔들 타이머 카운트다운은 현재 막대가 닫히고 새로운 막대가 형성되기까지 남은 시간을 표시합니다.
기간 한정 제공: 당사의 모든 프리미엄 지표는 단 50$에 제공됩니다. MQL5 블로그에 액세스하면 프리미엄 지표에 대한 모든 세부 정보를 찾을 수 있습니다. 여기를 클릭하세요.
주요 특징들 동시에 확산되는 다중 쌍을 모니터링합니다. 현지 시간이 아닌 서버 시간을 추적합니다. 구성 가능한 텍스트 색상 및 글꼴 크기 CPU 사용량을 줄이기 위해 최적화 개인화 된 쌍 목록.
연락하다 질문이 있거나 도움이 필요하면 비공개 메시지를 통해 저에게 연락하십시오.
경고 경고 모든 지표와 도구는 공식 Metatrader Store( MQL5 Market )를 통해서만 사용할 수 있습니다.
작가 SAYADI ACHREF, 핀테크 소프트웨어 엔지니어이자 Finansya의 설립자
FREE
이중 라인 신호, 제로 레벨 시스템, 멀티 타임프레임 지원, 사용자 지정 시각적 신호 및 고도로 구성 가능한 알림 시스템을 갖춘 고급 상대 활력 지수(RVI) 지표.
프리랜서 프로그래밍 서비스, 업데이트 및 기타 TrueTL 제품은 제 MQL5 프로필 에서 이용 가능합니다.
피드백과 리뷰는 매우 감사히 받겠습니다!
상대 활력 지수(RVI)란? 상대 활력 지수(RVI)는 John Ehlers가 개발한 모멘텀 오실레이터로, 거래 범위로 정규화하여 시가 대비 종가의 상대적 관계를 비교함으로써 최근 가격 움직임의 확신도를 측정합니다. 기본 원리는 강세 시장에서는 종가가 시가보다 높아지는 경향이 있고, 약세 시장에서는 반대가 성립한다는 것입니다. RVI는 제로 라인 주위를 진동합니다 — 양수 값은 강세 모멘텀을, 음수 값은 약세 모멘텀을 나타냅니다. 지표는 두 개의 라인으로 구성됩니다: 메인 라인(RVI 값)과 시그널 라인(메인 라인의 4봉 대칭 가중 이동 평균). 두 라인 간의 교차는
FREE
지금 어느 외환 세션에서 거래하고 있는지, 그리고 각 세션이 몇 pips 움직였는지 MetaTrader 5 차트에서 바로 확인하세요. KT Forex Sessions MT5는 도쿄, 런던, 뉴욕 세션을 색깔 박스로 그리고, 각 세션의 크기를 pips로 해당 박스 위에 적어 주는 세션 지표입니다. 지표가 브로커의 GMT 오프셋을 스스로 읽고, 각 세션은 해당 도시의 현지 시간과 서머타임을 따릅니다. 박스는 일 년 내내 올바른 위치에 있으며, 설정할 것이 없습니다. 차트에서 보이는 것 모든 박스 위의 pips: 거래하는 모든 통화쌍에서 조용한 세션과 활발한 세션을 한눈에 구별할 수 있습니다. 시간대 환산이 필요 없음: 찾아볼 GMT 오프셋도 없고, 봄과 가을에 시계가 바뀔 때 바꿀 것도 없습니다. 겹치는 시간은 별도의 박스로: 런던과 뉴욕이 동시에 열려 있는 시간에는 별도의 보라색 박스가 있습니다. 열려 있는 세션은 실시간으로 커짐: 세션이 끝날 때까지 박스가 새로운 고점과 저점을 따라
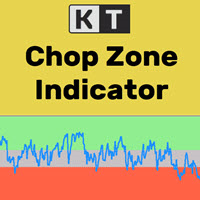
금융 시장은 약 30%의 시간 동안에만 뚜렷한 추세를 형성하고, 나머지 70%의 시간 동안은 횡보 구간에서 움직이는 것이 잘 알려진 사실입니다. 그러나 대부분의 초보 트레이더는 시장이 현재 추세 중인지, 아니면 박스권(횡보) 상태인지 판단하기 어렵습니다. KT Chop Zone은 이러한 문제를 해결해줍니다. 시장의 상태를 시각적으로 세 가지 구역으로 나누어 표시합니다: 하락 구간, 상승 구간, 그리고 Chop Zone (횡보 구간)입니다.
기능
횡보장에서의 거래를 피함으로써 즉시 거래 품질을 향상시킬 수 있습니다. 출구 신호로도 사용할 수 있습니다. 예를 들어, 매수 포지션이 Chop Zone에 진입하면 포지션을 정리할 수 있습니다. 전문가용 자동매매(EA)와 완벽하게 호환됩니다. EA에 쉽게 추가하여 전략을 개선할 수 있습니다. 모든 MetaTrader 알림 기능이 포함되어 있습니다.
입력 파라미터 메인 기간: 오실레이터에 사용하는 정수 값입니다. 권장 값은 10에서 30 사
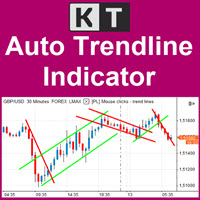
중요한 추세선을 차트에서 자동으로 업데이트 KT Auto Trendline은 최근 ZigZag 스윙 포인트를 바탕으로 상단과 하단 추세선을 자동으로 만들고 현재 차트의 미래 방향으로 두 선을 연장합니다. 같은 선을 반복해서 직접 그리지 않아도 형성 중인 돌파, 반응, 가격 방향 변화를 명확한 구조로 살펴볼 수 있습니다. 가까운 구조와 더 넓은 스윙을 함께 확인 첫 번째 추세선 세트는 기본으로 활성화되며 반응성이 높은 ZigZag 설정을 사용합니다. 더 넓은 시야가 필요하면 두 번째 세트를 켜서 별도의 민감도를 가진 상단 및 하단 추세선 한 쌍을 추가할 수 있습니다. 한 차트에서 가까운 가격 구조와 더 큰 시장 스윙을 비교하기 좋습니다. 각 추세선 세트의 반응 방식 조절 Show First Trendline: 기본 상단 및 하단 연장 추세선을 표시하거나 숨깁니다. Depth, Deviation, Back Step: 첫 번째 ZigZag 세트가 스윙 포인트를 찾는 방식을 조절합니다. S
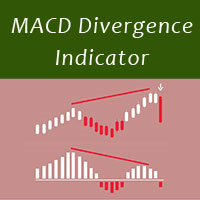
MACD divergence indicator finds divergences between price chart and MACD indicator and informs you with alerts (popup, mobile notification or email) . Its main use is to find trend reversals in the chart. Always use the divergence indicators with other technical assets like support resistance zones, candlestick patterns and price action to have a higher possibility to find trend reversals. Three confirmation type for MACD divergences: MACD line cross zero level Price returns to previous H/L Crea
FREE

An equity protection EA for MetaTrader that enforces your loss limits and profit target for you: when your account reaches a rule you set, it closes your trades on every symbol, before one bad day turns into a lost account. It suits prop firm challenges and personal accounts alike. Attach it to one chart, answer a few questions in the on-chart setup wizard, and it watches your whole account in the background while you trade by hand or with other EAs. What it protects Daily loss limit: a percenta

Stargogs Spike Catcher EA V3 !!!PLEASE MESSAGE ME AFTER PURCHASING THE EA I WILL HELP AND SET IT UP FOR YOU OR I'LL SEND YOU THE RIGHT SETFILES!!! !!! IMPORTANT THIS ROBOT WON'T WORK OR MAKE PROFIT WITH DEFAULT SETTINGS!!! With The Right Settings so that you can make your daily or monthly Income. This Is the best version so far. With the right Parameters you won't fail. I will also show you the results. In Version 3.0 you can Switch on/off to Choose on which indices to catch spikes on Boom and
Key Features: Multi-Target Volatility: Configure multiple Take Profit and Stop Loss levels based on real-time market volatility. Fully Customizable: Set specific volatility multipliers (e.g., 4x for Stop, 10x for Take) using any look-back period (e.g., previous 20 bars on a 2-minute chart). Clear Visuals: Assign unique names to each level to be displayed directly on your symbol's chart for easy monitoring. Consistency: Every level calculated is synchronized with the volatility of your chosen per
FREE

Volume profile indicator that tells you which levels price is likely to reach today. Daily profiles with POC, VAH and VAL, naked POCs and a drag box for any range, and every level labelled with how often price reached a level at that distance on your own chart. What you see on the chart A profile for every day on M1 to H1 charts, with the value area in a stronger colour. Yesterday's POC, VAH and VAL across today, each with its odds for today, or "reached" once price gets there. Naked POCs: earli

The market eagle - it is a Secure Automated Software for trade Forex market and indices.This EA takes perspective of the market looking like an eagle. From a distance, observe the entire market amphitheater detecting the entry points and the best points to implement the algorithm based on the set that we indicate in the input.This system allows us to use the key points of the market to adapt them to our algorithms, trend and countertrend. The system uses multiple lot depending on the algorithm
MACD Divergence Scanner is a multi-timeframe and multi-symbol dashboard and alert that checks all timeframes and symbols to find regular and hidden divergences between price chart and MACD indicator. This divergence scanner is integrated with support and resistance zones so you can check the MACD divergences in the most important areas of the chart to find trend reversals in the price chart. Download demo version (works on M4,M6,M12,M20,H3,H8 timeframes of 20 symbols of Market Watch window)

OBOS indicator
OBOS Indicator is an exclusive indicator to spot entries based on price action.
The OBOS Indicator is both effective and user friendly.
Indicator uses simple color codes and levels to indicate Overbought and Oversold conditions. No more headache.
The OBOS Indicator will only gives you indication when there are possible entries. Means you only get useful information.
Inputs of the indicator are:
MaxBars : number of bars to display in your chart Smoothing period : number of b
Tick Chart Monitor with countdown tick volume and easy to change tick size without going back to main chart. This work with Tick Chart Generator , which are available for download from the MQL5 Market: Tick chart generator: https://www.mql5.com/en/market/product/79763 NOTE: Custom symbols on MT5 are not directly tradable. This is by Metatrader5 design. If you want to place trades directly on the custom symbol generated by this product, you will either need a trade panel that offers this functi
FREE
EA create custom Tick bar charts and provide real-time updates for MT5. This is an MT4 "offline" chart equivalent which is very simple to use. Generated Tick bar Chart compatible to MT5 indicator or template and perform your technical analysis with Multi timeframe analysis. The generator uses tick data to plot the historical tick chart for a particular setting and live ticks for plotting live charts. This method of calculation gives very accurate charts as no approximation is used. This EA creat
Tick imbalance bars (TIB), described in the book Advances in Financial Machine Learning (2018) by Marcos López de Prado. Indicator that show candlestick bars with an different sampling method than time fixed. Real time data is sourced to the indicator and it may be used as substitute of the default graph. Each bar is formed when a predefined tick balance is exceeded, showing in the graph the OHLC of this cluster of ticks. The input variable is the amount of ticks of each bar. The indicator may
FREE

Assistant_for_Reopen - an Expert Advisor that helps to re-set pending orders. Many brokers force the order to expire at the end of the trading session or at the end of the trading day. Therefore, a trader has to restore all pending orders manually every time at the beginning of a new trading session. Assistant_for_Reopen frees the trader from this routine work. It controls expiration by the order expiration time and resets it if the trader ticked the checkbox. The maximum number of orders the EA
FREE
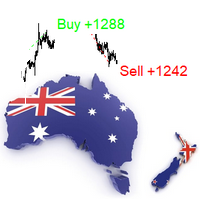
The indicator is a trading system for AUDUSD or NZDUSD currency pairs.
The indicator was developed for time periods: M15, M30.
At the same time, it is possible to use it on other tools and time periods after testing.
"Kangaroo Forex" helps to determine the direction of the transaction, shows entry points and has an alert system.
When the price moves in the direction of the transaction, the maximum length of the movement in points is displayed.
The indicator does not redraw, all actions occ
Trend Direction ADX indicator Trend Direction ADX is part of a serie of indicators used to characterize market conditions.
Almost any strategy only work under certain market conditions.
Therefore it is important to be able to characterize market conditions at any time: trend direction, trend strength, volatility, etc..
Trend Direction ADX is an indicator to be used to characterize trend direction:
trending up trending down ranging Trend Direction ADX is based on ADX standard indicator.
Tre

Trend Strength MA indicator Trend Strength MA is a part of a series of indicators used to characterize market conditions.
Almost any strategy only works under certain market conditions.
Therefore, it is important to be able to characterize market conditions at any time: trend direction, trend strength, volatility, etc.
Trend Strength MA is an indicator to be used to characterize trend strength:
Up extremely strong Up very strong Up strong No trend Down strong Down very strong Down extremely

Trend Direction Up Down Indicator Trend Direction Up Down is part of a series of indicators used to characterize market conditions.
Almost any strategy only works under certain market conditions.
Therefore it is important to be able to characterize market conditions at any time: trend direction, trend strength, volatility.
Trend Direction Up Down is an indicator to be used to characterize trend direction (medium term trend):
trending up trending down ranging Trend Direction Up Down is based

show live chart spot All symbol binance If you want to get this product with a 99% discount, send a message to my Telegram admin and rent this product for 1 $ per month or 10 $ per year. Even if you do not like the way the chart is displayed, you can tell the admin in Telegram how to display it so that your own expert is ready. https://t.me/Bella_ciao1997 https://t.me/Binance_to_mql5

Only 5 copies of the EA at $30! Next price --> $45 This robot works on the basis of bowling band and has stepped entrances at safe points.
benefits:
Works on all instruments and time series,
It has excellent inputs for position management that can avoid a lot of risk.
Input settings:
Volume: Selects a fixed volume for the trade that uses its own risk management if it is zero.
Risk for all positions: The amount of risk for all positions in one direction, for exam

BEHOLDD!!!!!!!
Investogenie is now in the Market. The Profound Algorithm designed in investogenie helps in scalping in the quiet time at night with a Stop Loss. The Markets conditions help the EA to decide taking the entries and exits at the proper time. Backtests and results are evident of the strength of the product.
Live results will be updated soon.
RECOMMENDATION
PAIRS: All Currency pairs
TIMEFRAME: This is Designed on M5 only
Use the set file in comment 3 or DM me
LIVE MONITORING

KT Risk Reward shows the risk-reward ratio by comparing the distance between the stop-loss/take-profit level to the entry-level. The risk-reward ratio, also known as the R/R ratio, is a measure that compares the potential trade profit with loss and depicts as a ratio. It assesses the reward (take-profit) of a trade by comparing the risk (stop loss) involved in it. The relationship between the risk-reward values yields another value that determines if it is worth taking a trade or not.
Features
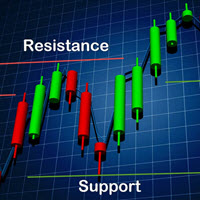
Be sure to consult with me before buying.
The robot trades based on support and resistance levels. You can use weekly and monthly times for less risk. More risk in daily and 4-hour times. Be sure to disable the robot at news times.Works on all currency pairs, indices, commodities and metals. Only observing the trade at the time of news will make this robot profitable. Automatic news management will be added in future versions.
benefits:
Works on all instruments and time series,
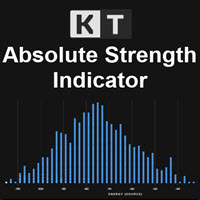
KT Absolute Strength measures and plots the absolute strength of the instrument's price action in a histogram form. It combines the moving average and histogram for a meaningful illustration. It supports two modes for the histogram calculation, i.e., it can be calculated using RSI and Stochastic both. However, for more dynamic analysis, RSI mode is always preferred.
Buy Entry
When the Absolute Strength histogram turns green and also it's higher than the previous red column.
Sell Entry
When th
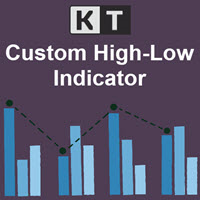
KT Custom High Low shows the most recent highs/lows by fetching the data points from multi-timeframes and then projecting them on a single chart. If two or more highs/lows are found at the same price, they are merged into a single level to declutter the charts.
Features
It is built with a sorting algorithm that declutters the charts by merging the duplicate values into a single value. Get Highs/Lows from multiple timeframes on a single chart without any fuss. Provide alerts when the current pri
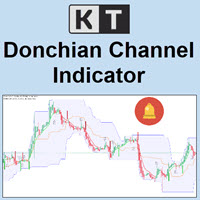
KT Donchian Channel is an advanced version of the famous Donchian channel first developed by Richard Donchian. It consists of three bands based on the moving average of last high and low prices. Upper Band: Highest price over last n period. Lower Band: Lowest price over last n period. Middle Band: The average of upper and lower band (Upper Band + Lower Band) / 2. Where n is 20 or a custom period value is chosen by the trader.
Features
A straightforward implementation of the Donchian channel ble
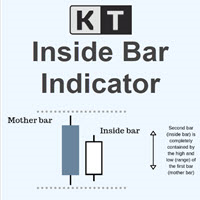
KT Inside Bar plots the famous inside bar pattern in which the bar carries a lower high and higher low compared to the previous bar. The last bar is also known as the mother bar. On smaller time-frames, the inside bar sometimes appears similar to a triangle pattern.
Features
Also plots entry, stop-loss, and take-profit levels with the inside bar pattern. No complex inputs and settings. Erase unwanted levels when the price reaches the entry line in either direction. All Metatrader alerts include
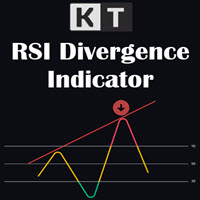
KT RSI Divergence shows the regular and hidden divergences built between the price and Relative Strength Index (RSI) oscillator. Divergence can depict the upcoming price reversal, but manually spotting the divergence between price and oscillator is not an easy task.
Features
Ability to choose the alerts only for the divergences that occur within an overbought/oversold level. Unsymmetrical divergences are discarded for better accuracy and lesser clutter. Support trading strategies for trend reve

• Please test the product in the Strategy Tester before purchasing to understand how it works.
• If you face any issues, contact me via private message—I’m always available to help.
• After purchase, send me a screenshot of your order to receive a FREE EA as a gift.
Minimum deposit is 1000$ , or 1000 Cent = 10$. (Recommended 1500$) Every 1000$ = 0.01 Lot. Please stick to the rules, as we want you to win, win and win! (Trading is risky, and there are no guarantees for winning)

Best indicator for MT5 providing accurate and sniper signals to enter a trade without repainting!
It can be applied to any financial assets: forex, synthetic, cryptocurrencies, metals, stocks, indices . It will provide pretty accurate trading signals and tell you when it's best to open a trade and close it. Most traders improve their trading results during the first trading week with the help of the Power Indicator Pro.
Benefits of the Power Indicator Pro
Entry signals without repaint

• Please test the product in the Strategy Tester before purchasing to understand how it works.
• If you face any issues, contact me via private message—I’m always available to help.
• After purchase, send me a screenshot of your order to receive a FREE EA as a gift.
Minimum deposit is 1000$ , or 1000 Cent = 10$. (Recommended 1500$) Every 1000$ = 0.01 Lot. Please stick to the rules, as we want you to win, win and win! (Trading is risky, and there are no guarantees for winning)

KT Average Daily Range(ADR) shows the upper and lower levels using the average daily range covered by the currency pair or the instrument. The average daily range is calculated using the chosen period in the input settings. ADR High: ADR upper level is found by adding the average daily range value to the current day's low.
ADR Low: ADR lower level is found by subtracting the ADR value from the current day's high.
Features
It shows the ADR levels with several other helpful information benefici

• Please test the product in the Strategy Tester before purchasing to understand how it works.
• If you face any issues, contact me via private message—I’m always available to help.
• After purchase, send me a screenshot of your order to receive a FREE EA as a gift.
Time frame: M1
Leverage : Higher the better
Spread: Lower the better
Account type : All types
(EA may enter hedge positions, if you want to

KT Fisher Transform is an advanced version of the original Fisher Transform oscillator equipped with divergence detection, crossover alerts, and many more features. Originally it was developed by John F. Ehlers. It converts the asset's price into a Gaussian normal distribution to find the local extremes in a price wave.
Features
A light-weighted oscillator that efficiently identifies the upward and downward crossovers and marks them using vertical lines. It also finds regular and hidden diverg

PriceRunner MT5 The PriceRunner indicator is based on pure relative power. It gives promising results even in M1 timeframes in currency pairs and M2 in commodities and cryptos. The indicator is designed with user-friendly and simple settings. It is very suitable even for beginners who are interested in indicators and strategies. I am ready to make improvements on the indicator in line with the needs of those who buy or rent. However, even in its current state, you can see very promising results

• Please test the product in the Strategy Tester before purchasing to understand how it works.
• If you face any issues, contact me via private message—I’m always available to help.
• After purchase, send me a screenshot of your order to receive a FREE EA as a gift.
Time frame: M1
Leverage : Higher the better
Spread: Lower the better
Account type : All types
(EA may enter hedge positions, if you want to
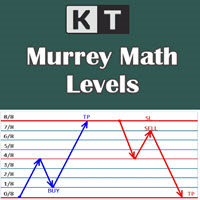
It shows the Murrey Math levels on chart and also provides an alert when price touch a particular level. T. Henning Murrey, in 1995, presented a trading system called Murrey Math Trading System, which is based on the observations made by W.D Gann.
Applications
For Murrey Math lovers, this is a must-have indicator in their arsenal. There is no need to be present on the screen all the time. Whenever the price touches a level, it will send an alert. Spot upcoming reversals in advance by speculatin

Only 1 copies left at a price of $99. Next price $199!
actual .set files (click me)
interactive panel manual (click me) Version for MT4: Smart Start MT4 Smart Start
is a smart trading system, the indicators of which allow it to be used both for trading with small deposits (fast acceleration) and for conservative trading. is a modernized trading indicator system that uses the MACD indicator to analyze the market. To analyze entry points, smart start takes into account the historical in

Some disadvantages of Rollover Scalper: Currently the markets aren't that favorable for night scalping because of the fundamentals, so the next few months the EA might show 0% or even negative return. However, it happened in the past too and it was still profitable over all ~20 years. It's a scalper, so you'll need a broker with low spread and good execution time, preferably an ECN broker. ICMarkets would be a good choice. It's susceptible to slippage (which can't be backtested or limited on ECN

主要城市的时间。北京时间、东京时间、悉尼时间、惠灵顿时间、纽约时间、法兰克福时间、伦敦时间、迪拜时间。 城市时间可选择开启或者关闭。 点差变色提醒。设置点差提醒点数,例如,设置100点,点差大于100点,文字会变红色。 Time in major cities. Beijing time, Tokyo time, Sydney time, Wellington time, New York time, Frankfurt time, London time, Dubai time. City time can be turned on or off. Dot difference color change reminder. Set the point difference reminder points. For example, set 100 points. If the point difference is greater than 100 points, the text will turn red.
FREE

EA PRO is a 100% adaptive expert advisor based on price action, indicators and chart patterns. It has a built-in unique Smart Recovery algorithm which insures that your win rate is higher and that you recover your losses. Number of trades and lot size is decided by EA so that you get the most rewards from each trade. Every trade can be set with Stop loss and Take profit, the EA has an active trailing stop which is automatically activated once your trade is in profit. The EA can scalp the spikes

Парный трейдинг по-прежнему остается самым безопасным видом трейдинга. В советнике используется интересный информационный индикатор, который показывает силу тренда на конкретной паре в процентах. Также применяются другие индикаторы. Пример на скриншоте. На EURUSD сила бычьего тренда 78%. На USDCHF сила бычьего тренда 70%. Советник открывает позиции на обоих инструментах на sell одинаковым лотом. Закрывает когда числовые значения силы тренда обоих инструментов немного подравнялись, чтобы был пол
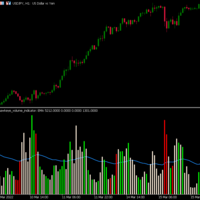
Hawkeye Volume Indicator contains a complex algorithm which executes over 300 calculations per bar in order to analyze the price action and associated volume, giving traders a tremendous advantage. Now Available in MT5 for U nlimited Use !
Volume is the only leading indicator which: .signals a price movement prior to it happening
.provides the fuel that drives the market Hawkeye Volume works in all markets and can be used in all timeframes for both tick and time charts – from longer term swing a
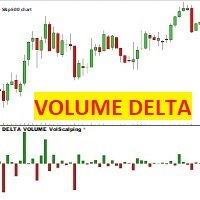
볼륨 델타 볼스캘핑 이 표시기는 각 가격 캔들에 대해 구매 및 판매 계약의 차이인 델타 캔들을 그립니다. 양초는 입찰(매도)에서 거래된 계약이 매도 가격을 초과하면 빨간색이고 음수가 되고 반대로 ASK(매수)에서 거래된 계약이 입찰가를 초과하면 양초가 녹색이고 양수입니다.
주의: 이 지표는 실제 시장 데이터 흐름을 제공하고 체결된 계약을 BID와 ASK로 나누는 브로커에서만 작동합니다. Forex, CFD 및 Cryptocurrencies는 합성 시장에 속하며 실제 시장 데이터 흐름이 없으므로 표시기가 작동하지 않습니다. 데모 계정으로도 보증금 없이 실제 시장 데이터 흐름을 제공하는 브로커가 AMP FUTURE 브로커입니다. 지수, 상품, 실제 시장에서 거래되는 상품에 대한 작업(예: CME, EUREX, ICE ...)

LT Easy Trend - 단 하나의 지표로 경험하는 기술적 중첩(Confluence)의 위력 한 지표는 매수를 가리키고 다른 지표는 매도를 가리켜 혼란스러웠던 적이 있으신가요? LT Easy Trend는 이러한 결정 장애를 해결하기 위해 개발되었습니다. 세계에서 가장 신뢰받는 9가지 기술적 지표들의 수학적 합의를 바탕으로 승률이 높은 신호만을 엄선하여 제공합니다. 수십 개의 창으로 차트를 어지럽히는 대신, Easy Trend는 모든 데이터를 실시간으로 처리하여 9가지 필터가 동시에 추세를 확정할 때만 명확한 시각적 신호를 표시합니다. 9가지 추세 필터의 강력함: 진입 신호는 다음 지표들 간의 의견이 100% 일치할 때만 생성됩니다: Moving Average (MA): 가격 방향성 필터. Relative Strength Index (RSI): 추세의 강도 및 모멘텀 식별. Commodity Channel Index (CCI): 새로운 추세 사이클 포착. Parabolic SAR:
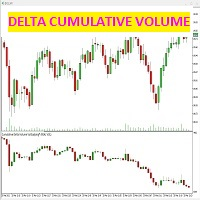
이 지표는 단일 캔들에 대해 매도 및 매도(공격) 체결된 계약 간의 차이를 감지합니다.
지표는 가격 차트 아래의 전용 창에 판매 및 구매 계약의 차이에 의해 정확하게 주어진 양초를 표시하며, 이는 시장의 체적 강도를 생성합니다.
누적 촛대 델타 차트만 선택하는 방법 또는 양초 자체의 추세선을 선택하는 방법이 가능합니다(스크린샷 참조): 두 번째 상자 u "없음"을 선택하면 추세선이 그려지지 않고 색상을 선택하면, 체적 양초의 추세선이 차트에 함께 나타납니다.
이 표시기는 무엇을 위한 것입니까? 가격 차트를 체적 델타 차트와 비교하면 시장의 진정한 강점을 볼 수 있습니다. 두 차트의 수렴은 가격의 올바른 상승/하강을 결정하는 반면 가격과 체적 델타 간의 발산은 신호 경고여야 합니다 가격이 반전되어야 하기 때문입니다. 이 지표는 잘못된 신호를 필터링하고 가격과 거래량 사이의 분기 단계에서 발생하는 신호를 제거하기 위해 거래 전략과 함께 사용해야 합니다.
주의: 이 표시기는 실제
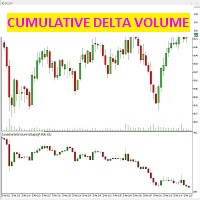
이 지표는 단일 캔들에 대해 매도 및 매도(공격) 체결된 계약 간의 차이를 감지합니다.
지표는 가격 차트 아래의 전용 창에 판매 및 구매 계약의 차이에 의해 정확하게 주어진 양초를 표시하며, 이는 시장의 체적 강도를 생성합니다.
누적 촛대 델타 차트만 선택하는 방법 또는 양초 자체의 추세선을 선택하는 방법이 가능합니다(스크린샷 참조): 두 번째 상자 u "없음"을 선택하면 추세선이 그려지지 않고 색상을 선택하면, 체적 양초의 추세선이 차트에 함께 나타납니다.
이 표시기는 무엇을 위한 것입니까? 가격 차트를 체적 델타 차트와 비교하면 시장의 진정한 강점을 볼 수 있습니다. 두 차트의 수렴은 가격의 올바른 상승/하강을 결정하는 반면 가격과 체적 델타 간의 발산은 신호 경고여야 합니다 가격이 반전되어야 하기 때문입니다. 이 지표는 잘못된 신호를 필터링하고 가격과 거래량 사이의 분기 단계에서 발생하는 신호를 제거하기 위해 거래 전략과 함께 사용해야 합니다.
주의: 이 표시기는 실제

차트에서 추세 방향을 직접 확인 KT Trend Magic은 모멘텀과 변동성을 결합하여 가격을 따라가는 색상 라인을 표시합니다. 라인은 현재 추세 상태를 계속 보여 주며 계산된 방향이 바뀌면 색상도 변경됩니다. 녹색 라인: 강세 추세 상태를 나타냅니다. 빨간색 라인: 약세 추세 상태를 나타냅니다. 색상 변화: 차트에서 새로운 방향 전환을 표시합니다. 지속적인 움직임에서는 라인을 되돌림과 추세 지속을 살펴보는 동적 차트 기준으로도 활용할 수 있습니다. 각 전환을 현재 가격 움직임과 자신의 진입 규칙에 맞춰 비교할 수 있습니다. 9개 시간대의 신호 비교 다중 시간대 스캐너는 M1, M5, M15, M30, H1, H4, D1, W1, MN1의 Trend Magic 상태를 Bullish 또는 Bearish로 표시합니다. 각 시간대마다 별도의 차트를 열지 않고 현재 차트를 더 짧고 긴 시간대와 비교할 수 있습니다. 여러 시간대가 같은 방향을 가리키는지 또는 현재 차트가 더 넓은 추세 배경과

Traders Toolbox Overwatch - 실행 중인 모든 Traders Toolbox 에 대한 모니터링 유틸리티입니다.
모든 Traders Toolbox Running 차트에 대한 간단한 차트 전환 유틸리티이자 시장 감시입니다.
특징:
1. 사용자 정의 가능한 버튼 색상, 행 및 열.
2. 세 가지 신호 유형(보유 - 황색 / 매도 - 적색 / 매수 - 녹색)
3. Traders Toolbox 의 새 인스턴스 또는 종료된 인스턴스에 따라 버튼 목록을 동적으로 업데이트합니다.
4. 단일 클릭 버튼은 관련 차트를 전경으로 가져옵니다.
5. 매수 및 매도 신호는 Traders Toolbox 차트 신호와 일치하는 백분율로 신호 강도를 표시합니다.
참고: 유틸리티는 Traders Toolbox / Traders Toolbox Lite 와 함께만 사용할 수 있으며 독립적으로 작동할 수 없습니다.
Traders Toolbox 와의 거래에
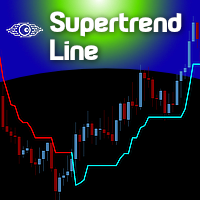
The Supertrend indicator was originally created by a french fellow named Olivier Seban , and its goal is to identify the Primary Trend of prices . Its calculation is easy and based on the average of Highs and Lows and then we add the volatility of a custom period, plus a multiplier. This way we get the Supertrend Line. You can find in the web several approaches and trading strategies using this very useful indicator.
HOW TO "READ" THIS INDICATOR
If the closing prices are above Supertrend Line,
FREE
MetaTrader 마켓 - 트레이더를 위한 로봇 및 기술 지표는 거래 터미널에서 바로 사용할 수 있습니다.
The MQL5.community 결제 시스템은 MQL5.com 사이트의 모든 등록된 사용자가 MetaTrader 서비스에서 트랜잭션을 수행할 수 있습니다. 여러분께서는 WebMoney, 페이팔, 또는 은행 카드를 통해 자금을 예치하거나 인출하실 수 있습니다.
