YouTube'dan Mağaza ile ilgili eğitici videoları izleyin
Bir ticaret robotu veya gösterge nasıl satın alınır?
Uzman Danışmanınızı
sanal sunucuda çalıştırın
sanal sunucuda çalıştırın
Satın almadan önce göstergeyi/ticaret robotunu test edin
Mağazada kazanç sağlamak ister misiniz?
Satış için bir ürün nasıl sunulur?
MetaTrader 4 için ücretli teknik göstergeler - 54

Contact us for any custom order, CodeYourTrade.com .
Keltner Channels are volatility-based envelopes. Moving average dictates direction and the ATR sets the channel width. It’s a trend following indicator used to identify reversals. Channels can also be used to identify overbought and oversold levels when the trend is flat. Trading Strategy We have created 2 zones SELL ZONE and BUY ZONE using the Keltner channels. In SELL ZONE (upper) we take only sell orders and in BUY ZONE (lower) we take

Contact us for any custom order, CodeYourTrade.com .
Multiple Moving Average (MA) indicator is used to find the direction of the trend using multiple Moving Average indicators. It calculates using the following rules: · Ask < MA, it is SELL · Bid > MA, it is BUY · Ask > MA > Bid, it is None (no signal) After you attached the indicator to a chart it will show the following information on the chart: Multiple MAs arranged by their method Buy and Sell count Summary: Co

Contact us for any custom order, CodeYourTrade.com .
This indicator is used to calculate the pivot points using 5 different methods: Classic Fibonacci Camarilla Woodie DeMark After you attached the indicator to a chart it will show the following information on the chart: Pivot points levels of the current chart using different methods. Indicator Setting Pivot Point Calculator Show Pivot Point Calculator: Show all pivot points on chart Pivot Points Timeframe: It tells which time is used to ca

Contact us for any custom order, CodeYourTrade.com .
The Stochastic RSI indicator is essentially an indicator of an indicator. It is used in technical analysis to provide a stochastic calculation to the RSI indicator. This means that it is a measure of RSI relative to its own high/low range over a user-defined period of time. This indicator is primarily used for identifying overbought and oversold conditions. You can hide all the information displayed in the chart by setting false to Sho

Spread & Swap Indicator is used to check the spread and swap for the current pair. You can hide all the information displayed in the chart by setting false to Show On Chart . Indicator Settings: Main Setting Display Spread : Shows the spread of the current pair. Display Swap (per lot) : Show the swap charges per lot for the current pair. Display Setting Display : Shows the indicator information on chart Location : Location of the display window Top-Left : Display all the details in top-left p

With the Technical Analysis indicator, you can find the trading signals using the combination of different technical indicators. It supports the following technical indicators: 1. RSI 2. Stochastic 3. Stochastic RSI 4. MACD 5. ADX 6. CCI 7. ATR 8. Ultimate Oscillator 9. ROC 10. Bull/Bear Power After you attached the indicator to a chart it will show the following information on the chart: 1. Technical indicators, their values and the signal generated fro

Contact us for any custom order, CodeYourTrade.com .
With the Technical Indicator Multi-Timeframe, you can easily identify the oversold/overbought levels or buy/sell levels points on several different timeframes by using only one chart. You can confirm Short Term trades by higher timeframe Levels. It supports 4 technical indicators as of now Stochastic, RSI, Parabolic SAR & Heiken Ashi. After you attached the indicator to a chart it will show the following information on the chart: Timeframe

Contact us for any custom order, CodeYourTrade.com .
Trade Notifier indicator is used to notify opening or closing of the trades via email or alert. It can also send regular trade updates via email. After you attached the Indicator to a chart, it will show the following information on the chart: 1. Alert information 2. Email information 3. Details to include in email body You can hide all the information displayed in the chart by setting false to Display . Indicator Settings A

Contact us for any custom order, CodeYourTrade.com .
Trend Direction indicator finds the direction of the trend using 2 indicators ADX and Parabolic SAR. Change the color of the Sell and Buy strength from the Colors tab in indicator settings. After you attached the indicator to a chart it will show the following information on the chart: 1. Parabolic SAR: Input values of Parabolic SAR Indicator 2. ADX: Input values of ADX Indicator 3. Trend Strength: Direction of the trend

Pulse Scalping Line - an indicator for identifying potential pivot points. Based on this indicator, you can build an effective Martingale system. According to our statistics, the indicator gives a maximum of 4 erroneous pivot points in a series. On average, these are 2 pivot points. That is, the indicator shows a reversal, it is erroneous. This means that the second signal of the indicator will be highly accurate. Based on this information, you can build a trading system based on the Martingale
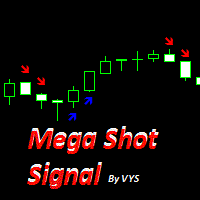
This tool is designed for binary options. The accuracy of this tool is more to 75%. Opening transactions is worth 1 candle. To increase profitability, you can use 4-knee martingale management. it is worth opening a buy deal when a signal appears in the form of a blue arrow it is worth opening a buy deal when a red arrow appears It is recommended to trade on timeframes from m1 to m15 highest accuracy on time frames m1 and m5
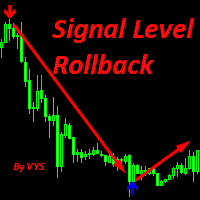
Signal Level Rollback the tool is designed to determine the lows and highs to determine the pivot of the market recommended for use with resistance support levels buy signal blue arrow sell signal red arrow It is recommended to use on a timeframe from M15 and higher since there are large movements and less market noise Stoploss is set for the nearest minimum or maximum or at a distance of 10-30 points.....
Unique trend trading algorithm with advanced filtering and many features which should become a part of your trading arsenal. This indicator can give you also trading advisors (with take profit target), success rate scanner and much more. TrendMagiX PRO comes with built-in multi-pair and multi-timeframe scanner which is fully adjustable. User can select own symbols and time-frames to monitor. + ALL the features of standard TrendMagiX indicator
Important information For additional detailed infor
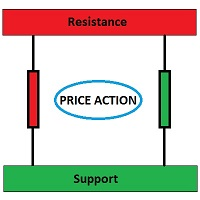
This is a price action support resistance level indicator for MT4, simply working in all time frames and all chart types. It creates Major support/resistance in specified time frame. You can also add a support/resistance level manually. For doing this, first add a horizontal line to the chart and rename it to 'Line'.
Input variables: timeFrame: You can select one of these values (M1, M5, M15, M30, H1, H4, D1, W1 and MN) or leave it empty to use Current Timeframe. majorLineColor: To specify c
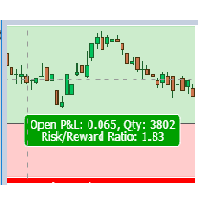
Risk Reward Panel This is a useful tool to plan a trade risk to reward visually. The indicator is very simple to use with minimum settings. Long or Short You can use the indicator for both long and short positions.
Lot Size Calculator You can also use this indicator as a lot size calculator. If you set the risk amount the indicator will calculate the lot size for you based on the stop loss line. You do not need to calculate the lot size manually.
ECHO INDICATOR V2.2 Update
A top-quality indicator works with trend and pattern. The tool is a good assistant for the traders use various levels in trading.
When price approaches a level, the indicator produces a sound alert and (or) notifies in a pop-up message, or via push notifications. A great decision making tool for opening orders. Can be used any timeframe and can be customized
Easy to trade It implements alerts of all kinds It implements a multi-timeframe
Trade with Trend + s

This is a price channel that shows five important price levels on the chart. Those levels are: 1. The Highest High (HH) of the previous x bars.
2. The Highest Low (HL) of the previous x bars.
3. The Center Line.
4. The Lowest High (LH) of the previous x bars.
5. The Lowest Low (LL) of the previous x bars. How does Bermaui Channels Captures Overbought area
Think of the distance between HH and HL levels as an overbought area.
When the price candles or bars crosses the HL to the upside this

Fibonacci indicator based on fractal.This software can automatically draw the golden section proportional line of two trend lines, and mark all the recent high and low prices.And the percentage value of volatility is a multi-cycle, multi-currency oscillation indicator.It is very effective for traders to find support and resistance lines and find entry and exit points near them.

Keris Keramat is an indicator that gives you signals when to buy or sell. It is a non repainting indicator. It can be used on almost all instruments. The time frame to use is M15. For desktop MT4 only. It’s good for Intraday or Swing Traders. Very easy to use even for a rookie trader. No need to change any parameter setting. Just plug & play. The indicator will only paint arrows, whether upward pointing arrow (for buy) or downward pointing arrow (for sell). All arrows that painted on the ch
Multi-Time-Frame-Multi Currency Signals Dashboard Indicator It is an Advanced multi-utility dashboard which works with full customization of signal settings and graphical interface. It works with Multi Symbols and Multi-Time frames from 1 SINGLE CHART TEMPLATE. It will automatically open the charts where the latest signals had formed- showing the important levels (Entry, Targets, Stop Loss) Many types of sorting methods for the scanner. A robust ENTRY based on TREND OF MULTI-TIME FRAMES ( Co
Fractal Reverse MTF - Indicator for determining the fractal signal to change the direction of the trend for МetaТrader 4.
The signal is determined according to the rules described in the third book of B. Williams:
- In order to become a signal to BUY, the fractal must WORK ABOVE the red line
- In order to become a signal for SALE, the fractal must WORK BELOW the red line
- Signals are not redrawn/ not repainting
The main idea of the indicator:
- Determine the change in the dire

Trend Line Chart Pattern Signals Is a traders Tool for Signals based on Strong Patterns Formed By a pair of robust trend lines. They FOR WITH DIFFERENT POPULAR PATTERNS ON CHARTS LIKE – TRIANGLES, FLAGS,RANGE , ASCENDING TRIANGLES, DESCENDING PATTERNS, PENNANTS ETC. The TREND LINES form dynamically on running bars. The sensitivity of the trend lines can be changed by custom settings. The Buy and Sell Signals Generate upon Break Of the Trend Line + "Close" of the same bar above the previo

SCALP ARROW EXIT SIGNALS
PLEASE REFER THE COMMENTS AREA - HOW THE SIGNALS CAN BE MADE BETTER QUALITY USING RENKO CHARTS IF YOU REQUIRE THE RENKO CHARTS DO LET ME KNOW , WILL HELP
Indicator is a professional tool for guiding reliable entries, exits, reentries, and RETRACEMENT entries and pull back entries. It is a complete blackbox system and can be used to get signals for any instrument and any time frame. The indicator generates signals, alerts - ENTRY -EXIT . Its can be used to scalp -

Skalpex is a system indicator for wave diagnostic analysis of the early phases of a market condition. The indicator lags exactly 1 bar. It shows the exact price reversals, does not redraw its values, but is 1 bar late. This is due to the fact that the last (zero bar) has not yet been formed before closing, which means that no one ever knows where it will go exactly and where it will close. We can assume. In order not to try to play fortune-telling, the Skalpex indicator is late by one candle an

Divine indicator is based on the random forest machine learning algorithm. This is my first standalone product. In this indicator, all calculations of price patterns and the formation of indicator trading signals is performed through 43x Trees. I chose this amount to keep the indicator deep in training and reduce the size of the indicator. DIVINE indicator - universal indicator, can work with the following: EURUSD, USDCHF, GBPUSD, USDJPY . In the future I will conduct experiments to fin

O V E R B O U G H T - O V E R S O L D W A T C H E R A highly powerful Market Price Exhaustion Detector. It gives current situation of market technical sentiment.
This is one of the best tools if you are counter-trend scalping.
V E R Y I M P O R T A N T The tool is not a trend indicator. It is an exhausted-trend indicator that may give possible bounce-back signal of the price. You can use this tool together with your own counter-trend strategy as a conf
Based on the course records of Yuri Antonov (academyfx.ru)
YouTube Channel: https://www.youtube.com/playlist? list=PLj3wALUOwoZ9kdacS09K9bjD1zulR _ HJh
The indicator is intended for people who know the strategy but find it difficult to mark the graph. Approaches the new Intensive MD system.
The default parameters are set as of mid-2019. For a 5-digit EURUSD account!
You can work on the 4-character after the parameters are recalculated.
The current parameters can be found on the autho
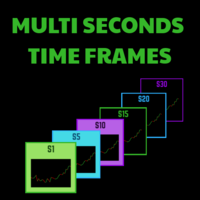
Seconds timeframe generator for MT4 (S1, S5, S10, S15, S20, S30).
Features
1. Indicator generates timeframes in real time, with each new tick on the spot.
2. Indicator is also measuring point distance from extreme to extreme when hovered "This additionally shows us how strong movements are".
Advantages
1. Easy to spot best entry and exit points.
2. You can easily trade news releases where market is very volatile.
3. You can also easily trade very slow market conditions a
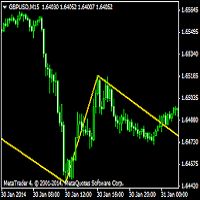
Zigzag x2 The Zig Zag indicator plots points on the chart whenever prices reverse by a percentage greater than a pre-chosen variable. Straight lines are then drawn, connecting these points. The indicator is used to help identify price trends. It eliminates random price fluctuations and attempts to show trend changes The indicator lowers the impact of random price fluctuations, highlighting underlying bull and bear power. more · Gartley Pattern Definition

Contact us for any custom order, CodeYourTrade.com .
Brent Wti spread indicator shows the difference of Brent and Wti value. Trading Strategy: Identify the range of spread movement. To buy the difference execute these 2 trades “Buy BRENT and Sell WTI” To sell the difference execute these 2 trades “Sell WTI and Buy BRENT” Indicator Settings: Main Setting Indicator Maximum : Maximum level to show in indicator Indicator Minimum : Minimum level to show in indicator Brent Symbol Name : Symbol n

Dualistic indicator with multi-functional panel. Using trading indicators is part of any technical trader’s strategy. Paired with the right tools, it could help you gain more insight into price trends. The Veil indicator combines price points of a financial instrument over a specified time frame and makes summary calculations. In a nutshell, it identifies market trends, showing current support and resistance levels, and also forecasting future levels. Is the system important?
"The AMOUNT of m
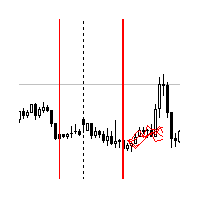
Indicator shows the price history. The history is read for vertical lines and output for the main line. Those lines are the time cursors. You can use the indicator to analyze the price cycle over time, thereby predicting its movement. The duration of the forecast and the number of time cursors can be set in the indicator parameters. Additionally, you can link the main line to a new bar. Lines can be moved manually.
Analyze the cyclical nature of the market using this indicator.
Indicator pa
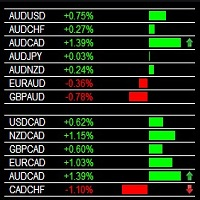
Multi Currency Strength Dashboard Scalper SCALP SIGNALS BASED ON THE ANALYSIS OF THE STRENGTH OF THE CROSS CURRENCY PAIRS- MAKES THE SIGNALS STRONG
Indicator Dashboard- calculates the strength of all markets , currency pairs , commodities . Using a proprietary logic. This data can be used to judge and take decisions whether to buy or sell them. If the particular market is strong means it is bullish , and also the related pair of that market is strong then it will be highly probable that t

The Chart Overlay indicator displays the price action of different products on the same chart, allowing you to evaluate how different symbols fluctuate relative to each other. You may use it to make trading decisions based on convergence / divergence of the displayed products, i.e. USDCAD - XTIUSD, EURUSD - USDCHF etc. Usage Find overbought or oversold products Adapts to chart size, zoom and timeframe Automatic price level calculation Customizable colors Click 'c' to open underline product in s

SPECIAL PRICE Great offers on all products. Great opportunities. Three overlapping Bollinger. This indicator is ready for use with three overlapping bollinger bands. Ideal for traders who love bollinger bands who in this way can see directly from a graph how the bollinger bands move in a higher Timeframe without having to change the graph and timeframe. This indicator identifies the real squeezes that start on three different timeframes. The signal thus becomes more valid and certain.
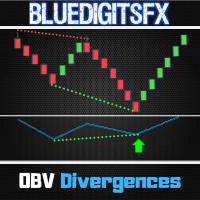
MT5 Version Available Here: https://www.mql5.com/en/market/product/50538
Telegram Channel & Group : https://t.me/bluedigitsfx
V.I.P Group Access: Send Payment Proof to our Inbox
Recommended Broker: https://eb4.app/BDFXOsprey
* Non-Repainting Indicator To Trade Divergences for any Newbie or Expert Trader ! BlueDigitsFx's OBV Divergence draws divergence lines on the chart and on the On Balance Volume (OBV) Indicator. Performs Amazingly at significant price areas such as support

This scanner is monitoring the entire market for trade opportunities for all symbols and for all time frames. You don't have to look to all the charts, for all symbols and for all time frames. This scanner will alert you on your computer, or on your mobile, when a trade opportunity has been found. You never have to miss a trade opportunity! This indicator is designed to scan all pairs and symbols, for all selected time frames, to find an Engulfing Candlestick Pattern.
Features
The scanner wi

Unable To Find The Main Trend?
Wish To Get In Drive With Main Trend? Then BEAK Candle Is The Perfect Choice For You
How To Use This Candle Pattern? Simple as you want! =>here you may follow the BLUE CANDLE to get in any trade =>Blue candle must come after previous candle BODY CLOSE =>If blue candle cover and close with previous candle body upper side then place BUY TRADE =>If blue candle cover a

Bir forex tüccarı olarak, teknik analizde Fibonacci ticaret stratejisinin değerini anlarsınız. Ancak, Fibonacci seviyelerini manuel olarak çizmek ve ayarlamak zaman alıcı olabilir. Dünün Nihai Fibonacci göstergesinin devreye girdiği yer burasıdır. Bir önceki günün fiyat hareketine dayalı Fibonacci stratejisini kullanan tacirler için özel olarak tasarlanmıştır ve size zaman ve emek kazandırır. Bu yenilikçi gösterge, Fibonacci seviyelerine dayalı olarak girişi, zararı durdur ve kârı al sev

Bu göstergenin fikri, alım ve satım sinyalleri oluşturmak için fiyat çizelgeleri ile karşılaştırılabilecek mum şeklinde RSI çizmektir. Gösterge benim buluşum değil. Birkaç yıl önce internette kurdum. Kodu güncelledim, uyarı işlevleri ekledim, Bermaui Utilities araç grubunu ekledim.
Gösterge, mum çubukları çizmek için kullanılan tüm fiyatların RSI'sını hesaplar (açık, yüksek, düşük ve kapalı RSI). RSI mumlarını yüksek fitili çekmek için en yükseklerini ve RSI mumlarını düşük fitili çekmek için

Do you want to trade quickly, easily and get daily profit? Then our new indicator was created just for you! TURN is an author multi currency strategy that simultaneously determines the end of a trend, entry points and estimated profit levels for each transaction. The indicator can determine entry points in any trading period, starting from the chart M5 to W1. At the same time, for the convenience of the user, the entry point in the form of an arrow is always drawn at a certain point and the rec

Very Accurate Market Trend Indicator! Advantages
easy, nice visual and effective trend detection given Always opportunities works on all pairs Forex, Crypto, Commodities, Stocks, Indicies works on all timeframes, but higher TF 1-4Hr is more effective !!!! WARNING !!!! This is trend indicator, it searching for trends in the market! You need patience and you may see loosing trades in a row but that is normal! Do not panick! Once you detect the trends and its confirmed there will be plenty of pi
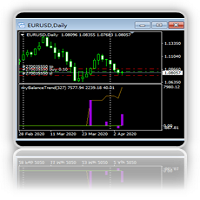
Account Fund Income Trend Line Indicator 1. This indicator is used to automatically draw a curve and a histogram of the profit amount of the trading order that has been closed in the current account and the account balance after the position,and the three data of the transaction volume, which is applicable to all cycles of the chart.2. The three data can be exported into CSV files by date, which is convenient for data analysis of third-party software. 3. The indicator contains an external para

SignalRB - the arrow indicator shows potential entry points into the market in the form of arrows of the corresponding color: up arrows (blue) offer to open a purchase, down arrows (red) - to sell. The appearance of arrows may be accompanied by sound signals if the sound option is enabled. It is supposed to enter the next bar after the pointer, but there may be non-standard recommendations for each strategy.
SignalRB visually “unloads” the price chart and saves analysis time: there is no sign
Extremums and Candles
1. Description The Extremums and Candles (EC) indicator is a custom indicator based on the visual analysis of candles. The indicator displays the direction of price movement and extremes for the studied period of time. The EC indicator is designed according to the principle that candles inside the next one or inside the previous one, regardless of their type and the length of their shadows, are not taken into account when determining the direction of marke
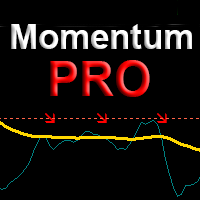
Professional version of the Momentum indicator. Works great on trending currency pairs, and also accurately shows where to top up positions by trend. It displays the direction of entry on the chart with arrows and alerts when an entry point appears. With a minimal interface has high functionality. Features It has no lag and gives a noticeable advantage over the standard Momentum indicator Simple and intuitive graphical interface, minimum settings. Settings of each moving for your trading style.

Trend Giver is a Simple To Use indicator.
Good for Scalping and Trend Following.
if you need help on how to use this indicator,
am here for you.
Trend Giver: is for every class of traders, and can be used for Forex Trading, Binary Option, and Cryptocurrencies. Be it Currency , Commodity ,Stock, or Cryptocurrencies.
It does not repaint and comes with all type of Alert.
Trend Giver : Can be run in all type of instrument.{Forex, Commodity ,Stock, or Cryptocurrencies}.
Trend Giver : Can

The median indicator is a type of technical analysis tool commonly used in forex trading. It is based on calculating the median price of a currency pair over a specific period of time. The median price is the middle value between the high and low prices. Compared to the widely used moving average (MA) indicator, the median indicator offers a unique perspective on the market. Here are some advantages of using the median indicator: Robustness to outliers: The median is less affected by extreme pr
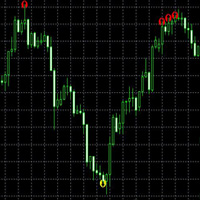
The Breaking Highs and Lows Indicator finds areas of support and resistance based on past trending activity. It uses an algorithm to compare jumps in the periods of highest highs and lowest lows. It compares the current period with the prior period to see if there is a significant jump in periods that it has been the highest high or the lowest low for. For instance, if the current period has been the highest high for 100 days, where the prior period was the highest high for 5 days, this would be
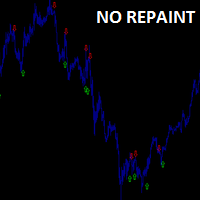
Трендовый мультитаймфреймовый стрелочный индикатор. Не перерисовывает сигналы после закрытия свечи.
Приемущества
Индикатор никогда не перерисовывает, не пересчитывает и не достраивает сигналы. Работает на всех символах и таймфреймах.
Торговля Выход из сделки на покупку при появлении нового сигнала на продажу. Выход из сделки на продажу при появлении нового сигнала на покупку.
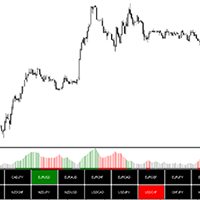
For those who already know EasyADX: https://www.mql5.com/en/market/product/32503
EasyADX Screener is the multi-pair version which simplifies the use of the indicator. It saves the resources of your computer, for example for the simple version, you will have to open all the pairs in metatrader to analyze them with the indicator but the multipair version, you launch it on a pair of your choice and it task to analyze all the pairs you pass to it in parameters:
- Button lights red, Bearish tren

Simple indicator - show potential entry points in the form of changes in the color of lines of the corresponding color. Entrance to the next bar is expected after the color changes, but there may be individual recommendations. But do not forget that the approach should be comprehensive, indicator signals require additional information to enter the market. It is practically not late, behaves correctly in the periods of speculation.
This is one of the few indicators that reliably works on tradi
SPECIAL PRICE Great offers on all products. Great opportunities. BB System Indicator It is an indicator based on the Bollinger Bands and the intersection of signals deriving from three WPR. Bollinger Bands is one of the best indicators that together with three crisscrossing WPRs, provides valid high percentage signals. For us passionate traders of bollinger bands, who know their validity, this indicator is certainly suitable. If you are interested soon I will put my EA ICHIMOKU CONSOLE on sale
Определения текущей тенденции одна из самых важных задач трейдера не зависимо от стиля торговли. Индикатор Price Detect Volume поможет с достаточно высокой вероятностью это сделать. Price Detect Volume - индикатор распознавания тенденции, использующий авторский алгоритм расчета, использующий объемы. Показания индикатора не изменяются не при каких условиях. Также с помощью индикатора можно наблюдать за коррекцией цены в сторону глобального тренда, определять возможные границы окончания отката
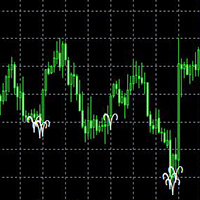
This indicator averages the last 5 bars (determined by the input parameter 'Average_Bars' defaulted at 5 which can be adjusted). Muliplies this average volume by the input parameter 'Multiply_Volume' (default 1.5), then compares this to the current volume bar. If there is a significant increase in the current volume, the indicator is flagged. This is to determine when the 'big players' buy/sell into the market, or if there's significant activity behind a price increase/decrease.
Moving Average Change
Do you wonder where to take profits? Have you ever searched a simple strategy to execute trades? The Moving Average Change indicator is a perfect product for you. The indicator is perfect for finding divergence on charts. It works perfectly on any timeframe but keeps in mind m1 to m15 will be short-lived signals. You can still use it to scalp forex indices and commodities. The indicator also has an option for backstep where you can check the change in MA value between not

Scalper Mate Muti-Symbols This indicator gives you the signal of high level price moving of current bar compare to average price moving in the defined period. Not only price moving calculation but also spread value of symbol is taken in to consideration. Indicator will work and provide signal for Multi-symbols, up to 8 symbols as define in the input parameter. The indicator has a flexible system of settings, and any trader can easily adjust them to his needs. It can work for all timeframes but

The BuySellAlert arrow indicator is developed based on the use of HMA, Laguerre, CCI, and ATR . The BuySellAlert arrow indicator: generates entry points for BUY and SELL displays current profit ; displays current spread. The profitability of the indicator is shown in the screenshot on the example of the GBPUSD pair Does not redraw and works on opening bar. Time frames - M1-M30. Recommended Time frames M5-M15. Setting ALARM - enable/disable the alarm; Push - enable/disable Push notificatio
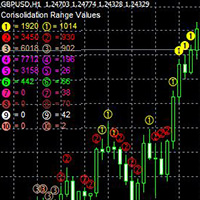
20 Consolidation ranges are derived using the current bid price, then adding/subtracting the input parameter from the bid price to get each consolidation range. For instance, the input parameter default is .01. If the current bid price is 1.09616 (EURUSD), then the upper limit for the first consolidation band is 1.10616 and the lower limit is 1.08616. 10 consolidation bands are above the bid price and 10 are below. Closed prices for each period are counted within each range and the totals are s

Pivot Points Indicator Features: Send alerts when a pivot line is hit Displays Daily, Weekly, Monthly Indicators at the same time on the chart Restricting the time during the day when the alerts are sent Adjust the styling settings for the Pivot lines Settings: Show Daily Pivots Show Weekly Pivots Show Monthly Pivots Weekly Pivots Hit Notification Enabled Monthly Pivots Hit Notification Enabled Hit Check Frequency Time Restriction Enabled From Hour To Hour PP Color R1 Color R2 Color R3 Color S1

Determined Trend is a direction indicator for determining a trend.
You need to understand that any dial indicator is just a visual waveform. As a rule, such Forex indicators contain a whole trading system, process information from several technical instruments and the appearance of its “arrow”? final calculation result. The indicator itself evaluates how strong a signal appears in the market, signals about it, and the trader can only make a trading decision.
The Determined Trend indicator v

Great offers on all products. Great opportunities. The Super Trend Precision indicator is a performing variant of the classic super trend. The indicator manages to anticipate a possible direction that the market will take, you can see from the pictures. First by a warning with the crossing of the first red line and then by the confirmation with the crossing of the second green line. It is mainly a trend indicator. It could also be used with the EA Trend Candle Sell. Happy Trading.

This indicator is equipped with a risk and reward calculation, whether it is the calculation of lots to be used, the determination of the price of stop loss and take profit, and also the notification of whether the colors that occur can be used or not. You can adjust the risks that make you calm by changing the settings provided in the indicator menu. this indicator can work well using H1 time frame. You only wait for an indicator command when you want to open an position. for further learning

Forex Pro Analyzer. Find top performing strategies on your MT4 account
This tool enables you to analyze all your Forex trades executed manually or by an expert or several EA's.
It will group and examine all trading positions by magic numbers, and will show you trading performance for each strategy so you can spot the winners immediately.
You get Fast trade statistics fast a on your MT4 chart window.
Imagine you want to test 10 different EA's on one single mt4 terminal with this tool it wi

The indicator is simple and clear, making the work of the trader as easy as possible and giving clear signals to enter the market.
This indicator has two settings for the period. Which makes it more flexible. And at the same time, many false signals do not appear. The larger the period, the smoother the indicator itself will be.
It can be used both independently and together with other indicators of technical analysis (including with oscillators), as well as with another same indicator (wit

Индикатор отображает регнессионный канал с сопровождением каналов фактически создавая уровни поддержки и сопротивления.
Уровни поддержки и сопротивления являются одним из важнейших элементов технического анализа. С этим утверждением согласится любой трейдер. Уровни в трейдинге используются непосредственно, открывая и закрывая ордера у границ диапазона, очерченного ими. Также уровни применяют баланс спроса и предложения в своих торговых стратегиях на различных временных интервалах.
Визуально
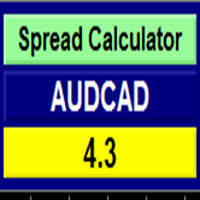
Currency Spread Calculator
This indicator is created with the aim of letting the Traders know the exact points of the spread on the currency pair they are about to buy or sell.
This will safe them of paying exorbitant spread over a single currency pair procurement. Imagine a normal spread become wider from 2 or 3 pips to 15pips or more when there is volatility in the market. It is absolutely outrageous looking for just 20 pips and paying another 20 pips as spread over a currency pair!
A
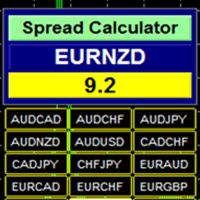
Currency Spread Calculator Plus
This indicator is created with the aim of letting the Traders know the exact points of the spread on the currency pair they are about to buy or sell. What makes it a PLUS is that Symbol/Time frame Changer is coded with this indicator to make it easier navigating from one currency pair to another and one time frame to another on the same chart window without having to open tens of chart window in order to study more currency pairs. It saves time, energy, stress

Abiroid Profit Percent Series 1: Arrows Indicator Stochastic Ichimoku with ATR
Get the Scanner for free. For getting Profit Percentages for Multiple Timeframes and Multiple Pairs. And read detailed description about this indicator and all the settings here. And get extra Indicators, Templates and settings for download: https://abiroid.com/product/profit-percent-stoch-ichimoku-with-atr
Watch the tutorial video here: https://youtu.be/C45-9kWPE2Q
About The Strategy:
This strategy has 3 main

The Point61 indicator is the result of many years of monitoring of price behavior of currency pairs and metals.
It is not a secret, that in times of uncertainty, traders are looking for possible levels of support and resistance - the point, where price should stop its movement.
There are 2 possible scenarios at these points:
1. Reverse (correction) to the opposite direction;
2. Breakthrough to continue movement. Very often these points are used to set stop orders - TakeProfit or
MetaTrader Mağaza, MetaTrader platformu için uygulama satın almak adına rahat ve güvenli bir ortam sunar. Strateji Sınayıcıda test etmek için Uzman Danışmanların ve göstergelerin ücretsiz demo sürümlerini doğrudan terminalinizden indirin.
Performanslarını izlemek için uygulamaları farklı modlarda test edin ve MQL5.community ödeme sistemini kullanarak istediğiniz ürün için ödeme yapın.
Ticaret fırsatlarını kaçırıyorsunuz:
- Ücretsiz ticaret uygulamaları
- İşlem kopyalama için 8.000'den fazla sinyal
- Finansal piyasaları keşfetmek için ekonomik haberler
Kayıt
Giriş yap
Gizlilik ve Veri Koruma Politikasını ve MQL5.com Kullanım Şartlarını kabul edersiniz
Hesabınız yoksa, lütfen kaydolun
MQL5.com web sitesine giriş yapmak için çerezlerin kullanımına izin vermelisiniz.
Lütfen tarayıcınızda gerekli ayarı etkinleştirin, aksi takdirde giriş yapamazsınız.