 MetaTrader 5
 Uzmanlar
 Göstergeler
 Kütüphaneler
 Yardımcı programlar
 Widget'lar
 Kurallar
YouTube'dan Mağaza ile ilgili öğretici videoları izleyin
Bir alım-satım robotu veya gösterge nasıl satın alınır?
Uzman Danışmanınızı
sanal sunucuda çalıştırın
sanal sunucuda çalıştırın
Satın almadan önce göstergeyi/alım-satım robotunu test edin
Mağazada kazanç sağlamak ister misiniz?
Satış için bir ürün nasıl sunulur?
MetaTrader 4 için ücretli Teknik Göstergeler - 129
 Aşağıda listelenen teknik göstergelerden gelen sinyaller, MetaTrader 4 platformunda işlemler açılması ve kapatılmasında çok önemli bir rol oynar.
Göstergeler, fiyat değişikliklerini tahmin etmeyi amaçlayan, finansal sembol fiyatının matematiksel dönüşümüdür.

Dynamic Flow M30 – Smart Trend & Signal System for MT4 Professional Trading Indicator for the 30-Minute Timeframe Dynamic Flow M30 is a powerful MetaTrader 4 indicator specifically optimized for the M30 (30-minute) timeframe , designed to help traders identify trend direction, momentum shifts, and potential entry opportunities with precision and clarity. Built using a combination of adaptive volatility bands and EMA-based market flow analysis, this indicator automatically adjusts to changi

Reversal Identifier MT5 - Grafikte ters yön noktalarını bulabilen bir gösterge.
Yeniden çizim veya gecikme olmadan çalışır, fraktal tepe ve dipleri belirler ve ters yönleri oklarla işaretler.
Gösterge, düzeltme veya trend yönünde değişiklik meydana gelmeden önce erken ters yön noktalarını belirler.
Bu göstergenin en iyi kullanım alanı, trendi belirlemek için daha yüksek zaman dilimini ve giriş sinyallerini almak için daha düşük zaman dilimini kullanarak iki zaman dilimindedir.
Gösterge tek ba

MT4 için "RVI Hızı" Kripto Forex Göstergesi, Yeniden Boyama Yok. - Bu göstergenin hesaplanması fizik denklemlerine dayanmaktadır. RVI Hızı, RVI'nin birinci türevidir. - Göreceli Canlılık Endeksi (RVI), trend piyasalarında oldukça faydalı olan teknik bir momentum göstergesidir. - RVI Hızı, ana trend yönünde fiyat düzeltmesinden sonra momentum girişleri için iyidir. - Uygun trend göstergeleriyle, örneğin standart EMA (resimlerdeki gibi) ile birlikte kullanın. - RVI Hızı göstergesi, RVI'nin yönünü

MT4 için Crypto_Forex Göstergesi "Çift Kayan Yıldız paterni", Yeniden boyama yok, gecikme yok. - "Çift Kayan Yıldız paterni" göstergesi, Fiyat Hareketi işlemleri için çok güçlü bir göstergedir. - Gösterge, nadir ancak etkili bir paterni tespit eder: Grafikte düşüş yönlü Çift Kayan Yıldız: - Düşüş yönlü Çift Kayan Yıldız paterni - Grafikte kırmızı ok sinyali (resimlere bakın). - Dahili PC ve Mobil uyarıları vardır. - "Çift Kayan Yıldız paterni" göstergesi, Destek/Direnç Seviyeleriyle birleştirme

Heiken Ashi Trend is a MetaTrader 4 indicator designed to help traders identify trend direction using Heiken Ashi candle structure combined with trend-confirmation filters. The indicator displays bullish and bearish trend phases directly on the chart, helping traders follow market direction more clearly and avoid unnecessary noise during fast price movement. Main Features Heiken Ashi based trend visualization Smooth trend-following structure Optional EMA line display ADX, CCI and MACD confirmati

Nested Pivot Arrows NR Nested Pivot Arrows NR is a non-repaint MT4 and MT5 indicator that identifies nested pivot structures and highlights potential market turning points directly on the chart. The indicator automatically detects: • Short-Term Highs (STH) and Short-Term Lows (STL)
• Medium-Term Highs (MTH) and Medium-Term Lows (MTL)
• Long-Term Highs (LTH) and Long-Term Lows (LTL)
• Buy and Sell signals based on confirmed nested pivot formations Features: Non-Repaint Logic
MT4 & MT5 Version

Daily End Potential (DEP) v1.26, MetaTrader 4 için, belirtilen bir zaman penceresindeki fiyat aralığını analiz eden ve işlem günü sonuna kadar fiyatın yukarı veya aşağı hareket etme olasılığını hesaplayan teknik bir göstergedir. GÖSTERGENİN AMACI Bu gösterge, yatırımcıların önemli bir fiyat aralığının oluşumundan sonra gün içi hareketin en olası yönünü belirlemelerine yardımcı olur. Fiyat aralığın üst sınırına daha yakınsa, aşağı yönlü hareket potansiyeli daha büyüktür ve bunun tersi de geçerlid

Most indicators never ask the most important question: is there actually a cycle running right now? Prisma asks it on every bar. When the answer is no, it stays silent. When the answer is yes, it tells you exactly where inside that cycle price currently sits — and signals the crossover at the right moment. The result is an oscillator that filters out the noise that destroys most fixed-period indicators, and fires only when three independent scientific systems agree. Three Scientific Layers 1. Eh

New York AM Session Profile
NY AM Session Profiling Framework | Non-Repainting | Real-Time | FX & Index Presets | MT5 Version Available
Full Setup Guide & Strategy Playbook: https://www.mql5.com/en/blogs/post/771380
MT5 Version: https://www.mql5.com/en/market/product/180798
Indicator Overview The New York AM Session Profile framework is a professional market-structure visualization tool designed for traders who study liquidity, session behaviour, and institutional price delivery. Instead

"Dinamik Trend Osilatörü" - gelişmiş, özel bir Kripto-Forex göstergesi - MT4 için verimli bir işlem aracı! - Yeni nesil Osilatörler - nasıl kullanılacağını görmek için resimlere bakın. - Dinamik Trend Osilatörü, uyarlanabilir Aşırı Satış/Aşırı Alım bölgelerine sahiptir. - Bu osilatör, dinamik Aşırı Satış/Aşırı Alım bölgelerinden ana trend yönüne doğru kesin giriş noktalarını bulmak için yardımcı bir araçtır. - Aşırı Satış değerleri: Yeşil çizginin altında, Aşırı Alım değerleri: Mavi çizginin üz

Volume Arrow Signal Product Description Volume Arrow Signal is a smart trading indicator designed to help traders identify potential buy and sell opportunities using price action, volume behavior, and directional arrow signals. The indicator places clear arrows directly on the chart, making it easy to spot possible market reversals, trend continuations, and entry opportunities without spending hours analyzing charts manually. Whether you are trading Gold (XAUUSD) , Forex pairs, Indices, or Crypt

SMC Price Action Pro is a visual Smart Money Concepts indicator for MetaTrader 4.
It is designed for traders who analyze market structure, liquidity, order blocks, fair value gaps, equal highs and lows, previous high and low levels, premium and discount zones, and retracement areas directly on the chart.
This indicator does not open, modify, or close trades. It does not use automated order execution. It is a manual chart analysis tool created to support the trader’s own decision-making proces

BAND REVERSAL ZONES è un indicatore pensato per aiutare il trader a riconoscere con maggiore immediatezza le fasi in cui il prezzo si spinge troppo lontano dalla propria area di equilibrio. Grazie a una struttura composta da linea centrale dinamica e bande adattive, consente di leggere visivamente le condizioni di eccesso del mercato e di individuare con più chiarezza possibili momenti di rallentamento o perdita di forza del movimento in corso.
L’indicatore è progettato per poter essere utiliz

BK-GTA 基于匿名化、聚合化数据产出研究文章、训练方法、行为洞察;其 的核心资产不是“结果数字”,而是人在受控环境中的决策过程数据。它让训练、复盘、研究和系统优化变得可记录、可比较、可迭代; 同一类场景可以被多次运行、对比和复盘,减少真实环境中不可控因素对研究结果的干扰; 通过规则、限制、冷静期和任务边界,帮助用户在可控环境中练习纪律; 记录决策路径、反应时间、执行偏差和稳定性指标,支持长期行为分析; 长期行为记录对系统一致性要求较高。云端环境主要用于提高运行稳定性、降低网络中断风险、保持环境一致、避免记录污染、支持长期连续训练; 风控系统属于训练辅助工具。可包括最大回撤限制、异常行为提醒、冷静期、强制限制机制;仅适用于模拟环境,不构成投资建议。

MGH-MultiStoch — Multi-Timeframe Trend Detection and Wave Analysis MGH-MultiStoch is a multi-timeframe trend indicator that displays up to 6 timeframes simultaneously in one window. It helps traders confirm trend direction across timeframes, count market waves visually, and build forward-looking wave scenarios based on higher-timeframe crosses. The indicator uses a custom multi-timeframe calculation method developed specifically for this product. It is available for both MetaTrader 4 and MetaTra

Project profits with precision. Equity Master Projection is a comprehensive trade management and analytics dashboard that goes beyond simple equity tracking. It analyzes both open positions and historical trades across multiple symbols and magic numbers, applying powerful filters to isolate your best-performing strategies. With unique features like a "Cut Mode" for profit capping and dynamic HTML/CSV reporting with equity curve charts, this tool transforms raw trading data into a clear, actiona

Have patterns that drive your trading success or failure. The Equity Performance Analyzer breaks down your trade history by symbol, day of the week, and hour of entry to identify exactly when your strategies perform best and worst. It ranks every possible trading pattern (e.g., "EURUSD-BUY-Mon-14") by Net Profit, Win Rate, Return/Drawdown, and a Monte Carlo Proxy. More than just an analytics tool, it generates ready-to-use input parameters for your EAs and a crucial "Worst Patterns to Avoid" se

Ensure your trading strategy's future performance by trading only on stable, reliable pairs. The Pair Stability Indicator analyzes the velocity and volatility of any symbol to determine if it can support consistent strategy execution. It calculates critical metrics like Pips per Second, Dollars per Pip, and Dollars per Second of movement, scoring each pair from 0-100%. By identifying highly stable instruments (e.g., EURUSD) and flagging unstable ones (e.g., XAGAUD), this indicator acts as a cru

Turn market pullbacks into profitable recovery trades with the PullBack Velocity Indicator. This tool identifies when a currency pair is in a pullback phase and calculates its velocity to project potential recovery profits. By analyzing the depth and duration of a pullback against the pair's current momentum, the indicator provides a clear "Expected Profit" in pips and dollars, along with an estimated recovery time. It actively alerts you to "HIGH POTENTIAL RECOVERY" scenarios, giving you a qua

Speed Trade Master filters your trade history and open positions to find only the fastest, most efficient trades—winners that hit profit targets quickly and losers that are cut short with minimal drawdown. By applying strict filters for Max MAE ($ and time) and Max MFE (time), it isolates "Lightning Trades." The tool then projects future performance and analyzes weekly patterns, providing a free, essential dashboard for any trader looking to optimize for speed and efficiency.
Key Features: Tri

Peak Pips MT4 Zero-Repainting Trend Signals, Peak-Pips Tracking and Multi-Timeframe Scanning Peak Pips MT4 is a powerful trend-analysis indicator designed to help traders identify fresh BUY and SELL opportunities for scalping, intraday and swing trading, all from one chart. Backed by 23 years of testing with Dukascopy 100% tick data, the indicator combines a protected signal algorithm, confirmed zero-repainting signals, live peak-pips tracking and a built-in multi-timeframe scanner in one trader

Release Price is a highly discounted SALE Price! Price will increase after first 50 sales
Read detailed post with screenshots here: https://www.mql5.com/en/blogs/post/771350
Features (What the indicator does for you) Detects both bullish and bearish Cups: Finds the classic “cup‑and‑handle” and its upside‑down version. Mathematical cup shape: Uses quadratic regression to make sure the cup looks like a smooth “U” rather than a jagged “V”. Two entry line options: Horizontal resistance line or a

MT4 için "Trend ZigZag Pro ile MACD" Kripto Forex Göstergesi. - MACD göstergesi, trend ticareti için en popüler araçlardan biridir. - "Trend ZigZag Pro ile MACD", Fiyat Hareketi girişleriyle veya diğer göstergelerle birlikte kullanmak için mükemmeldir. - En doğru giriş sinyallerini seçmek için bu göstergeyi kullanın: - MACD 0'ın üzerindeyse (yeşil renk) ve ZigZag çizgisi yukarı doğruysa, yalnızca Alış Fiyatı Hareketi formasyonlarını arayın. - MACD 0'ın altındaysa (pembe renk) ve ZigZag çizgisi

MT4 için Crypto_Forex Göstergesi Hızlanma Çubuğu - büyük trendleri yakalayabilir. - "Hızlanma Çubuğu" göstergesi, trend ticareti için çok güçlü bir araçtır - piyasanın yatay etkisi en aza indirilir. - Boğa Hızlanma Çubuğu (mavi), grafikte maksimum değeri önceki 5 çubuğun maksimum değerinden yüksek ve minimum değeri sonraki 5 çubuğun minimum değerinden düşük olan çubuktur. - Ayı Hızlanma Çubuğu (kırmızı), grafikte minimum değeri önceki 5 çubuğun minimum değerinden düşük ve maksimum değeri sonrak

Tired of cluttered charts and moving averages that lag or change every time you switch timeframes? It is time to trade like the institutions. VWAP MT4 Clean Version brings you the ultimate Volume Weighted Average Price indicator, stripped of distracting bands to give you a crystal-clear view of the true market bias. VWAP is the exact tool used by "Big Boys" and institutional traders to detect heavy volume and market equilibrium. Why Choose VWAP Clean Version? 100% Non-Repaint & Multi-Timeframe C

MT4 için Kripto_Forex Göstergesi HTF MFI Osilatörü. - Para Akışı Endeksi (MFI), aşırı satım ve aşırı alım bölgelerini belirlemek için fiyat ve hacim verilerini kullanan teknik bir osilatördür. - HTF, daha yüksek zaman dilimi anlamına gelir. Aşırı alım, MFI'nin 80'in üzerinde olduğu ve Aşırı satım, 20'nin altında olduğu anlamına gelir. - MFI, Fiyat Hareketi sinyalleriyle birlikte kullanmak için idealdir. Yükseliş ve düşüş fiyat momentumu hakkında bilgi sağlar. - Bu gösterge, diğer göstergelerle

PinMetrics Size Statistics Dashboard | Wick Ratio Analysis | Performance Metrics Stop guessing which pin bars work. Let the data reveal the edge. Overview PinMetrics is a professional MetaTrader 4 indicator that automatically detects and analyzes pin bar patterns, categorizing them by wick-to-body ratio. It provides comprehensive performance statistics for each size category, helping traders identify which pin bar patterns offer the most reliable trading opportunities. Not all pin bars are cre
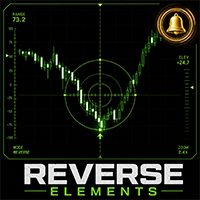
Reverse Elements - Formatted Description Reverse Elements Reverse Elements is a signal-based indicator designed to help identify potential market reversal points directly on the chart. Using a proprietary calculation method, the indicator displays buy and sell signals with arrows. It is built to support discretionary trading by making potential entry areas easier to recognize visually. This is not an Expert Advisor and does not place trades automatically. Main Features Buy and sell arrows displa

Gold is now highly volatile, with swings of 100 dollars happening frequently. That's why traditional long-term trading no longer fits—short-term trading is the way to go. My technical indicator is designed for MT4 short-term trading, specifically for the 1-minute gold chart. You can download it and check it out. Feel free to reach out if you have any questions. The first 10 copies are offered at a relatively low price, and the price will go up afterwards.

MT4 için "Major_Trend_Correction Histogram" Kripto Forex Göstergesi, Yeniden Boyama Yok. - Major_Trend_Correction Histogram göstergesi, büyük trendleri tespit etmek için tasarlanmıştır. - Gösterge 2 renkte olabilir: Kırmızı düşüş trendi, Mavi yükseliş trendi (renkler ayarlarda değiştirilebilir). - En az 10 ardışık aynı renkteki histogram sütunu yeni bir trendin başlangıcını gösterir. - Göstergede yerleşik Mobil ve PC uyarıları bulunur. - "Period" parametresi göstergenin hassasiyetinden sorumlud

Delta VA Zones PRO — version 2.8
An indicator combining synthesis of the Volume Profile, Delta analysis, and impulse filters for intraday trading.
Concept
Delta VA Zones PRO unites four analytical methods into a single system with objective entry criteria:
Volume Profile — automatic construction of POC (Point of Control), VAH (Value Area High), VAL (Value Area Low) levels based on real volume. Delta analysis — assessment of the imbalance between aggressive buys (market buy) and sells (marke

This powerful indicator displays the ATR (Average True Range) value directly on your chart in points, eliminating the need for a separate oscillator window. Simply select your preferred ATR period and instantly monitor market volatility in real time. The displayed value automatically updates according to the currently selected timeframe, providing fast and accurate volatility information exactly when you need it. Lightweight, user-friendly, and highly practical, it's the perfect tool for traders

Dynamic Trend Moving Average is an intelligent moving average indicator designed to help traders instantly identify the current market trend through a simple and intuitive color-coding system. Unlike traditional moving averages, this indicator automatically changes color according to market conditions: Green – Bullish trend detected
Red – Bearish trend detected
Yellow – Neutral market or transition phase This visual approach allows traders to quickly assess market direction without havi

Stop wasting time calculating your Stop Loss and Take Profit levels manually! ATR SL/TP Calculator is a powerful MT4 indicator designed to display in real time the current ATR value, as well as the corresponding Stop Loss and Take Profit distances directly on your chart, in points. Whether you use volatility-based risk management or ATR multiples in your trading strategy, this indicator instantly performs all calculations for you and updates them automatically according to the currently selecte

50% OFF for the First 50 Users 1. Overview ? ICT IFVG All-Currency Scanner Detects IFVG (Inverse Fair Value Gap) signals across all currency pairs simultaneously. An IFVG occurs when a candle body fully breaks through a prior Fair Value Gap in the OPPOSITE direction ? a key ICT concept indicating a potential institutional reversal. IFVG 448 Scanner Guide is Here
BUY signal : Bear FVG is broken upward → price likely to rise SELL signal : Bull FVG is broken downward → price likely to

SMC Structure Gap Monitor Pro Bu MetaTrader 4 göstergesi, daha kapsamlı bir SMC tarzı yapı iş akışı isteyen yatırımcılar için tasarlanmıştır. Odak noktası yapısal kırılımlar, inducement akışı, bakir ve temas edilmiş Fair Value Gap bölgeleri, likidite sweep'leri ve momentum bağlamıdır. Ana fikir: yalnızca izole yapı etiketleri göstermek yerine, bu sürüm fiyatın nasıl baskı oluşturduğunu, inducement'in nerede geliştiğini, sweep'lerin ne zaman oluştuğunu ve momentumun bu bölgeler çevresinde nasıl

Master Precision Trading with the ICT Macros Time Window Indicator (ICT Makro Zaman Penceresi Göstergesi ile Hassas İşlem Ustalığı) Zamanlama, finansal piyasalardaki nihai avantajdır. Inner Circle Trader metodolojisini takip eden yatırımcılar için, algoritmanın fiyatı tam olarak *ne zaman* hareket ettireceğini bilmek, *nereye* gideceğini bilmekten çok daha önemlidir. ICT Macros Time Window Indicator , bu algoritmik zaman segmentlerini doğrudan grafiklerinizde izlemeniz için vazgeçilmez aracınızd

SUPER HERO Signals , MeanFX tarafından geliştirilen yeni nesil bir göstergedir. Hassas alım-satım sinyallerini adaptif TP/SL (Kâr Al / Zararı Durdur) seviyeleriyle birleştirerek, mümkün olan en güçlü istatistiksel avantaja sahip işlemler sunar. Fiyat her 5 satın alımdan sonra artmaktadır. Bir sonraki fiyat 50$ olacaktır. Satın almadan önce benimle iletişime geçerek canlı grafik önizlemesi ve güncel işlem istatistiklerini alabilirsiniz. Bu sayede daha bilinçli bir karar verebilir ve işlem per

Londra Pullback Trading Sistemi (London Pullback Trading System) Genel Bakış London Pullback Trading System, piyasa yapısı seviyelerini belirlemeye, Londra seans hareketlerini takip etmeye ve hareketli ortalama ile Londra bölgesi arasındaki uyumu kullanarak yüksek olasılıklı pullback fırsatlarını tespit etmeye yardımcı olmak için tasarlanmış profesyonel, seans bazlı bir trading indikatörüdür. İndikatör, seansların yüksek ve düşük seviyelerini otomatik olarak çizer, dinamik Londra trading bölgesi

Vortex Level System – Your Intelligent Compass in the Trading World Say goodbye to visual clutter and welcome mathematical precision and real-time analysis. Do you find yourself overwhelmed daily by excessive indicators and conflicting signals? Are you tired of manually drawing levels and waiting for opportunities that rarely materialize? We developed the Vortex Level System not just as another indicator, but as a comprehensive "Trading Assistant." It acts as a live roadmap, displayed clearly on

HigherTF Background Candle draws higher timeframe candlesticks directly on your chart background, giving you instant multi-timeframe context without switching charts.
KEY FEATURES
- Background HTF Candles: Renders Open/High/Low/Close of any higher timeframe as colored rectangles behind your price action. - Instant TF Switching: Press keys 1-9 to switch between M1, M5, M15, M30, H1, H4, D1, W1, MN1. Press 0 to hide. - Auto-Promotion: If the selected TF is equal to or lower than the cha

MT4 için "Dinamik Sınırlı Hareketli Ortalama" Crypto_Forex Göstergesi. - Gösterge, Hareketli Ortalamaya bağlı benzersiz bir özelliğe sahiptir - Dinamik Volatilite Sınırları. - Dinamik Volatilite Sınırları, hesaplama için Ortalama Gerçek Aralık değerlerini kullanır. - Bu gösterge, Kar Alım Satım hedeflemesi ve sınır çizgilerinde SL düzenlemesi için mükemmeldir. - Gösterge, Fiyat Hareketi sinyalleriyle de mükemmel bir şekilde birleştirilebilir. Yüksek kaliteli Trading Robotları ve Göstergelerini

Quarterly Theory Indicator: A Comprehensive Guide for SMC and ICT Traders (Üç Aylık Teori Göstergesi: SMC ve ICT Yatırımcıları İçin Kapsamlı Kılavuz) Quarterly Theory (Üç Aylık Teori) göstergesi , MetaTrader platformları için tasarlanmış gelişmiş bir zaman tabanlı analitik araçtır. Smart Money Concepts ve Inner Circle Trader metodolojisinin temel ilkelerine dayanan bu gösterge, finansal piyasalarda zamanın ve fiyat teslimatının fraktal doğasını görselleştirir. Gösterge, piyasaların rastgele hare

KT ICT Kill Zones Indicator , Asya, Londra ve New York Kill Zone'larını doğru New York saatine göre her gün otomatik olarak grafiğinize çizer. Seans yüksek ve düşük seviyeleri, likidite süpürmeleri (Liquidity Sweeps), Midnight Open, True Day Open ve her seansın işlem yaptığınız enstrümanda gerçekte nasıl davrandığını gösteren bir istatistik paneli sunar. Artık her sabah grafiğe manuel kutular çizmenize veya saat dönüşümlerinin doğru olup olmadığını kontrol etmenize gerek yok. Broker sunucu saat

ICT Kill Zones marks the four main intraday sessions on your chart and the high and low of each session. It is an analytical tool for traders who follow the ICT and Smart Money approach. It does not place orders and does not give automatic buy or sell signals. It shows when the active sessions occur and where session liquidity rests, so you can make your own trading decisions. Session high and low levels and sweep events are confirmed on closed candles only. Past levels are not redrawn. The M

MT4 için Crypto_Forex Göstergesi "Ters Çekiç ve Kayan Yıldız" paterni, Yeniden boyama yok, gecikme yok. - "Ters Çekiç ve Kayan Yıldız" paterni göstergesi, Fiyat Hareketi işlemleri için çok güçlü bir göstergedir. - Gösterge, grafikte boğa Ters Çekiç ve ayı Kayan Yıldız formasyonlarını tespit eder: - Boğa Ters Çekiç - Grafikte mavi ok sinyali (resimlere bakın). - Ayı Kayan Yıldız - Grafikte kırmızı ok sinyali (resimlere bakın). - Bilgisayar, Mobil ve E-posta uyarılarıyla. - "Ters Çekiç ve Kayan Y

KT VWAP with Standard Deviation Bands , periyodik olarak sıfırlanan bir VWAP çizgisi ve onun etrafında yer alan üç çifte kadar hacim ağırlıklı standart sapma bandı çizer. Piyasanın mevcut adil değerinin nerede bulunduğunu, fiyatın bu değerden ne kadar uzaklaştığını ve aşırı uzamış bir hareketin ortalamaya dönüşü gerçekten ne zaman teyit ettiğini görmenizi sağlar. Fiyatın çok yüksek mi yoksa çok düşük mü olduğunu tahmin etmeye çalışmak yerine, piyasanın kendi fiyat ve hacim davranışına dayanan is

"Dinamik Akış Osilatörü" - gelişmiş, özel bir Kripto-Forex göstergesidir - MT4 için verimli bir işlem aracıdır! - Yeni nesil Osilatörler - nasıl kullanılacağını görmek için resimlere bakın. - Dinamik Akış Osilatörü, uyarlanabilir Aşırı Satış/Aşırı Alım bölgelerine sahiptir. - Gösterge, aşırı satış ve aşırı alım bölgelerini belirlemek için fiyat ve hacim verilerini kullanır. - Osilatör, Aşırı Satış/Aşırı Alım bölgelerinden kesin giriş noktalarını bulmak için yardımcı bir araçtır. - Aşırı Satış d

MQL5 Blogları: https://www.mql5.com/en/blogs/post/771791 MT4 Sürümü: https://www.mql5.com/en/market/product/182305 MT5 Sürümü: https://www.mql5.com/en/market/product/182306
WAVE FIBONACCI [tambangEA], yükseliş ve düşüş fiyat projeksiyonlarını doğrudan grafikten okumak isteyen yatırımcılar için tasarlanmış profesyonel bir piyasa yapısı ve Fibonacci dalga analizi göstergesidir.
Gösterge, dalga yapısını, Fibonacci projeksiyon bölgelerini, hedef seviyelerini, salınım noktalarını ve çok sembollü n

MT4 için "CCI ve 2 Hareketli Ortalama" Kripto_Forex Göstergesi, Yeniden Boyama Yok. - Emtia Kanal Endeksi (CCI), trend yönünde momentum ticareti için mükemmeldir. - "CCI ve 2 Hareketli Ortalama" Göstergesi, CCI göstergesinin Hızlı ve Yavaş Hareketli Ortalamalarını görmenizi sağlar. - Yükseliş trendi - Hızlı Hareketli Ortalama, Yavaş Hareketli Ortalamanın üzerindedir; Düşüş trendi - Hızlı Hareketli Ortalama, Yavaş Hareketli Ortalamanın altındadır. - CCI, ticaret için en popüler osilatörlerden bi

Order Block Pro — Institutional Order Blocks with Entry, SL & 3 Take-Profits (ICT / SMC)
See where smart money entered and trade the retest with a complete Entry, Stop-Loss and TP1/TP2/TP3 plan — automatically, on closed candles only. Non-repaint. FULL DESCRIPTION Order Block Pro maps the institutional Order Blocks that drive price in the ICT / Smart Money Concepts framework and turns every valid one into a clean, ready-to-trade plan. No more guessing where to draw your zones: it finds the last

Best of the Best!
Enter/Exit Indicator This indicator provides clear BUY and SELL entry signals to help identify potential trading opportunities. Simply enter trades when a signal appears and manage your risk accordingly. Watch the included video for free tips and guidance on how to use the indicator effectively. Optimized for Gold (XAUUSD) , but settings can be adjusted to suit other markets and trading styles. If you have any questions, feel free to send a message. Please leave positive fee

MT4 için "Fiyat Aralığı Seviyeleri Pro" Forex Göstergesi. - "Fiyat Aralığı Seviyeleri Pro" göstergesi, oldukça kullanışlı bir profesyonel yardımcı yatırım aracıdır. - Fiyat (fiyat aralığı seviyeleri) ile ulaşılabilecek Günlük, Haftalık ve Aylık en olası seviyeleri gösterir. - Günlük aralık, gün içi yatırımcılar için faydalıdır. - Haftalık ve Aylık aralıklar, Swing ve Uzun vadeli yatırımcılar için faydalıdır. - Gösterge, Kâr Al hedeflerinizi planlamak veya Zarar Durdurma emri vermek için mükemme

AZ AI Core Pro Indicator Overview AZ AI Core Pro Indicator is a smart trading analysis tool designed to help traders identify potential market opportunities through trend analysis, multi-timeframe confirmation, support and resistance zones, AI-based filtering, and early signal detection. The indicator combines multiple analytical layers into a single visual system, allowing traders to identify BUY and SELL opportunities with greater confidence while reducing unnecessary market noise. Suitable fo

UT Dual-Engine Horizon UT Dual-Engine Horizon , MetaTrader 4 platformu için özel olarak geliştirilmiş gelişmiş, çok katmanlı bir trend takip ve momentum yürütme sistemidir. Piyasa yapısal analizini anlık işlem girişlerinden ayıran modern kantitatif (nicel) ticaret stratejilerinden ilham alan bu indikatör, tamamen özelleştirilebilir bir makro trend filtresinin yanı sıra iki bağımsız Ortalama Gerçek Menzil (ATR) hesaplama motorunu eş zamanlı olarak çalıştırır. Sistem, bu bileşenleri birleşik bir h

FX FVG iFVG Signal MT4, Fair Value Gap ve Inversion Fair Value Gap kavramlarını kullanan Forex yatırımcıları için geliştirilmiş bir MetaTrader 4 göstergesidir. Gösterge grafikte otomatik olarak bullish FVG, bearish FVG, bullish iFVG ve bearish iFVG bölgelerini işaretler. Fiyat bir iFVG bölgesine geri döndüğünde ve mum onayı oluştuğunda, gösterge potansiyel BUY veya SELL uyarısı verir. Özellikle H1 ve M30 zaman dilimleri için tasarlanmıştır. H1 ana yönü belirlemek için, M30 ise geri çekilme, tepk

The Liquidity Profiler Tools is indicator identifies major buy-side and sell-side liquidity levels and visualizes internal buyer/seller activity through volume delta-filled quadrants, providing a complete toolkit for analyzing liquidity sweeps and potential reversals. Detection The indicator utilizes a pivot-based detection system. When a swing high is confirmed, a Buy-Side Liquidity (BSL) zone is created; a swing low creates a Sell-Side Liquidity (SSL) zone. The script includes "Filter Overlaps

MT4 için Crypto_Forex Göstergesi "Sabah Yıldızı Formasyonu". Yeniden çizim yok, gecikme yok. - "Sabah Yıldızı Formasyonu" göstergesi, Fiyat Hareketi ticareti için çok güçlü bir araçtır - yükseliş trendindeki piyasalar için mükemmeldir. - Gösterge, grafikte yükseliş yönlü Sabah Yıldızı formasyonlarını tespit eder: Mavi ok sinyali (resimlere bakın). - PC ve Mobil uyarıları mevcuttur. - Ayrıca, düşüş yönlü "Akşam Yıldızı Formasyonu" göstergesi de mevcuttur (aşağıdaki bağlantıyı takip edin). - "Sab

MQL5 Blogları: https://www.mql5.com/en/blogs/post/771887 MT4 Sürümü: https://www.mql5.com/en/market/product/182726 MT5 Sürümü: https://www.mql5.com/en/market/product/182727
SMART STRUCTURE [tambangEA], yatırımcıların fiyat hareketlerini daha net, disiplinli ve bağlamlı bir şekilde okumalarına yardımcı olmak için tasarlanmış profesyonel bir piyasa yapısı ve birleşme göstergesidir.
Gösterge, Akıllı Para Kavramlarını, yapı etiketlerini, tepki bölgelerini, Fibonacci geri çekilme seviyelerini, SMI

QB Compass Signal Pro QB Compass Signal Pro is an advanced predictive market direction indicator for MetaTrader 4. It transforms multiple technical factors into a visual compass that helps traders identify potential BUY, SELL, EXTREME BUY, and EXTREME SELL zones before traditional trend-following indicators react. Unlike conventional indicators that only follow price, QB Compass Signal Pro combines momentum, volatility expansion, EMA angle analysis, RSI slope, fractal breakouts, and market struc

MGH-MagicLine — Trend & Multi-Timeframe Divergence in One Tool MagicLine combines trend detection and divergence analysis into a single indicator — a refined alternative to running MultiStoch and MultiMACD separately, with cleaner output and less lag. It is a confirmation and analysis tool . It does not give entry points, Take Profit or Stop Loss. Instead, it adds a strong, flexible confirmation layer that fits almost any trend-based strategy and helps you read the market with more clarity. Thre

THIS IS ONE OF THE INDICATORS USED IN THE ACTUAL EURUSD EA. THIS EA IS LARGELY EXPERIMENTAL AND WELL TESTED IN THE H1 CHART THROUGH LIVE TESTING.
TO USE THIS INDICATOR AS A STAND ALONE TOOL, YOU CAN DO SO IN SEVERAL WAYS SINCE THIS IS A VERSATILE INDICATOR WITH MANY DIFFERENT POSSIBLE SETUPS. GENERALLY, THE BLUE LINE INDICATES WHAT THE EXPECTED OVERALL TREND IS, BASED ON WHETHER IT STANDS ABOVE OR BELOW ZERO.
AS FAR AS THE NEXT PRICE CANDLE IS CONCERNED, THERE TWO MORE OBSERVATIONS YOU CAN DO

土耳其语版本 (Turkish Version) JMA Multi Timeframe Indicator , MT4 platformu için özel olarak tasarlanmış, trend takibi ve swing ticareti için mükemmel, gelişmiş bir teknik göstergedir. Klasik Jurik Moving Average (JMA) algoritmasını Çoklu Zaman Dilimi (MTF) yeteneği ile mükemmel bir şekilde birleştirir. Gecikmesinin son derece düşük olması ve olağanüstü pürüzsüzlüğü ile tanınan JMA, yatırımcıların trend dönüşlerini hassasiyetle belirlemelerini sağlar. Bu gösterge, mevcut grafiğinizde doğrudan da

Reverse_Elements_AllSearch Reverse_Elements signals multi-symbol / multi-timeframe scanner for MetaTrader 4
---------------------------------------------------------------------- Important Requirement ---------------------------------------------------------------------- Reverse_Elements_AllSearch requires the main Reverse_Elements indicator. Reverse_Elements_AllSearch is not a standalone signal-generation indicator. It is a scanner that reads signals from the main Reverse_Elements indicator an

MT4 için Kripto_Forex Göstergesi "Scalping Histogram Pro", Yeniden Boyama Yok. - Scalping Histogram Pro göstergesi, küçük fiyat düzeltmelerinden sonra fiyat momentumunun ana yönüne giriş sinyallerini aramak için kullanılabilir. - Scalping Histogram Pro 2 renkte olabilir: düşüş momentumu için turuncu ve yükseliş momentumu için yeşil. - En az 10 ardışık aynı renkte histogram çubuğu gördüğünüzde, güçlü bir momentumun gerçekleştiği anlamına gelir. - Giriş sinyali, histogramda zıt renkteki 1 sütun v

MT4 için "8 Sembol için DeMarker" Forex Göstergesi, Yeniden boyama gerektirmez. - DeMarker osilatör eğrisi, gösterge hesaplama süresi boyunca önceki en yüksek ve en düşük seviyelere göre mevcut fiyat pozisyonunu gösterir. - DeMarker, diğer osilatörler arasında en verimli düzenli sapma sinyallerini sağlar. - Aşırı alım bölgesinde (0,7'nin üzerinde) düzenli sapma olan satış girişleri ve aşırı satım bölgesinde (0,3'ün altında) düzenli sapma olan alış girişleri almak harikadır. - "8 Sembol için DeM

SuerteFX Scanner Pro — Institutional Smart Money Scanner for MT4 Identify high-probability BUY and SELL setups using Smart Money Concepts — with built-in signal accuracy tracking so you always know your real edge.
WHAT IT DOES SuerteFX Scanner Pro reads the market the way institutional traders do — through structure breaks, liquidity sweeps, and multi-timeframe confluence. It filters every potential signal through 5 layers before showing anything on screen. If conditions are not aligned, it wai

Volume Flow Heikin Ashi – Professional Institutional Trading System Tired of lagging indicators, fakeouts, and losing capital during choppy sideways markets? Welcome to Volume Flow Heikin Ashi , a professional-grade trend-following system designed to transform standard price charts into a powerful, institutional-level execution engine by synchronizing Price Action with Order Flow and Volume . Unlike generic indicators that only smooth out price fluctuations, this advanced algorithm combines Tren
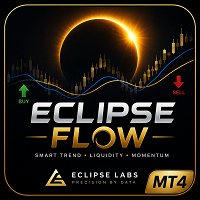
Product Name Eclipse Flow — TMA Band & RSI Sniper with Liquidity-Based SL/TP Short Description A multi-filter trading indicator combining TMA Band, RSI Sniper confirmation, and liquidity-based SL/TP logic — with a built-in 6-timeframe dashboard. Non-repainting. Full Description Eclipse Flow is a MetaTrader 4 indicator built to filter entry signals through multiple confirmation layers simultaneously, reducing false signals common with single-indicator strategies, while providing SL/TP guidance b

Gold Weekly High Trap Zones Weekly High Trap Zones is a clean MT4 weekly range-mapping indicator designed to help traders identify the key trap zone created around the current week’s high.
The indicator finds the current weekly high, identifies the session range connected to that high, and then projects a structured trap-zone ladder from that range. It displays the important weekly high origin level, trap zone top and bottom, 100 level, 161.8 target, 261.8 target, and optional higher extensio
MetaTrader platformunun uygulama mağazası olan MetaTrader Mağazasından bir alım-satım robotunun nasıl satın alınacağını öğrenin.
MQL5.community Ödeme Sistemi, PayPal, banka kartları ve popüler ödeme sistemleri aracılığıyla yapılan işlemleri destekler. Daha iyi bir müşteri deneyimi için satın almadan önce alım-satım robotunu test etmenizi şiddetle tavsiye ederiz.

Alım-satım fırsatlarını kaçırıyorsunuz:
- Ücretsiz alım-satım uygulamaları
- İşlem kopyalama için 8.000'den fazla sinyal
- Finansal piyasaları keşfetmek için ekonomik haberler
Kayıt
Giriş yap
Web sitesi politikasını ve kullanım şartlarını kabul edersiniz
Hesabınız yoksa, lütfen kaydolun