 MetaTrader 5
 Experts
 지표
 라이브러리
 유틸리티
 위젯
 규칙
MetaTrader 4용 유료 기술 지표 - 129
 아래 나열된 기술 지표의 시그널은 MetaTrader 4 플랫폼의 거래를 열고 종료하는 데 중요한 역할을 합니다.
지표의 본질은 가격 변화를 예측하기 위한 금융 시그널 값의 수학적 변형입니다.

Dynamic Flow M30 – Smart Trend & Signal System for MT4 Professional Trading Indicator for the 30-Minute Timeframe Dynamic Flow M30 is a powerful MetaTrader 4 indicator specifically optimized for the M30 (30-minute) timeframe , designed to help traders identify trend direction, momentum shifts, and potential entry opportunities with precision and clarity. Built using a combination of adaptive volatility bands and EMA-based market flow analysis, this indicator automatically adjusts to changi

Reversal Identifier MT5 - 차트에서 반전 지점을 찾아주는 지표입니다.
차트를 다시 그리거나 지연 없이 작동하며, 프랙탈 형태의 고점과 저점을 식별하고 화살표로 반전 지점을 표시합니다.
이 지표는 추세 방향의 조정이나 변화가 발생하는 초기 반전 지점을 식별합니다.
이 지표를 가장 효과적으로 사용하는 방법은 두 개의 시간 프레임을 활용하는 것입니다. 높은 시간 프레임에서는 추세를 파악하고 낮은 시간 프레임에서는 진입 신호를 수신합니다.
이 지표는 단독으로 사용하거나 다른 지표 또는 거래 시스템과 함께 사용할 수 있습니다.
"Filter level" 은 화살표 표시 빈도를 조절하는 매개변수입니다. 값은 1 에서 5 까지입니다. 이 매개변수를 통해 화살표 빈도를 제어하여 위험과 기회를 조절할 수 있습니다.
모든 금융 상품에 사용할 수 있도록 설정되어 있습니다. 적합한 시간 프레임은 M5, M15, M30, H1, H4입니다. 파란색 화살표는 하락 반전을, 주황색

MT4용 Crypto_Forex 지표 "RVI 속도", 리페인트 없음. - 이 지표는 물리학 방정식을 기반으로 계산됩니다. RVI 속도는 RVI 자체의 1차 미분값입니다. - Relative_Vigor_Index(RVI) 자체는 추세 시장에서 매우 유용한 기술적 모멘텀 지표입니다. - RVI 속도는 가격 조정 후 주요 추세 방향으로 모멘텀 진입에 유용합니다. - 표준 EMA(그림 참조)와 같은 적절한 추세 지표와 함께 사용하십시오. - RVI 속도 지표는 RVI 자체의 방향이 얼마나 빨리 변하는지를 보여주며 매우 민감합니다. - RVI 속도 지표의 값이 0보다 작으면 속도는 음수이고, 0보다 크면 속도는 양수입니다. - 이 지표에는 모바일 및 PC 알림 기능이 내장되어 있습니다. 여기를 클릭하여 고품질 트레이딩 로봇과 지표를 확인하세요! MQL5 웹사이트에서만 제공되는 정품 제품입니다.

MT4용 Crypto_Forex 지표 "더블 슈팅 스타 패턴", 리페인트 및 지연 없음. - "더블 슈팅 스타 패턴" 지표는 가격 변동 거래에 매우 강력한 지표입니다. - 이 지표는 드물지만 효과적인 패턴, 즉 차트에서 하락세 더블 슈팅 스타를 감지합니다. - 하락세 더블 슈팅 스타 패턴 - 차트에서 빨간색 화살표 신호(그림 참조). - PC 및 모바일 알림 기능이 내장되어 있습니다. - "더블 슈팅 스타 패턴" 지표는 지지/저항선과 함께 사용하기에 매우 좋습니다. ........................................................................... 여기를 클릭하여 고품질 트레이딩 로봇과 지표를 확인하세요! 이 제품은 MQL5 웹사이트에서만 제공되는 오리지널 상품입니다.

Heiken Ashi Trend is a MetaTrader 4 indicator designed to help traders identify trend direction using Heiken Ashi candle structure combined with trend-confirmation filters. The indicator displays bullish and bearish trend phases directly on the chart, helping traders follow market direction more clearly and avoid unnecessary noise during fast price movement. Main Features Heiken Ashi based trend visualization Smooth trend-following structure Optional EMA line display ADX, CCI and MACD confirmati

Nested Pivot Arrows NR Nested Pivot Arrows NR is a non-repaint MT4 and MT5 indicator that identifies nested pivot structures and highlights potential market turning points directly on the chart. The indicator automatically detects: • Short-Term Highs (STH) and Short-Term Lows (STL)
• Medium-Term Highs (MTH) and Medium-Term Lows (MTL)
• Long-Term Highs (LTH) and Long-Term Lows (LTL)
• Buy and Sell signals based on confirmed nested pivot formations Features: Non-Repaint Logic
MT4 & MT5 Version

Daily End Potential (DEP) v1.26은 MetaTrader 4용 기술 지표로, 지정된 시간 창에서 가격 범위를 분석하고 거래일 종료까지 가격이 위 또는 아래로 움직일 확률을 계산합니다. 지표의 목적 이 지표는 주요 가격 범위가 형성된 후 트레이더가 장중 움직임의 가장 가능성 높은 방향을 결정하는 데 도움을 줍니다. 가격이 범위의 상단 경계에 가까우면 하락 움직임의 잠재력이 더 크고, 그 반대도 마찬가지입니다. 이 지표는 이 잠재력을 백분율로 계산하고 확률이 지정된 임계값을 초과하면 신호를 발행합니다. 신호는 차트에 화살표로 표시되며 확률 백분율을 보여주는 텍스트 레이블이 함께 표시됩니다. 작동 방식 트레이더가 PC 현지 시간으로 시간 간격(예: 10:00~11:00)을 설정하면, 이 시간 동안 가격 범위가 형성됩니다. 지표는 현지 시간을 브로커의 서버 시간과 자동으로 동기화합니다. 분석 창이 닫힌 후, 지표는 종가가 범위 경계를 기준으로 어디에 위치하는지 결정합니

Most indicators never ask the most important question: is there actually a cycle running right now? Prisma asks it on every bar. When the answer is no, it stays silent. When the answer is yes, it tells you exactly where inside that cycle price currently sits — and signals the crossover at the right moment. The result is an oscillator that filters out the noise that destroys most fixed-period indicators, and fires only when three independent scientific systems agree. Three Scientific Layers 1. Eh

New York AM Session Profile
NY AM Session Profiling Framework | Non-Repainting | Real-Time | FX & Index Presets | MT5 Version Available
Full Setup Guide & Strategy Playbook: https://www.mql5.com/en/blogs/post/771380
MT5 Version: https://www.mql5.com/en/market/product/180798
Indicator Overview The New York AM Session Profile framework is a professional market-structure visualization tool designed for traders who study liquidity, session behaviour, and institutional price delivery. Instead

"다이내믹 트렌드 오실레이터"는 MT4를 위한 고급 맞춤형 암호화폐/외환 지표이자 효율적인 거래 도구입니다! - 차세대 오실레이터 - 사용 방법은 그림을 참조하세요. - 다이내믹 트렌드 오실레이터는 적응형 과매도/과매수 영역을 제공합니다. - 이 오실레이터는 동적인 과매도/과매수 영역에서 주요 추세 방향으로 정확한 진입 시점을 찾는 보조 도구입니다. - 과매도 값: 녹색선 아래, 과매수 값: 파란색선 위. - 다이내믹 트렌드 오실레이터를 적합한 추세 지표와 함께 사용하세요. - 이 지표는 가격 변동 패턴과도 결합하기 좋습니다. - 표준 오실레이터보다 훨씬 정확합니다. - PC 및 모바일 알림 기능 제공. 여기를 클릭하여 고품질 트레이딩 로봇과 지표를 확인하세요! MQL5 웹사이트에서만 제공되는 정품 제품입니다.

Volume Arrow Signal Product Description Volume Arrow Signal is a smart trading indicator designed to help traders identify potential buy and sell opportunities using price action, volume behavior, and directional arrow signals. The indicator places clear arrows directly on the chart, making it easy to spot possible market reversals, trend continuations, and entry opportunities without spending hours analyzing charts manually. Whether you are trading Gold (XAUUSD) , Forex pairs, Indices, or Crypt

SMC Price Action Pro is a visual Smart Money Concepts indicator for MetaTrader 4.
It is designed for traders who analyze market structure, liquidity, order blocks, fair value gaps, equal highs and lows, previous high and low levels, premium and discount zones, and retracement areas directly on the chart.
This indicator does not open, modify, or close trades. It does not use automated order execution. It is a manual chart analysis tool created to support the trader’s own decision-making proces

BAND REVERSAL ZONES è un indicatore pensato per aiutare il trader a riconoscere con maggiore immediatezza le fasi in cui il prezzo si spinge troppo lontano dalla propria area di equilibrio. Grazie a una struttura composta da linea centrale dinamica e bande adattive, consente di leggere visivamente le condizioni di eccesso del mercato e di individuare con più chiarezza possibili momenti di rallentamento o perdita di forza del movimento in corso.
L’indicatore è progettato per poter essere utiliz

BK-GTA 基于匿名化、聚合化数据产出研究文章、训练方法、行为洞察;其 的核心资产不是“结果数字”,而是人在受控环境中的决策过程数据。它让训练、复盘、研究和系统优化变得可记录、可比较、可迭代; 同一类场景可以被多次运行、对比和复盘,减少真实环境中不可控因素对研究结果的干扰; 通过规则、限制、冷静期和任务边界,帮助用户在可控环境中练习纪律; 记录决策路径、反应时间、执行偏差和稳定性指标,支持长期行为分析; 长期行为记录对系统一致性要求较高。云端环境主要用于提高运行稳定性、降低网络中断风险、保持环境一致、避免记录污染、支持长期连续训练; 风控系统属于训练辅助工具。可包括最大回撤限制、异常行为提醒、冷静期、强制限制机制;仅适用于模拟环境,不构成投资建议。

MGH-MultiStoch — Multi-Timeframe Trend Detection and Wave Analysis MGH-MultiStoch is a multi-timeframe trend indicator that displays up to 6 timeframes simultaneously in one window. It helps traders confirm trend direction across timeframes, count market waves visually, and build forward-looking wave scenarios based on higher-timeframe crosses. The indicator uses a custom multi-timeframe calculation method developed specifically for this product. It is available for both MetaTrader 4 and MetaTra

Project profits with precision. Equity Master Projection is a comprehensive trade management and analytics dashboard that goes beyond simple equity tracking. It analyzes both open positions and historical trades across multiple symbols and magic numbers, applying powerful filters to isolate your best-performing strategies. With unique features like a "Cut Mode" for profit capping and dynamic HTML/CSV reporting with equity curve charts, this tool transforms raw trading data into a clear, actiona

Have patterns that drive your trading success or failure. The Equity Performance Analyzer breaks down your trade history by symbol, day of the week, and hour of entry to identify exactly when your strategies perform best and worst. It ranks every possible trading pattern (e.g., "EURUSD-BUY-Mon-14") by Net Profit, Win Rate, Return/Drawdown, and a Monte Carlo Proxy. More than just an analytics tool, it generates ready-to-use input parameters for your EAs and a crucial "Worst Patterns to Avoid" se

Ensure your trading strategy's future performance by trading only on stable, reliable pairs. The Pair Stability Indicator analyzes the velocity and volatility of any symbol to determine if it can support consistent strategy execution. It calculates critical metrics like Pips per Second, Dollars per Pip, and Dollars per Second of movement, scoring each pair from 0-100%. By identifying highly stable instruments (e.g., EURUSD) and flagging unstable ones (e.g., XAGAUD), this indicator acts as a cru

Turn market pullbacks into profitable recovery trades with the PullBack Velocity Indicator. This tool identifies when a currency pair is in a pullback phase and calculates its velocity to project potential recovery profits. By analyzing the depth and duration of a pullback against the pair's current momentum, the indicator provides a clear "Expected Profit" in pips and dollars, along with an estimated recovery time. It actively alerts you to "HIGH POTENTIAL RECOVERY" scenarios, giving you a qua

Speed Trade Master filters your trade history and open positions to find only the fastest, most efficient trades—winners that hit profit targets quickly and losers that are cut short with minimal drawdown. By applying strict filters for Max MAE ($ and time) and Max MFE (time), it isolates "Lightning Trades." The tool then projects future performance and analyzes weekly patterns, providing a free, essential dashboard for any trader looking to optimize for speed and efficiency.
Key Features: Tri

Peak Pips MT4 Zero-Repainting Trend Signals, Peak-Pips Tracking and Multi-Timeframe Scanning Peak Pips MT4 is a powerful trend-analysis indicator designed to help traders identify fresh BUY and SELL opportunities for scalping, intraday and swing trading, all from one chart. Backed by 23 years of testing with Dukascopy 100% tick data, the indicator combines a protected signal algorithm, confirmed zero-repainting signals, live peak-pips tracking and a built-in multi-timeframe scanner in one trader

Release Price is a highly discounted SALE Price! Price will increase after first 50 sales
Read detailed post with screenshots here: https://www.mql5.com/en/blogs/post/771350
Features (What the indicator does for you) Detects both bullish and bearish Cups: Finds the classic “cup‑and‑handle” and its upside‑down version. Mathematical cup shape: Uses quadratic regression to make sure the cup looks like a smooth “U” rather than a jagged “V”. Two entry line options: Horizontal resistance line or a

MT4용 Crypto_Forex 지표 "MACD with Trend ZigZag Pro" - MACD 지표 자체는 추세 거래에서 가장 널리 사용되는 도구 중 하나입니다. - "MACD with Trend ZigZag Pro"는 가격 움직임 진입 시 또는 다른 지표와 함께 사용하기에 매우 유용합니다. - 이 지표를 사용하여 가장 정확한 진입 신호를 선택하세요. - MACD가 0(녹색)보다 높고 지그재그 선이 상승하는 경우 - 매수 가격 움직임 패턴만 검색하세요. - MACD가 0(분홍색)보다 낮고 지그재그 선이 하락하는 경우 - 매도 가격 움직임 패턴만 검색하세요. - 모바일 및 PC 알림 기능이 내장되어 있습니다. - 지표에 정보 스프레드 스왑 표시 기능이 있어 해당 지표가 연결된 외환 통화쌍의 현재 스프레드와 스왑을 표시합니다. - 계좌 잔액, 자본금, 증거금도 표시됩니다. - Info Spread Swap Display는 차트의 어느 모서리에서나 찾을 수 있습니다. 여기를 클릭

MT4용 Crypto_Forex 지표 가속 막대 - 큰 추세를 포착할 수 있습니다. - 지표 "가속 막대"는 추세 거래에 매우 강력한 도구입니다. 시장 변동의 영향을 최소화합니다. - 상승 가속 막대(파란색)는 차트에서 이전 5개 봉의 최고값보다 높고, 다음 5개 봉의 최저값보다 낮은 막대입니다. - 하락 가속 막대(빨간색)는 차트에서 이전 5개 봉의 최저값보다 낮고, 다음 5개 봉의 최고값보다 높은 막대입니다. - PC, 모바일 및 이메일 알림 기능 제공. 추세 거래: - 매수 신호 - 차트에 4개의 상승 가속 막대가 연속으로 나타날 때. - 매도 신호 - 차트에 4개의 하락 가속 막대가 연속으로 나타날 때. 여기를 클릭하여 고품질 트레이딩 로봇과 지표를 확인하세요! 본 제품은 MQL5 웹사이트에서만 제공되는 정품입니다.

Tired of cluttered charts and moving averages that lag or change every time you switch timeframes? It is time to trade like the institutions. VWAP MT4 Clean Version brings you the ultimate Volume Weighted Average Price indicator, stripped of distracting bands to give you a crystal-clear view of the true market bias. VWAP is the exact tool used by "Big Boys" and institutional traders to detect heavy volume and market equilibrium. Why Choose VWAP Clean Version? 100% Non-Repaint & Multi-Timeframe C

MT4용 Crypto_Forex 지표 HTF MFI 오실레이터 - 자금흐름지수(MFI)는 가격과 거래량 데이터를 사용하여 과매도 및 과매수 구간을 식별하는 기술적 오실레이터입니다. - HTF는 상위 시간대를 의미합니다. 과매수(MFI가 80 이상)는 MFI가 20 미만일 때, 과매도(MFI가 20 미만)는 MFI가 과매도임을 의미합니다. - MFI는 가격 움직임 신호와 결합하면 효과적입니다. 강세 및 약세 가격 모멘텀에 대한 정보를 제공합니다. - 이 지표는 다른 지표와 함께 다중 시간대 거래 시스템에 매우 적합합니다. - HTF MFI 지표를 사용하면 상위 시간대의 MFI를 현재 차트에 추가할 수 있습니다. - 지표에는 모바일 및 PC 알림 기능이 내장되어 있습니다. 여기를 클릭하여 고품질 트레이딩 로봇과 지표를 확인하세요! 이 제품은 MQL5 웹사이트에서만 제공되는 오리지널 제품입니다.

PinMetrics Size Statistics Dashboard | Wick Ratio Analysis | Performance Metrics Stop guessing which pin bars work. Let the data reveal the edge. Overview PinMetrics is a professional MetaTrader 4 indicator that automatically detects and analyzes pin bar patterns, categorizing them by wick-to-body ratio. It provides comprehensive performance statistics for each size category, helping traders identify which pin bar patterns offer the most reliable trading opportunities. Not all pin bars are cre
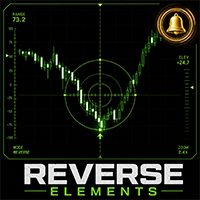
Reverse Elements - Formatted Description Reverse Elements Reverse Elements is a signal-based indicator designed to help identify potential market reversal points directly on the chart. Using a proprietary calculation method, the indicator displays buy and sell signals with arrows. It is built to support discretionary trading by making potential entry areas easier to recognize visually. This is not an Expert Advisor and does not place trades automatically. Main Features Buy and sell arrows displa

Gold is now highly volatile, with swings of 100 dollars happening frequently. That's why traditional long-term trading no longer fits—short-term trading is the way to go. My technical indicator is designed for MT4 short-term trading, specifically for the 1-minute gold chart. You can download it and check it out. Feel free to reach out if you have any questions. The first 10 copies are offered at a relatively low price, and the price will go up afterwards.

MT4용 암호화폐 외환 지표 "Major_Trend_Correction Histogram" (리페인트 없음) - Major_Trend_Correction Histogram 지표는 큰 추세를 감지하도록 설계되었습니다. - 지표는 두 가지 색상으로 표시됩니다. 빨간색은 하락 추세, 파란색은 상승 추세를 나타냅니다 (설정에서 색상 변경 가능). - 히스토그램의 10개 이상의 연속된 동일한 색상의 막대가 나타나면 새로운 추세의 시작을 의미합니다. - 모바일 및 PC 알림 기능이 내장되어 있습니다. - "Period" 매개변수는 지표의 민감도를 조절합니다. 매수 거래 시: 1) 히스토그램에서 10개 이상의 연속된 파란색 막대가 나타나는지 확인합니다. 이는 새로운 상승 추세의 시작을 의미합니다. 2) 그 후 1~2개의 반대되는 빨간색 막대가 나타나고, 이어서 주요 추세의 파란색 막대가 다시 나타나면 상승 추세 조정입니다. 3) 조정 후 매수 거래를 시작할 수 있습니다. 매도 거래 시 유의사항

Delta VA Zones PRO — version 2.8
An indicator combining synthesis of the Volume Profile, Delta analysis, and impulse filters for intraday trading.
Concept
Delta VA Zones PRO unites four analytical methods into a single system with objective entry criteria:
Volume Profile — automatic construction of POC (Point of Control), VAH (Value Area High), VAL (Value Area Low) levels based on real volume. Delta analysis — assessment of the imbalance between aggressive buys (market buy) and sells (marke

This powerful indicator displays the ATR (Average True Range) value directly on your chart in points, eliminating the need for a separate oscillator window. Simply select your preferred ATR period and instantly monitor market volatility in real time. The displayed value automatically updates according to the currently selected timeframe, providing fast and accurate volatility information exactly when you need it. Lightweight, user-friendly, and highly practical, it's the perfect tool for traders

Dynamic Trend Moving Average is an intelligent moving average indicator designed to help traders instantly identify the current market trend through a simple and intuitive color-coding system. Unlike traditional moving averages, this indicator automatically changes color according to market conditions: Green – Bullish trend detected
Red – Bearish trend detected
Yellow – Neutral market or transition phase This visual approach allows traders to quickly assess market direction without havi

Stop wasting time calculating your Stop Loss and Take Profit levels manually! ATR SL/TP Calculator is a powerful MT4 indicator designed to display in real time the current ATR value, as well as the corresponding Stop Loss and Take Profit distances directly on your chart, in points. Whether you use volatility-based risk management or ATR multiples in your trading strategy, this indicator instantly performs all calculations for you and updates them automatically according to the currently selecte

50% OFF for the First 50 Users 1. Overview ? ICT IFVG All-Currency Scanner Detects IFVG (Inverse Fair Value Gap) signals across all currency pairs simultaneously. An IFVG occurs when a candle body fully breaks through a prior Fair Value Gap in the OPPOSITE direction ? a key ICT concept indicating a potential institutional reversal. IFVG 448 Scanner Guide is Here
BUY signal : Bear FVG is broken upward → price likely to rise SELL signal : Bull FVG is broken downward → price likely to

SMC Structure Gap Monitor Pro 이 MetaTrader 4 인디케이터는 보다 완성도 높은 SMC 스타일 구조 분석 워크플로를 원하는 트레이더를 위해 설계되었습니다. 핵심 초점은 구조적 돌파, 인듀스먼트 흐름, 미체결 및 일부 체결된 Fair Value Gap, 유동성 스윕, 그리고 모멘텀 컨텍스트에 있습니다. 핵심 아이디어: 단순히 구조 라벨만 따로 보여주는 것이 아니라, 가격이 어떻게 압력을 쌓고 있는지, 인듀스먼트가 어디에서 형성되는지, 언제 스윕이 발생하는지, 그리고 그 주변에서 모멘텀이 어떻게 확장되거나 약해지는지를 읽을 수 있도록 돕는 데 목적이 있습니다. 출시 가격: 이 제품은 프로모션 출시 가격으로 제공됩니다. 가격은 향후 업데이트에서 조정될 수 있습니다. 빠른 요약 제품 유형 MetaTrader 4 인디케이터 주요 초점 구조 흐름, 인듀스먼트, Fair Value Gap, 스윕, 모멘텀 컨텍스트 사용 스타일 재량 차트 분석, 리뷰, EA 지향 버

Master Precision Trading with the ICT Macros Time Window Indicator (ICT 매크로 타임 윈도우 지표로 마스터하는 정밀 트레이딩) 금융 시장에서 타이밍은 궁극의 우위입니다. 이너 서클 트레이더(ICT) 방법론을 따르는 트레이더에게 알고리즘이 언제 가격을 움직일지 정확히 아는 것은 가격이 어디로 갈지 아는 것보다 훨씬 중요합니다. ICT Macros Time Window Indicator 는 차트에서 직접 이러한 알고리즘 시간 세그먼트를 추적할 수 있는 필수 도구입니다. 이 도구는 테이프 리딩(Tape Reading, 호가창 및 가격 흐름 세부 분석) 을 마스터하고 폭발적인 알고리즘 시장 움직임이 일어나기 전에 포착하고자 하는 데이트레이더를 위해 특별히 제작되었습니다. ICT Macros Time Window Indicator 사용 방법 이 지표는 런던 및 뉴욕 거래 세션 전반에 걸쳐 특정 매크로 주기를 자동으로 하이라이트합니다. 이

SUPER HERO Signals 는 MeanFX가 개발한 새로운 트레이딩 지표입니다. 정밀한 매매 신호와 적응형 TP/SL(익절/손절) 레벨을 결합하여 통계적으로 우수한 거래 기회를 제공합니다. 가격은 5건의 구매가 이루어질 때마다 인상됩니다. 다음 가격은 50달러 입니다. 구매 전에 메시지를 보내주시면 실시간 차트 미리보기와 최신 거래 통계 자료를 제공해 드립니다. 이를 통해 보다 현명한 결정을 내리고 거래 성과를 향상시키는 데 도움이 될 것입니다. SUPER HERO Signals의 주요 특징 M15 골드(XAUUSD) 시장에서 검증된 통계적 성과.
(여러 시장과 시간대를 동시에 공략하기보다 하나의 타임프레임을 완벽하게 마스터하는 데 집중합니다.) 하루 1~3회의 거래 기회 제공, 높은 승률과 통계적 우위를 확보. 차트에는 검증된 BUY(매수) 및 SELL(매도) 신호만 표시. 각 거래마다 시장 상황에 맞춰 TP(익절) 및 SL(손절) 레벨을 자동 생성. 평균 승률 75%

런던 풀백 트레이딩 시스템 (London Pullback Trading System) 개요 런던 풀백 트레이딩 시스템은 세션 기반 전문 트레이딩 인디케이터로, 시장 구조의 핵심 레벨을 식별하고 런던 세션의 가격 움직임을 추적하며, 이동평균선과 런던 존의 컨플루언스를 활용해 고확률 풀백 진입 기회를 찾도록 설계되었습니다. 이 인디케이터는 각 세션의 고점과 저점을 자동으로 표시하고, 동적 런던 트레이딩 존을 보여주며, 현재 거래일에만 표시되는 이동평균선을 제공합니다. 특히 런던 세션에 집중하고 브레이크아웃 추격이 아닌 풀백 진입을 선호하는 트레이더에게 최적화되어 있습니다. 기능 세션 범위 감지 인디케이터는 다음 주요 세션을 식별하고 표시합니다: 아시아 세션 런던 세션 뉴욕 세션 사용자는 세션 표시 모드를 통해 원하는 세션만 선택할 수 있습니다. 세션 고가 / 저가 선택된 각 세션에 대해 자동으로 다음을 표시합니다: 세션 고가 라인 세션 저가 라인 이 레벨은 하루 동안 연장되어 지지, 저

Vortex Level System – Your Intelligent Compass in the Trading World Say goodbye to visual clutter and welcome mathematical precision and real-time analysis. Do you find yourself overwhelmed daily by excessive indicators and conflicting signals? Are you tired of manually drawing levels and waiting for opportunities that rarely materialize? We developed the Vortex Level System not just as another indicator, but as a comprehensive "Trading Assistant." It acts as a live roadmap, displayed clearly on

HigherTF Background Candle draws higher timeframe candlesticks directly on your chart background, giving you instant multi-timeframe context without switching charts.
KEY FEATURES
- Background HTF Candles: Renders Open/High/Low/Close of any higher timeframe as colored rectangles behind your price action. - Instant TF Switching: Press keys 1-9 to switch between M1, M5, M15, M30, H1, H4, D1, W1, MN1. Press 0 to hide. - Auto-Promotion: If the selected TF is equal to or lower than the cha

MT4용 Crypto_Forex 지표 "동적 경계를 갖춘 이동 평균" - 이 지표는 이동 평균과 동적 변동성 경계에 대한 고유한 기능을 제공합니다. - 동적 변동성 경계는 평균 참값(ATR)을 사용하여 계산합니다. - 이 지표는 이익실현(TakeProfit) 목표가 설정 및 경계선에서의 손절매(SL) 설정에 매우 유용합니다. - 가격 움직임 신호와도 결합하기 좋습니다. .......................................................................... 여기를 클릭하여 고품질 트레이딩 로봇과 지표를 확인하세요! MQL5 웹사이트에서만 제공되는 오리지널 제품입니다. ..........................................................................

Quarterly Theory Indicator: A Comprehensive Guide for SMC and ICT Traders (분기 이론 지표: SMC 및 ICT 트레이더를 위한 종합 가이드) Quarterly Theory 지표 는 MetaTrader 플랫폼을 위해 설계된 고급 시간 기반 분석 도구입니다. 스마트 머니 컨셉(Smart Money Concepts) 과 인너 서클 트레이더(Inner Circle Trader) 방법론의 핵심 원칙에 뿌리를 둔 이 지표는 금융 시장에서 시간과 가격 전달의 프랙탈 성격을 시각화합니다. 이 지표는 시장이 무작위로 움직이지 않고 엄격한 기계적 시간 주기를 따른다는 알고리즘적 전제하에 작동합니다. 주요 타임프레임을 분기(Quarter)라고 알려진 4개의 동일한 부분으로 나눕니다. 색상으로 구분된 하위 창에 이러한 분기를 플롯함으로써 이 지표는 AMDX 주기 (Accumulation: 축적, Manipulation: 조작, Distributi

KT ICT Kill Zones Indicator 는 아시아, 런던, 뉴욕 킬존(Kill Zone)을 정확한 뉴욕 시간 기준으로 매일 자동 표시합니다. 세션 고점과 저점, 유동성 스윕(Liquidity Sweep), Midnight Open, True Day Open은 물론, 각 세션이 현재 거래 중인 종목에서 실제로 어떻게 움직이는지 보여주는 통계 패널까지 제공합니다. 이제 매일 아침 직접 박스를 그리거나 시간대 변환이 맞는지 확인할 필요가 없습니다. 브로커 서버 시간 오프셋을 한 번만 설정하면 이후에는 네 개의 Kill Zone이 자동으로 정확한 뉴욕 시간에 맞춰 표시되며, 서머타임(DST)도 자동으로 반영됩니다. 표시되는 내용
네 개의 Kill Zone이 색상 박스로 표시되며, 각 세션 동안 실제로 형성된 최고가와 최저가에 맞춰 자동으로 크기가 조정됩니다. 대상 세션은 Asian(20:00~00:00), London Open(02:00~05:00), New York AM(08

ICT Kill Zones marks the four main intraday sessions on your chart and the high and low of each session. It is an analytical tool for traders who follow the ICT and Smart Money approach. It does not place orders and does not give automatic buy or sell signals. It shows when the active sessions occur and where session liquidity rests, so you can make your own trading decisions. Session high and low levels and sweep events are confirmed on closed candles only. Past levels are not redrawn. The M

Crypto_Forex 지표 "역망치형 및 슈팅스타 패턴" MT4용, 리페인트 및 지연 없음. - "역망치형 및 슈팅스타 패턴" 지표는 가격 변동 거래에 매우 강력한 지표입니다. - 이 지표는 차트에서 강세 역망치형 및 약세 슈팅스타 패턴을 감지합니다. - 강세 역망치형 - 차트에 파란색 화살표 신호(그림 참조). - 약세 슈팅스타형 - 차트에 빨간색 화살표 신호(그림 참조). - PC, 모바일 및 이메일 알림 기능 제공. - "역망치형 및 슈팅스타" 지표는 지지/저항선과 함께 사용하기에 매우 좋습니다. ................................................................................................. 여기를 클릭하여 고품질 트레이딩 로봇과 지표를 확인하세요! 이 제품은 MQL5 웹사이트에서만 제공되는 오리지널 상품입니다.

KT VWAP with Standard Deviation Bands 는 기간별로 리셋되는 VWAP 라인을 표시하고, 그 주변에 최대 3쌍의 거래량 가중 표준편차 밴드를 함께 그려줍니다. 현재 시장의 공정 가치가 어디에 위치하는지, 가격이 그 가치에서 얼마나 멀리 이탈했는지, 그리고 과도하게 확장된 움직임이 실제로 평균 회귀를 시작했는지를 확인할 수 있습니다. 가격이 너무 높거나 낮은지를 감으로 판단하는 대신, 시장의 가격과 거래량 데이터를 기반으로 계산된 통계적 기준점을 활용할 수 있습니다. 대부분의 무료 VWAP 도구는 단순히 하나의 VWAP 선만 제공합니다. 하지만 이 지표는 평균값뿐만 아니라 평균 주변의 분산 범위와, 가격이 실제로 반전 신호를 확인한 후에만 알림을 발생시키는 확인 기반 알림 시스템까지 제공합니다. 고정 폭 채널이 아닌 거래량 가중 표준편차 밴드
각 밴드는 VWAP를 중심으로 계산된 실제 거래량 가중 표준편차를 기반으로 생성됩니다. 따라서 시장 상황에 따라 밴

"다이내믹 플로우 오실레이터"는 MT4를 위한 고급 맞춤형 암호화폐/외환 지표이자 효율적인 트레이딩 도구입니다! - 차세대 오실레이터 - 사용 방법은 그림을 참조하세요. - 다이내믹 플로우 오실레이터는 적응형 과매도/과매수 영역을 제공합니다. - 지표는 가격 및 거래량 데이터를 사용하여 과매도 및 과매수 영역을 식별합니다. - 오실레이터는 과매도/과매수 영역에서 정확한 진입 시점을 찾는 보조 도구입니다. - 과매도 값: 녹색선 아래, 과매수 값: 빨간색선 위. - 일반 오실레이터보다 훨씬 정확합니다. - PC 및 모바일 알림 기능 제공. 여기를 클릭하여 고품질 트레이딩 로봇과 지표를 확인하세요! MQL5 웹사이트에서만 제공되는 오리지널 제품입니다. .................................................................

MQL5 블로그: https://www.mql5.com/en/blogs/post/771791 MT4 버전: https://www.mql5.com/en/market/product/182305 MT5 버전: https://www.mql5.com/en/market/product/182306
WAVE FIBONACCI [tambangEA]는 차트에서 직접 상승 및 하락 가격 전망을 읽고자 하는 트레이더를 위해 설계된 전문적인 시장 구조 및 피보나치 파동 분석 지표입니다.
이 지표는 파동 구조, 피보나치 투영 영역, 목표 레벨, 스윙 포인트, 그리고 여러 종목을 탐색할 수 있는 실용적인 대시보드 패널을 결합합니다. 트레이더가 모든 레벨을 수동으로 그리지 않고도 잠재적인 반등 영역, 추세 지속 목표, 그리고 가격 구조 방향을 파악할 수 있도록 설계되었습니다.
이것은 시각적 분석 도구이며, Expert Advisor(EA)가 아닙니다. 거래를 자동으로 시작, 종료 또는 수정하지 않습니다.

MT4용 Crypto_Forex 지표 "CCI 및 2개 이동 평균", 리페인트 없음. - 상품채널지수(CCI)는 추세 방향으로의 모멘텀 트레이딩에 매우 효과적입니다. - "CCI 및 2개 이동평균" 지표는 CCI 지표의 빠른 이동평균과 느린 이동평균을 함께 보여줍니다. - 상승 추세: 빠른 이동평균이 느린 이동평균 위에 위치; 하락 추세: 빠른 이동평균이 느린 이동평균 아래에 위치. - CCI는 현재 가격과 과거 평균 가격의 차이를 측정하는 가장 인기 있는 트레이딩 오실레이터 중 하나입니다. - 지표의 주요 레벨: +/-200 - 진입/청산 옵션: CCI 반등 훅이 형성되면 50에서 -50 사이의 중심 영역에서 추세 방향으로 진입하고, 지표가 각각 200/-200 영역에 도달하면 청산합니다. - PC 및 모바일에서 이동평균 교차 알림을 제공합니다. - 이 지표는 추세 변화를 매우 빠르게 감지할 수 있도록 도와줍니다. 여기를 클릭하여 고품질 트레이딩 로봇과 지표를 확인하세요! MQL

Order Block Pro — Institutional Order Blocks with Entry, SL & 3 Take-Profits (ICT / SMC)
See where smart money entered and trade the retest with a complete Entry, Stop-Loss and TP1/TP2/TP3 plan — automatically, on closed candles only. Non-repaint. FULL DESCRIPTION Order Block Pro maps the institutional Order Blocks that drive price in the ICT / Smart Money Concepts framework and turns every valid one into a clean, ready-to-trade plan. No more guessing where to draw your zones: it finds the last

Best of the Best!
Enter/Exit Indicator This indicator provides clear BUY and SELL entry signals to help identify potential trading opportunities. Simply enter trades when a signal appears and manage your risk accordingly. Watch the included video for free tips and guidance on how to use the indicator effectively. Optimized for Gold (XAUUSD) , but settings can be adjusted to suit other markets and trading styles. If you have any questions, feel free to send a message. Please leave positive fee

MT4용 외환 지표 "가격 범위 레벨 프로" - "가격 범위 레벨 프로" 지표는 매우 유용한 전문 보조 거래 도구입니다. - 가격(가격 범위 레벨)을 통해 도달 가능한 가장 가능성 있는 일별, 주별, 월별 수준을 보여줍니다. - 일별 범위는 당일 거래자에게 유용합니다. - 주별 및 월별 범위는 스윙 및 장기 거래자에게 유용합니다. - 이 지표는 이익실현 목표가를 계획하거나 손절매를 설정하는 데 매우 유용합니다. - 정보 표시 기능 - 해당 통화쌍의 현재 스프레드와 스왑을 표시합니다. - 계좌 잔액, 자본금, 증거금도 표시됩니다. - 정보 스프레드 스왑 표시는 차트의 어느 모서리에서나 찾을 수 있습니다. 여기를 클릭하여 고품질 트레이딩 로봇과 지표를 확인하세요! 본 제품은 MQL5 웹사이트에서만 제공되는 정품입니다.

AZ AI Core Pro Indicator Overview AZ AI Core Pro Indicator is a smart trading analysis tool designed to help traders identify potential market opportunities through trend analysis, multi-timeframe confirmation, support and resistance zones, AI-based filtering, and early signal detection. The indicator combines multiple analytical layers into a single visual system, allowing traders to identify BUY and SELL opportunities with greater confidence while reducing unnecessary market noise. Suitable fo

UT Dual-Engine Horizon UT Dual-Engine Horizon 은 MetaTrader 4 플랫폼을 위해 독점 개발된 고급 다층형 트렌드 추종 및 모멘텀 체결 시스템입니다. 시장의 구조 분석과 구체적인 진입 체결을 완전히 분리하는 현대 퀀트 트레이딩 전략에서 영감을 받았으며, 사용자가 직접 설정 가능한 거시 트렌드 필터(환경 분석)와 함께 두 개의 완전히 독립적인 ATR(Average True Range) 계산 엔진을 동시에 구동 합니다. 이러한 핵심 컴포넌트들을 하나의 통일된 로지크 계층으로 통합함으로써, 본 시스템은 시장의 노이즈를 효과적으로 제거하고 역추세 매매를 엄격히 제한하며, 모든 시간봉에서 신뢰도가 높은 알고리즘적 진입 포인트를 분리·특정해 냅니다. 핵심 아키텍처 및 구동 메커니즘 1. 엔진 1: 호라이즌 앵커 (The Horizon Anchor) 엔진 1은 시장의 전반적인 구조적 방향(환경 인식)을 확립합니다. 거시 변동성 추적 엔진으로 작동하며, 중

FX FVG iFVG Signal MT4는 Fair Value Gap과 Inversion Fair Value Gap 개념을 사용하는 Forex 트레이더를 위한 MetaTrader 4 차트 인디케이터입니다. 이 인디케이터는 강세 FVG, 약세 FVG, 강세 iFVG, 약세 iFVG 영역을 차트에 자동으로 표시합니다. 가격이 iFVG 영역으로 되돌아오고 캔들 확인 조건이 충족되면 BUY 또는 SELL 팝업 알림을 표시합니다. 주로 H1과 M30 차트에 적합합니다. H1은 큰 방향 확인에, M30은 되돌림과 진입 확인에 사용할 수 있습니다. 주요 기능: 3개 캔들 구조 기반 FVG 자동 감지 FVG 돌파 후 iFVG 자동 감지 강세 FVG 및 약세 FVG 영역 표시 강세 iFVG 및 약세 iFVG 영역 표시 영역 중간선 표시 BUY 및 SELL 팝업 알림 차트 신호 화살표 EA 연동용 숨김 버퍼 자동 주문 실행 없음 색상 설명: 연두색: 강세 FVG, 되돌림 시 지지 가능성 연한 빨간색:

The Liquidity Profiler Tools is indicator identifies major buy-side and sell-side liquidity levels and visualizes internal buyer/seller activity through volume delta-filled quadrants, providing a complete toolkit for analyzing liquidity sweeps and potential reversals. Detection The indicator utilizes a pivot-based detection system. When a swing high is confirmed, a Buy-Side Liquidity (BSL) zone is created; a swing low creates a Sell-Side Liquidity (SSL) zone. The script includes "Filter Overlaps

MT4용 암호화폐 외환 지표 "모닝스타 패턴". 리페인팅 없음, 지연 없음. - "모닝스타 패턴" 지표는 가격 움직임 거래에 매우 강력한 도구이며, 상승 추세 시장에 특히 효과적입니다. - 이 지표는 차트에서 상승 모닝스타 패턴을 감지합니다: 파란색 화살표 신호 (사진 참조). - PC 및 모바일 알림 기능을 제공합니다. - 하락 추세용 "이브닝스타 패턴" 지표도 이용 가능합니다 (아래 링크 참조). - "모닝스타 패턴" 지표는 지지/저항 수준과 함께 사용하면 더욱 효과적입니다. .............................................................................................. 여기를 클릭하여 고품질 트레이딩 로봇과 지표를 확인하세요! 본 제품은 MQL5 웹사이트에서만 독점적으로 제공되는 오리지널 제품입니다.

MQL5 블로그: https://www.mql5.com/en/blogs/post/771887 MT4 버전: https://www.mql5.com/en/market/product/182726 MT5 버전: https://www.mql5.com/en/market/product/182727
SMART STRUCTURE [tambangEA]는 트레이더가 가격 움직임을 더욱 명확하고 체계적이며 맥락에 맞게 해석할 수 있도록 설계된 전문적인 시장 구조 및 컨플루언스 지표입니다.
이 지표는 스마트 머니 개념, 구조 레이블, 반응 영역, 피보나치 되돌림 수준, SMI 모멘텀 확인, 세션 인식, 심볼 전환 버튼, 그리고 실용적인 대시보드를 하나의 깔끔한 시각적 트레이딩 도구에 통합했습니다.
시장 편향, 잠재적 추세 지속, 가능한 반전 영역, 그리고 높은 컨플루언스 반응 영역을 차트에서 직접 식별하고자 하는 트레이더를 위한 의사 결정 지원 지표로 개발되었습니다.
SMART STRUCTURE

QB Compass Signal Pro QB Compass Signal Pro is an advanced predictive market direction indicator for MetaTrader 4. It transforms multiple technical factors into a visual compass that helps traders identify potential BUY, SELL, EXTREME BUY, and EXTREME SELL zones before traditional trend-following indicators react. Unlike conventional indicators that only follow price, QB Compass Signal Pro combines momentum, volatility expansion, EMA angle analysis, RSI slope, fractal breakouts, and market struc

MGH-MagicLine — Trend & Multi-Timeframe Divergence in One Tool MagicLine combines trend detection and divergence analysis into a single indicator — a refined alternative to running MultiStoch and MultiMACD separately, with cleaner output and less lag. It is a confirmation and analysis tool . It does not give entry points, Take Profit or Stop Loss. Instead, it adds a strong, flexible confirmation layer that fits almost any trend-based strategy and helps you read the market with more clarity. Thre

THIS IS ONE OF THE INDICATORS USED IN THE ACTUAL EURUSD EA. THIS EA IS LARGELY EXPERIMENTAL AND WELL TESTED IN THE H1 CHART THROUGH LIVE TESTING.
TO USE THIS INDICATOR AS A STAND ALONE TOOL, YOU CAN DO SO IN SEVERAL WAYS SINCE THIS IS A VERSATILE INDICATOR WITH MANY DIFFERENT POSSIBLE SETUPS. GENERALLY, THE BLUE LINE INDICATES WHAT THE EXPECTED OVERALL TREND IS, BASED ON WHETHER IT STANDS ABOVE OR BELOW ZERO.
AS FAR AS THE NEXT PRICE CANDLE IS CONCERNED, THERE TWO MORE OBSERVATIONS YOU CAN DO

韩语版本 (Korean Version) JMA Multi Timeframe Indicator 는 추세 추종 및 스윙 트레이딩을 위해 설계된 MT4 플랫폼용 고급 기술 지표입니다. 클래식한 Jurik Moving Average (JMA) 알고리즘과 멀티 타임프레임 (MTF) 기술을 완벽하게 결합했습니다. JMA는 지연 시간이 극도로 짧고 매끄러움이 뛰어난 것으로 유명하여 트레이더가 추세 반전 지점을 정확하게 포착할 수 있도록 돕습니다. 본 지표는 현재 차트에 상위 시간대(예: H4, D1)의 JMA 라인을 직접 시각화하며, 횡보 장세에서 거짓 신호를 제거하기 위해 ATR (Average True Range) 기반의 동적 변동성 필터 메커니즘을 내장하고 있습니다. 핵심 장점: 멀티 타임프레임 지원 : 차트를 전환할 필요 없이 단일 차트에서 거시 추세를 모니터링합니다. 상위 주기로 방향을 잡고 하위 주기로 진입 시점을 선택할 수 있습니다. 직관적인 색상 제어 : 상승 추세는 '적

Reverse_Elements_AllSearch Reverse_Elements signals multi-symbol / multi-timeframe scanner for MetaTrader 4
---------------------------------------------------------------------- Important Requirement ---------------------------------------------------------------------- Reverse_Elements_AllSearch requires the main Reverse_Elements indicator. Reverse_Elements_AllSearch is not a standalone signal-generation indicator. It is a scanner that reads signals from the main Reverse_Elements indicator an

MT4용 암호화폐 외환 지표 "스캘핑 히스토그램 프로", 리페인트 없음. - 스캘핑 히스토그램 프로 지표는 소폭의 가격 조정 후 가격 모멘텀의 주요 방향으로 진입 신호를 찾는 데 사용할 수 있습니다. - 스캘핑 히스토그램 프로는 두 가지 색상으로 표시됩니다. 주황색은 하락 모멘텀, 녹색은 상승 모멘텀을 나타냅니다. - 히스토그램에서 같은 색상의 막대가 10개 이상 연속으로 나타나면 강한 모멘텀이 발생하고 있음을 의미합니다. - 진입 신호는 히스토그램에서 반대 색상의 막대와 초기 모멘텀 색상의 막대가 만나는 지점입니다(그림 참조). - 차트에서 가장 가까운 고가/저가를 스캘핑 목표로 사용하세요. - 모바일 및 PC 알림 기능이 내장되어 있습니다. - 지표에는 정보 표시 기능이 있어 해당 외환 쌍의 현재 스프레드와 스왑을 보여줍니다. - 계좌 잔액, 자산, 마진도 표시됩니다. - 스프레드 및 스왑 정보 표시는 차트의 어느 모서리에든 배치할 수 있습니다. 지표 사용 방법: - 매수 신호

MT4용 외환 지표 "8개 종목 DeMarker", 리페인트 없음. - DeMarker 오실레이터 곡선은 지표 계산 기간 동안 이전 고가 및 저가 대비 현재 가격 위치를 나타냅니다. - DeMarker는 다른 오실레이터 중 가장 효율적인 정기적 다이버전스 신호를 제공합니다. - 과매수 구간(0.7 이상)에서 정기적 다이버전스를 보이는 매도 진입 시점과 과매도 구간(0.3 미만)에서 정기적 다이버전스를 보이는 매수 진입 시점을 활용하는 것이 좋습니다. - "8개 종목 DeMarker"를 사용하면 단 하나의 차트에서 최대 8개 종목의 DeMarker 값을 제어할 수 있습니다. - 이 지표는 과매도/과매수 구간의 가격 움직임 진입 시점과도 결합하면 매우 유용합니다. Click here to see high quality Trading Robots and Indicators! 본 제품은 MQL5 웹사이트에서만 제공되는 오리지널 제품입니다.

SuerteFX Scanner Pro — Institutional Smart Money Scanner for MT4 Identify high-probability BUY and SELL setups using Smart Money Concepts — with built-in signal accuracy tracking so you always know your real edge.
WHAT IT DOES SuerteFX Scanner Pro reads the market the way institutional traders do — through structure breaks, liquidity sweeps, and multi-timeframe confluence. It filters every potential signal through 5 layers before showing anything on screen. If conditions are not aligned, it wai

Volume Flow Heikin Ashi – Professional Institutional Trading System Tired of lagging indicators, fakeouts, and losing capital during choppy sideways markets? Welcome to Volume Flow Heikin Ashi , a professional-grade trend-following system designed to transform standard price charts into a powerful, institutional-level execution engine by synchronizing Price Action with Order Flow and Volume . Unlike generic indicators that only smooth out price fluctuations, this advanced algorithm combines Tren
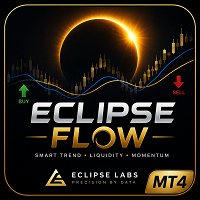
Product Name Eclipse Flow — TMA Band & RSI Sniper with Liquidity-Based SL/TP Short Description A multi-filter trading indicator combining TMA Band, RSI Sniper confirmation, and liquidity-based SL/TP logic — with a built-in 6-timeframe dashboard. Non-repainting. Full Description Eclipse Flow is a MetaTrader 4 indicator built to filter entry signals through multiple confirmation layers simultaneously, reducing false signals common with single-indicator strategies, while providing SL/TP guidance b

Gold Weekly High Trap Zones Weekly High Trap Zones is a clean MT4 weekly range-mapping indicator designed to help traders identify the key trap zone created around the current week’s high.
The indicator finds the current weekly high, identifies the session range connected to that high, and then projects a structured trap-zone ladder from that range. It displays the important weekly high origin level, trap zone top and bottom, 100 level, 161.8 target, 261.8 target, and optional higher extensio
MetaTrader 마켓은 과거 데이터를 이용한 테스트 및 최적화를 위해 무료 데모 거래 로봇을 다운로드할 수 있는 유일한 스토어입니다.
어플리케이션의 개요와 다른 고객의 리뷰를 읽어보시고 터미널에 바로 다운로드하신 다음 구매 전 트레이딩 로봇을 테스트해보시기 바랍니다. 오직 MetaTrader 마켓에서만 무료로 애플리케이션을 테스트할 수 있습니다.
