 MetaTrader 5
 Uzmanlar
 Göstergeler
 Kütüphaneler
 Yardımcı programlar
 Widget'lar
 Kurallar
YouTube'dan Mağaza ile ilgili öğretici videoları izleyin
Bir alım-satım robotu veya gösterge nasıl satın alınır?
Uzman Danışmanınızı
sanal sunucuda çalıştırın
sanal sunucuda çalıştırın
Satın almadan önce göstergeyi/alım-satım robotunu test edin
Mağazada kazanç sağlamak ister misiniz?
Satış için bir ürün nasıl sunulur?
MetaTrader 4 için yeni Teknik Göstergeler - 167
 Aşağıda listelenen teknik göstergelerden gelen sinyaller, MetaTrader 4 platformunda işlemler açılması ve kapatılmasında çok önemli bir rol oynar.
Göstergeler, fiyat değişikliklerini tahmin etmeyi amaçlayan, finansal sembol fiyatının matematiksel dönüşümüdür.
Aşağıda listelenen teknik göstergelerden gelen sinyaller, MetaTrader 4 platformunda işlemler açılması ve kapatılmasında çok önemli bir rol oynar.
Göstergeler, fiyat değişikliklerini tahmin etmeyi amaçlayan, finansal sembol fiyatının matematiksel dönüşümüdür. 
The Best and Worst indicator (similar to Net Change Indicator) has the peculiarity of being a dynamic indicator. It seems a very Stock Exchange Indicator. This means that it is able to draw up a list and put in order the best and worst instruments in descending order. You can choose to show the percentage of any Time Frame: 1M, 5M, 15M, 30M, H1, H4 etc ... This instrument could really give great suggestions on your trading in order to center the right time and to have a total view of the markets

The indicator Net Change is a very useful tool able to extrapolate a percentage in order to have a real reference on the performance of the instrument. This indicator is designed to show the main values: you could monitor the Daily, Weekly, Monthly, Quarterly, Semi-annual and Annual percentages. A necessary tool for those who want to really explore the quantitative logic of the market.
Input values SYMBOLS SETTINGS Use_Only_Current_Symbol (true/false): Permits to manage only current symbol on p

Trend Trade indicator is based on ADX indicator to define long/medium/short trend and good entry signals. The product supports virtual trade on chart to show where/when should we make an entry/exit. It works very well on D1 or above. The indicator is efficient on GOLD and CFDs. Alert_Settings = "+++++++++++++++++++++++" SendMailMode = true - Send email SendNotificationMode = true - Send notification to your phone AlertMode = true - Sound alert Show_Virtual_Trades = true - Show virtual trades Sin

i-Regression Channel generates regression channel: Linear regression channel consists of two parallel lines located at the equal distance from the linear regression trend line. The distance between the channel borders and the regression line is equal to the value of the highest close price deviation from the regression line. degree - degree of regression, changes from 1 to 61; kstd - regression channel width; bars - the number of bars for the channel calculation; shift - the channel horizontal s

This indicator is another variant of the famous powerful indicator Fibonacci-SS https://www.mql5.com/en/market/product/10136 but has different behaviour in placing Pending Order and TP Line. Automatically places Fibonacci retracement lines from the last highest and lowest visible bars on the chart with: An auto Pending Order (Buy/Sell). Taking Profit 1, Taking Profit 2 is pivot point and Taking Profit 3 for extended reward opportunity. The best risk and reward ratio.
Simple and powerful indicat

The indicator colors bullish, bearish and doji candles. Also, the amount of candles (bullish, bearish and doji) for the last N days is calculated. You can select colors for both bodies and shadows of candles. You can also enable coloring only candle bodies. МetaТrader 5 version: https://www.mql5.com/en/market/product/11649 Parameters color bulls = color of bullish candle bodies color shadow bulls = color of bullish candle shadows color bears = color of bearish candle bodies color shadow bears =
YF-Meter indicator help you to find the fastest speed up currency pairs.
While the US news are released, non-US currencies rising up or dropping down at the moment.
It is important to consider "the opportunity cost" of opening the positions.
If we can find the fastest rising up or dropping down currency pairs, that would improve our trading. This idea comes up with "Newton's laws of motion", different from the traditional volatility measurement.
After adjustment by the unique filter(the digital
The indicator calculates WPR formula on volume-aware indicators Accumulation/Distribution , OnBalance Volume , or Price Volume Trend . WPR range is moved into positive domain [0..1] for convenience.
Parameters WPR - period of WPR, by default 24; Base - type of the underlying indicator: AccumulationDistribution (by default), OnBalanceVolume, or PriceVolumeTrend; Price - applied price type for OBV and PVT, by default - Close; it's ignored in case of AD;
Screenshots On the screenshots below the
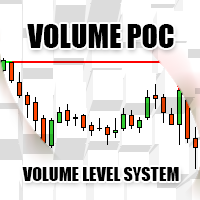
Volume POC
The Volume POC indicator displays important levels. You can use it as an independent trading system. Warning functions at a candle closing allow you to have some information on the market direction. The graphical display is simple and effective. The levels reported are the result of the study of historical market volumes. These levels give excellent entry points and excellent levels of support and resistance. You can use the indicator also on very low timeframes. It is suitable for t
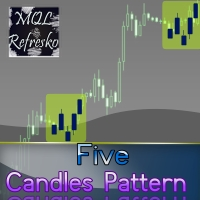
The "Five Candle Pattern" indicator is a novel way to see the market, because with it we can compare and/or seek training or the pattern of the past 4 or 5 Candles, and identify them in the same graph, to view your behavior at an earlier time. The indicator creates a pattern of those 4 or 5 candles and searches backward, identifies, and marks the same formation or pattern. With that information you adjust the strategy that is operating, or create a new one, because you can compare the past devel
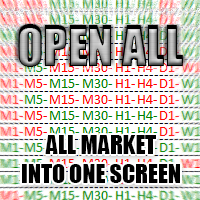
The Open All indicator uses a simple market information that is "Open Candle". This tool is able to show all the openings of all time frames in order to extract information of strength and trendy. You can display 28 instruments with relative time frame interior for a total of 252 informations. The display is fully customizable, you can choose either the symbol and enable/disable Time Frames. Using it correctly you could get valuable aid to intercept correlations and turning points in the market.

This is a moving average which can move not only to the right/left, but also up/down. You can also select a mode of displaying the indicator (as a line or as dots) and all other settings of a standard moving average. If you overlay several indicators in one window, you can clearlier determine price channels setting each border individually.
Settings Line_or_Dot - mode of displaying the indicator: true - as a line, false - as dots; MA_period - moving average period; MA_shift_X - number of candle

This is an indicator detecting trend direction. It uses the popular Bill Williams Alligator. It shows market state on all timeframes on one chart. As is well known, traders gain the main profit on the Forex market trading by trend, and losses usually occur when the market is flat. So, in order to gain profit a trader should learn to detect trend market and direction of a current trend in a rapid manner. This indicator has been developed for this purpose. MTF Alligator helps to: Profitably trade
FREE
The main rule of the profitable trading is opening trades in the direction of a trend. You can define the current trend using fractal analysis. The Important Zone ResSup indicator displays important price support and resistance levels on the chart. The breakthrough or bounce from those levels shows further price direction. The data panel allows you to track the current trends on all timeframes. The current timeframe's important level values are shown in the comments. The indicator can be useful

Advanced ideas of the popular MACD indicator: It detects and displays classic and reverse divergences (three methods of detecting divergences). It uses different color to highlight an uptrend and a downtrend. Two methods of determining a trend: а) MACD crosses the 0 level (classic signal); б) MACD crosses its own average (early signal). This is a multi-timeframe indicator: it can display MACD data from other timeframes. Two methods of drawing: classic histogram and line. It generates sound and v
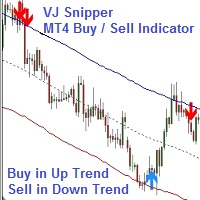
VJ Sniper - MT4 Buy / Sell Indicator: This Indicator is as simple as Buy in Up Trend & Sell in Down Trend. There are 2 Support / Resistance lines for choosing the best Entries. Background: Any in-built indicator of MT4 does not work as stand alone such as Stochastic, CCI or DeMarker etc. But combination of them with trend projection work & give the best results for Trading entries. So this Indicator is blended to give the best results whi
The indicator searches Price Action patterns and puts corresponding labels on a chart. It can display only certain selected patterns.
Determined Patterns: Inside Bar. Determinative bullish bar Inside Bar. Determinative bearish bar BUOVB (engulfing). Bullish setup BEOVB (engulfing). Bearish setup DBLHC. Bullish setup (bars with similar Lows and higher closure) DBHLC. Bearish setup (bars with similar Highs and lower closure) Pin Bar. Bullish setup Pin Bar. Bullish setup Pin Bar. Bearish setup Pin

BreakEven Line is a very useful and easy to use indicator. In case of multiple positions opened on the same instrument, the indicator shows the breakeven point where it is possible to close the positions. Its graphic simplicity makes it an unobtrusive and customizable tool. You can enable/disable a line on a chart, so you can make the indicator invisible. Inputs Show cumulative BE (line on/off) Breakeven line color (to change the line color) Breakeven line style Breakeven line width Show short B

Parabolic Converter is and analogue of the Parabolic indicator for МТ4 which can automatically recalculate parameters of Time Frame specified in settings for lower time periods. It has a Notification System which triggers when the price movement direction is changed. For example: if we set Time Frame 1 Hour to H1 and M30, M15, M5 and M1 contained therein, we can see the indicator's readings corresponding to H1 (fig.). At that, if we add one more Parabolic on the same chart (of several charts) wi

Charles Henry Dow felt that if the industrial average and the railroad average both moved in the same direction, it meant that a meaningful economic shift was occurring. In brief, this indicator bases on the Dow's theory. It can create an index of market symbols, almost anythings index. For example: Index of the Euro, Index of the Great Britain Pound, Index of the Japanese Yen, Index of the Swiss Franc, Index of the Gold, Index of the New Zealand Dollar, Index of the Australian Dollar, Index of
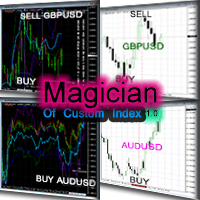
Charles Henry Dow felt that if the industrial average and the railroad average both moved in the same direction, it meant that a meaningful economic shift was occurring. In brief, this indicator bases on the Dow's theory. It can create an index of market symbols, almost anythings index. For example: Index of the Euro, Index of the Great Britain Pound, Index of the Japanese Yen, Index of the Swiss Franc, Index of the Gold, Index of the New Zealand Dollar, Index of the Australian Dollar, Index of
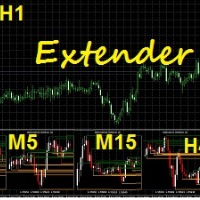
Extender represents a multifunctional indicator which can be used for own investing strategy or can be easily adopted as a part your own investing strategy. After installation as a secondary indicator you can see a multiframe visualization of selected timeframes of analyzed underlying asset. The multiframe visualization has a few modifications which can be selected in section Indicator Setup.
Input parameters Indicator setup Timeframes – definition of selected timeframes for visualization, e.g.

Trend Hunter , Forex, CFD'ler, kripto para birimleri ve metaller ticareti için bir trend göstergesidir. Uzun vadeli trendleri belirler ve trende dayalı giriş noktaları bulur. Oluşturulduktan sonra, gösterge sinyali aktif kalır ve yeniden çizilmez. Her gösterge sinyali için Kar Al ve Zarar Durdur seviyeleri hesaplanır. İşlemler, Zarar Durdur'un katları olan çeşitli Kar Al seviyelerinde ( TP1 , TP2 , TP3 , TP5 ve TP7 ) aşamalı olarak kapatılabilir. Kullanım kolaylığı için gösterge menüsü grafiğin
Introduction to GARCH Indicator GARCH is the short initial for Generalized Autoregressive Conditional Heteroskedasticity and it is the volatility prediction model commonly used in financial industry. GARCH model was first appeared in the work by Danish Economist, Tim Peter Bollerslev in 1986. The 2003 Nobel Prize winner, Robert F Engle also added much contribution for the refinement of GARCH model with Tim’s work. Our GARCH INM predictor took the original method of Nelder Mead for GARCH model bu
FREE
This indicator provides you with MACD formula applied to volume-aware Accumulation/Distribution and OnBalance Volumes indicators. In addition to tick volumes it supports special pseudo-real volumes, synthesized for Forex symbols where real volumes are unknown. More details on the volume surrogates may be found in description of another indicators - TrueVolumeSurrogate and OnBalanceVolumeSurrogate (algorithm of the latter is used internally in MACDAD for AD and OBV calculation before they proceed
Control Trading Intraday Zones shows the best candles-zones to trade intraday. Shows maximum of the day and minimum of the day zones, adaptable to each symbol, gives you a guide to know the best zones to make the best intraday trades. Indicator goes from -100 (lowest of the day) to 100 (highest of the day), when 0 is middle price of the day. For example, when price reaches high of the day the indicador will continue showing max levels even the price continue rising, because indicator limits to 1
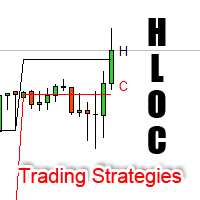
High Low Open Close Levels The indicator HLOC is a good ally to correctly identify the appropriate trend of price. The indicator is designed to be minimally invasive and it shows a visual and sound aid in order to take decision on the market. The indicator is equipped with sound alert and window alert in order to have a reminder of the price movements. We suggest you watch the video below to evaluate its operational benefits.
Input values: Show Level (true/false) TimeFramePeriod (refer to lines

How to use Pair Trading Station Pair Trading Station is recommended for H1 time frame and you can use it for any currency pairs. To generate buy and sell signal, follow few steps below to apply Pair Trading Station to your MetaTrader terminal. When you load Pair Trading Station on your chart, Pair Trading station will assess available historical data in your MetaTrader platforms for each currency pair. On your chart, the amount of historical data available will be displayed for each currency pai

Informational indicator which shows: Swap Price under/upper Open for every Time Frame Spread Time to close the current candle Broker Time Net Change: delta in percentage from Open (MN-W1-D1) Tick Value Volumes Info for every trades open: Lots Breakeven Profit Buy-Profit Sell Equity Symbol Positive values are green and negative values are red (modifiable in input).
Inputs: View BE line (enable/disable) View all Symbol (shows the list of symbol) Color (for every text) Line Color (for BE line)
MultiCurrencyWPR (MCWPR) indicator applies conventional WPR formula to plain Forex currencies (that is their pure strengths extracted from Forex pairs), market indices, CFDs and other groups of tickers. It uses built-in instance of CCFpExtraValue to calculate relative strengths of selected tickers. Unlike standard WPR calculated for specific symbol, this indicator provides a global view of selected part of market and explains which instruments demonstrate maximal gain at the moment. It allows yo

MCAD stands for M ulti C urrency A ccumulation/ D istribution, so please don't confuse it with the well-known MACD. MCAD calculates relative strengths of Accumulation/Distribution of volumes for plain Forex currencies (that is their synthetic behaviour extracted from Forex pairs), market indices, CFDs and other groups of tickers. It uses standard Accumulation/Distribution formula ( Wikipedia's article ) and can apply it either to tick volumes, or to pseudo-real volumes ( volume surrogates , intr

This indicator is an interpretation of the Average Directional Movement Index (ADX), which helps to determine the presence of a price trend. It was developed and described in detail in the book "New Concepts in Technical Trading Systems" by Welles Wilder. The indicator determines entry points into the market, using the intersection of the +/- lines of the ADX indicator as a signal, as well as the rise or fall of the main line of the ADX indicator. Crossing the zero line by the indicator indicate
FREE

The Heikin Ashi indicator is our version of the Heikin Ashi chart. Unlike competitor products, this indicator offers extensive options for calculating Heikin Ashi candles. In addition, it can be displayed as a classic or smoothed version.
The indicator can calculate Heikin Ashi with moving average by four methods: SMA - Simple Moving Average SMMA - Smoothed Moving Average EMA - Exponential Moving Average LWMA - Linear Weighted Moving Average
Main features The indicator shows Heikin As
FREE
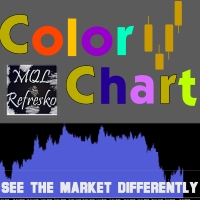
Visualize your charts differently in MetaTrader 5. The product is good for comparing the prices, since the indicator draws High, Close, HLC, etc. It is useful when applied with other indicators (like MACD). This simple indicator colors the entire space below the chart allowing you to see the market with greater clarity. You will see the actual price, trends, and the market behavior.
Indicator parameters: Applied_Price : From this option you can select the type of price you want to draw with th
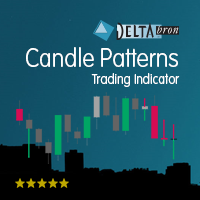
The Candle Patterns indicator shows popular candle patterns on the chart. The possible patterns are Inside Bar, Large Wick, Engulfing, Marubozu, Hammer, Shooting Star, Three White Soldiers and Three Black Crows. Candles are colored to easily identify the patterns. Also, a point and click function displays the pattern found.
Settings Message box - when a candle is clicked, the pattern identified will be shown in a Message Box on the charts. All 'Message Box' settings pertain to the box. Show Ins

The Currency Index indicator enables traders to display any index of eight major currencies. It uses a special calculation that considers specific currency pairs and their weights.
The default weights are based on the BIS Triennial Central Bank Survey results. Because of this advantage, the trader can see each currency's true strength and weakness.
Note: If the indicator is used in Strategy Tester (demo version), please keep in mind that all currency pairs' data must be downloaded in History
The National Prise Reversal indicator represents an oscillator of a national currency (options: USD, CAD, CHF, JPY, GBP, EUR, AUD . It is based on already known Prise Reversal oscillator. But it analyzes particularly movement of a selected national currency on pairs with other specified currencies. Basing on these data the National Prise Reversal indicator determines overbought or oversold of the selected currency. When the indicator is in the overbought zone, it indicates possible weakening of
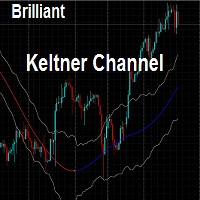
This indicator draws the Keltner Channel for any time frame Displayed on the current Time frame allowing user to choose which moving average type for the calculations. The available Moving Averages are: Simple Moving Average (MA_Mode=Mode_SMA)
Exponential Moving Average (MA_Mode=Mode_EMA) Smoothed Moving Average (MA_Mode=Mode_SmoothedAverage) Linear Weighted Moving Average (MA_Mode=Mode_LinearWeighted) Tillson's Moving Average (MA_Mode=Mode_Telsons) Moving Average line is coded into RED or BLUE

The Pairs Cross indicator is a unique tool for negatively correlated trading instruments, such as EURUSD and USDCHF currency pairs. It is based on a concept called pairs trading (or spread trading). Our indicator compares the strength of two currency pairs that are inversely correlated and quickly tells you when it’s time to buy the first pair and short a second pair, and vice versa. This is a straightforward approach to trading currency pairs that works very well.
How to you use the Pairs Cro

The Pairs Spread indicator has been developed for the popular strategy known as pairs trading, spread trading, or statistical arbitrage. This indicator measures the distance (spread) between prices of two directly (positively) correlated instruments and shows the result as a curve with standard deviations. So, traders can quickly identify when the instruments are too far apart and use this information for trade opportunities.
How to use the Pairs Spread indicator Best results are attained whe

Breakeven Level indicator shows the breakeven level of your buy and sell orders. Useful if you have several open positions. Apart from demonstrating breakeven level, the indicator displays additional information concerning your trading instrument in the upper right corner (balance, equity, number of buy orders, sum of buy orders, number of sell positions and sum of sell orders). Breakeven level for sell orders has red color, buy - blue color.
Indicator Parameters Color of the text on the chart:
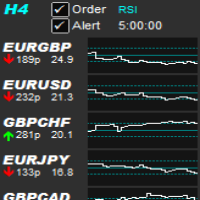
Allows symbols/currency pairs to be ordered based on a configured indicator, with the best performing symbols shown at the top. This helps you to select the symbol with better prospects from a given list of symbols. Can optionally alert when a symbol moves into the top two (configurable). Also shown is the number of pips that the symbol has moved in its current direction, allowing you to tell if you've 'missed the boat'. Further, a graph is shown, per symbol, of the indicator value over time all
The Correlation Matrix indicator shows the actual correlation between the selected instruments. The default setting is set to 28 currency pairs, gold, and silver, but the indicator can compare any other symbols.
Interpretation of the indicator Positive correlation (correlation is above 80 %). Negative correlation (correlation is below -80 %). Weak or no correlation (correlation is between -80 and 80 %).
Main features The indicator shows the actual correlation between the selected instrumen
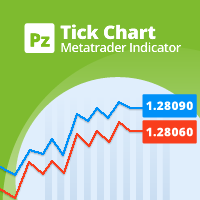
This indicator displays a complete tick chart with two optional moving averages, and makes paying attention to sub-m1 price data really easy. [ Installation Guide | Update Guide | Troubleshooting | FAQ | All Products | Get Help ] Identify price spikes easily The blue line is the ask price The red line is the bid price The indicator doesn't lose tick data when reloaded It implements two optional moving averages The indicator is non-repainting
Input Parameters
Display Moving Averages: Display
FREE

This indicator allows you to see the strength of the trend on all timeframes. It can be used for all currency pairs. The indicator can be displayed in the form of a column (from left to right): status buy / sell / strong buy / strong sell, strength of the trend in percentage, pips last candle, body candle now, remaining time, and the timeframe of M1 to MN. Information contained below (from left to right): total trend percent, sell percent, buy percent.

This indicator is meant for Harmonic Traders, it helps them in identifying the formed patterns by analyzing the market past data, looking for Harmonic Patterns. The Patterns that this indicator can detect are: AB=CD Butterfly Gartely Crab Bat The indicator shows the following: The completed pattern, with the critical zone highlighted in Gray box The suggested 3 take profit levels (in green) The Suggested Stop Loss level (in Red) The formed pattern ratios can be checked by hovering the mouse on t
The most important thing in my system of forces, is the variation and changing of these forces. It is the key to the whole system, and from this point, my second indicator called FORCES-VARIATION appeares important. The indicator is represented in a separate window in the form of the green histogram and the red curve . The parameter NPIuPeriod represents the number of bars on which we calculate the variation of buyers forces. The parameter NPIdPeriod represents the number of bars on which we cal
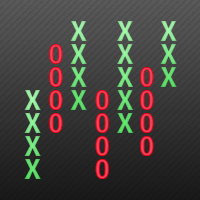
This indicator displays Point & Figure charts (PnF charts) in the indicator window. PnF charts show only price movements that are bigger than the specified box size. It helps to eliminate noise and allows focusing on main trends. Time is not a factor here. Only price movements are taken into account. That is why PnF chart is not synchronized with the main chart it is attached to. More about PnF charts: http://stockcharts.com/school/doku.php?id=chart_school:chart_analysis:pnf_charts Indicator wor
FREE

This indicator builds so called "random walk" bands: on every bar it finds maximal or average distance between current price and multiple expanding parabolic curves starting at predefined number of bars in the past. If you like Bollinger bands or Envelopes you may find this indicator useful as well. As you may know, price movements are very similar to random walk time series (specifically, Gaussian random walk), yet they do effectively break the hypothesis of randomness. One of the features of t
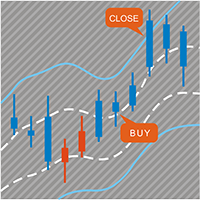
Gösterge iki bölümden oluşur. Bölüm I: Renkli Mumlar Ana Trendi Gösteriyor Renkli mumlar, piyasa durumunu renkli mum çubuklarıyla tanımlamaktır. Ekran görüntülerinde görüldüğü gibi renk Aqua ise piyasa uzun emir vermeniz veya kısa emirlerden çıkmanız gereken bir durumda demektir. Renk Domates ise kısa sipariş verme veya uzun siparişlerden çıkma zamanı gelmiştir. Renk değişiyorsa tamamlanmasını beklemek daha iyidir (mevcut çubuk kapanana kadar). Bölüm II: Bantların çizilmesi İç bantlar güvenli al
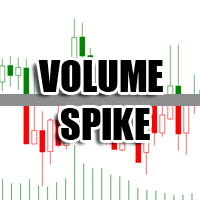
The Volume Spike indicator is a useful tool to identify the directional market's intention.
How Does It Work: The Volume Spike indicator identifies the volume peaks and creates a sensitive rectangle equipped with Alert and Warning Pop Up that it suggests the market's direction. This tool has the ability to select the time frame on which to do the analysis of volume and it gives a great visual signal colored into rectangle. The indicator can identify valid market signals but it can also suggest
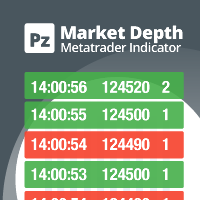
Do you like scalping? Th is indicator displays information about the latest price quotes received from the broker. [ Installation Guide | Update Guide | Troubleshooting | FAQ | All Products | Get Help ] Identify tick trends easily A blue row means the price has increased A red row means the price has decreased Customizable colors and font sizes Display your desired amount of rows The indicator is non-repainting
Parameters Rows: amount of rows with data to display in the chart Font size: fo
FREE

This is a professional multi currency tool. Its main purpose is semi-automatic Forex trading following Elder's Triple Screen strategy. Its wide functionality and ability to quickly change some essential parameters makes it an ideal market interpretation tool, which is indispensable in the common trade analysis. Its main advantage is almost unlimited number of simultaneously analyzed instruments. If the potential technical limits of your monitor resolution allow, multiple indicators can be used.
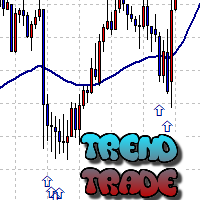
The Trend Trade indicator displays assumed turning points of the price on the chart in the direction of the trend after correction. It is based on data of the Prise Reversal oscillator with the period 6 and indicators which characterize strength and availability of the trend. When the value of Prise Reversal is in overbought or oversold area (area size is set by a user), and the current trend is confirmed, the Trend Trade indicator draws an arrow pointed to the further assumed price movement.
I
The indicator compares quotes of the current symbol and a synthetic quote calculated from two specified referential symbols. The indicator is useful for checking Forex symbol behavior via corresponding stock indices and detecting their convergence/divergence which can forecast future price movements. The main idea is that all stock indices are quoted in particular currencies and therefore demonstrate correlation with Forex pairs where these currencies are used. When market makers decide to "buy"

The product shows general information in a single chart window. It is convenient when you trade many symbols simultaneously. The indicator shows the total number of positions and pending orders. The following info is displayed for opened positions: symbol, amount of opened buy orders for this symbol and their total profit in deposit currency, amount of opened sell orders and their total profit, total profit of opened buy and sell orders. The following info is displayed for pending orders: symbol

true Momentum - time-based Indicator it will inform about Momentum, a strong impulse in the appropriate direction it's based on a self-developed candle Pattern, in relation to the ATR (Average True Range)
Quick Start : the indicator is ready to use choose your personal times to trade try an indicator-preset or use an additional indicator, below the pro-settings
Filter Hours Weekdays Moving Averages Correlation Instruments - Moving Averages MACD RSI ADX PSAR Stochastic Bollinger Bands Keltner-
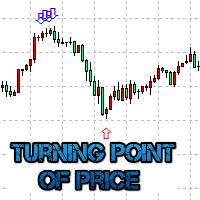
The Turning point of price indicator displays assumed turning points of the price on the chart. It is based on data of the Prise Reversal oscillator and standard ADX. When the value of Prise Reversal is in overbought or oversold area (area size is set by a user), and the value of the ADX main line exceeds the preset value, the Turning point of price indicator draws an arrow pointed to the further assumed price movement. This idea is described in the article Indicator of Price Reversal .
Indicat
This indicator shows data from 9 currency pairs by your choice from all 9 timeframes. If a digital value of the RSI is less or equal to DnLevel = 30 (or whatever number you decided to put), then a Green square will appear. This is (potentially) an Oversold condition and maybe a good time to go Long . If a digital value of the RSI is greater or equal to UpLevel = 70 (or whatever number you decided to put), then a Red square will appear. This is (potentially) an Overbought condition and maybe a go

The Supply and Demand with Swap zones MTF indicator is a powerful tool for technical analysis that has been modified and enhanced to provide traders with even more valuable information. This tool is based on the rule of supply and demand and allows traders to analyze a chart on three different timeframes at once, providing a more comprehensive view of the market. One of the key features of this indicator is the so-called swap zones, which are areas that have been broken through by the price but
FREE

This indicator displays pivot points in the chart, including historical vales, and supports many calculation modes for Pivot Points and S/R levels. [ Installation Guide | Update Guide | Troubleshooting | FAQ | All Products | Get Help ] It plots historical levels for backtesting purposes
It allows you to select the reference timeframe It implements different Pivot Point calculation modes It implements different SR calculation modes
It implements customizable colors and sizes
Calculation Mode
FREE
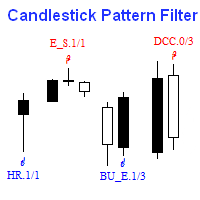
There are many candlestick patterns but only a few are actually worth knowing. Candlestick Pattern Filter detects and marks the most reliable candlestick patterns. Remember that these patterns are only useful when you understand what is happening in each pattern. They should be combined with other forms of technical analysis for best result. These patterns are included: Hammer / Hanging Man Inverted Hammer / Shooting Star Bullish / Bearish Engulfing Piercing Line / Dark Cloud Cover Morning Star
FREE
The Stretch is a Toby Crabel price pattern which represents the minimum average price movement/deviation from the open price during a period of time, and is used to calculate two breakout levels for every single trading day. It is calculated by taking the 10 period SMA of the absolute difference between the open and either the high or low, whichever difference is smaller. This value is used to calculate breakout thresholds for the current trading session, which are displayed in the indicator as
FREE

The presented indicator draws the pivot points for different timeframes – 4 hours, day, week and month. Before you leave, download the demo version of this indicator, evaluate its performance. After all, this does not oblige you to anything. And then you will see that it has the best price to quality ratio, buy it now and receive updates for free. In the new version, an information panel with control buttons is displayed on the screen. The "Symbol properties" information panel shows: Symbol - na
This indicator measures volatility in a multi-timeframe fashion aiming at identifying flat markets, volatility spikes and price movement cycles in the market. [ Installation Guide | Update Guide | Troubleshooting | FAQ | All Products | Get Help ] Trade when volatility is on your side Identify short-term volatility and price spikes Find volatility cycles at a glance The indicator is non-repainting The ingredients of the indicator are the following... The green histogram is the current bar v
FREE

VR Izgara göstergesi, kullanıcı tanımlı ayarlarla grafiksel bir ızgara oluşturmak için tasarlanmıştır . Standart ızgaradan farklı olarak, VR Izgarası dairesel seviyeler oluşturmak için kullanılır. Kullanıcının seçimine bağlı olarak tur seviyeleri arasındaki adım isteğe bağlı olabilir. Ek olarak, diğer göstergeler ve yardımcı programlardan farklı olarak VR Grid, zaman dilimi değiştiğinde veya terminal yeniden başlatıldığında bile ızgaranın konumunu korur . Ayarlar, set dosyaları, demo versiyonlar
FREE
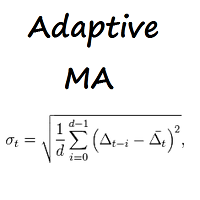
Moving Average. Calculation method: average value of all prices used for determining a bar.
Description of External Settings of the EA: MA_period - period of averaging for calculation of the indicator. Recommended values: 5, 13, 21, 34. ma_method - averaging method. It can have any values of the Moving Average method (Moving Average). 0 - (SMA) Simple Moving Average. 1 - (EMA) Exponential Moving Average. SMMA 2 - (SMMA) Smoothed Moving Average. LWMA 3 - (LWMA) Linear weighed Moving Average.
Description of the Settings: MA_period_fast - The period of averaging for calculation of fast Moving Average. MA_period_slow - The period of averaging for calculation of slow Moving Average. price - price used. It can be any of the price constants. 0 - (CLOSE) Close price. 1 - (OPEN) Open price. 2 - (HIGH) The maximum price. 3 - (LOW) The minimum price. 4 - (MEDIAN) The average price, (high+low)/2. 5 - (TYPICAL) Typical price, (high+low+close)/3. 6 - (WEIGHTED) Weighed close price, (high+low+clo
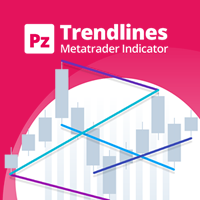
Tired of plotting trendlines? The PZ TrendLines indicator applies a mechanical approach to the construction of trend lines for you! [ Installation Guide | Update Guide | Troubleshooting | FAQ | All Products | Get Help ] It can draw up to 18 trendlines Trendlines can be optionally based on fractals Each line represents a breakout level Each trendline can be broken or rejected Configurable amount of lines Configurable colors
Author Arturo López Pérez, private investor and speculator, softwar
FREE
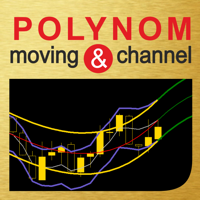
The use of a polynomial expansion of data opens up new possibilities for analysis and decision making. But the problem of all existing algorithms is a very slow computation. The main feature of this indicator is its fast algorithm. The speed of calculation of the polynomial algorithm and its standard deviation values is several thousand times faster than conventional algorithms. So this is a convenient algorithm for use without the need to apply supercomputers. Also, starting from version 1.4
MetaTrader Mağazası, geliştiricilerin alım-satım uygulamalarını satabilecekleri basit ve kullanışlı bir sitedir.
Ürününüzü yayınlamanıza yardımcı olacağız ve size Mağaza için ürününüzün açıklamasını nasıl hazırlayacağınızı anlatacağız. Mağazadaki tüm uygulamalar şifreleme korumalıdır ve yalnızca alıcının bilgisayarında çalıştırılabilir. İllegal kopyalama yapılamaz.

Alım-satım fırsatlarını kaçırıyorsunuz:
- Ücretsiz alım-satım uygulamaları
- İşlem kopyalama için 8.000'den fazla sinyal
- Finansal piyasaları keşfetmek için ekonomik haberler
Kayıt
Giriş yap
Web sitesi politikasını ve kullanım şartlarını kabul edersiniz
Hesabınız yoksa, lütfen kaydolun