 MetaTrader 5
 Uzmanlar
 Göstergeler
 Kütüphaneler
 Yardımcı programlar
 Widget'lar
 Kurallar
YouTube'dan Mağaza ile ilgili öğretici videoları izleyin
Bir alım-satım robotu veya gösterge nasıl satın alınır?
Uzman Danışmanınızı
sanal sunucuda çalıştırın
sanal sunucuda çalıştırın
Satın almadan önce göstergeyi/alım-satım robotunu test edin
Mağazada kazanç sağlamak ister misiniz?
Satış için bir ürün nasıl sunulur?
MetaTrader 4 için yeni Teknik Göstergeler - 140
 Aşağıda listelenen teknik göstergelerden gelen sinyaller, MetaTrader 4 platformunda işlemler açılması ve kapatılmasında çok önemli bir rol oynar.
Göstergeler, fiyat değişikliklerini tahmin etmeyi amaçlayan, finansal sembol fiyatının matematiksel dönüşümüdür.
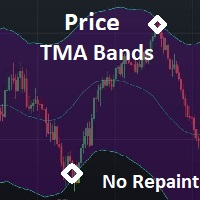
This is a simple PriceTMA bands, non repaint! it can be used for a trend following system or sometimes reversals. as a main signal or a filter for others strategies, it depends on the trader main strategy. calculations for this indicator are a combined Algorithm between moving averages "MA" and average true range"ATR". good luck with your trading! i hope it is helpful Cheers

This indicator is just a simple ATR indicator. It calculates the Average True Range and let you tell it to show the percentage of the ATR. You will then see the % of the ATR on the screen. I like to use it to calculate different things for my trading. If I use the really great AW Recovery System ( https://www.mql5.com/en/market/product/28868 ) there is a great strategy made by the developer, where you watch the daily ATR and set the steps calculated on part of the ATR. So if you put the Part of

This is triangular moving average(TMS). TMS uses Simple Moving Averages for moving average calculation. If TMA periods is 5,five SMAs are used for calculation. TMA weights middle part of the price series. In other words,TMA is less noisy and more accurate .
Input Parameters TMAPeriods ----- Defines perids for TMA calculation.
ModeForTMA ----- Defines mode for TMA calculation.This is normally SMA.
AppliedPriceForTMA ----- Defines applied price for TMA calculation. ShowNormalMA -----Show normal m

В основе индикатора TDI лежат следующие индикаторы: RSI, Moving Average, Bollinger bands, но основным из них нужно выделить RSI, весь расчет индикатора завязан от его значений.
Зеленая линия (линия RSI) – сглаженные простой (по умолчанию) скользящей средней значения индикатора RSI, период сглаживания 2.
Красная линия (сигнальная линия) – сглаженные простой (по умолчанию) скользящей средней значения индикатора RSI, период сглаживания 7.
Синие линии – индикатор Bollinger bands по умолчанию пери
FREE

KT Auto Support Resistance Levels: MetaTrader 4/5 için Çoklu Zaman Dilimi S&R, Smart Zones ve Seviye Paneli Swing tepeleri. Pivotlar. Order block’lar. Önceki tepe ve dipler. Her trader piyasayı biraz farklı şekilde işaretler ve bunun bedelini genellikle grafik öder. Tek ekrana yeterince fazla yöntem yığarsanız, grafik artık bir harita olmaktan çıkar. Gürültüye dönüşür. KT Auto Support Resistance Levels bunu çözer. Aylık, haftalık, günlük ve mevcut zaman diliminizi aynı anda tarar, ardından gerçe
ZhiBiTMG is a collection of trends and martingale indicators for all market segments and all chart cycles. Many indicators on the market violate the trend but claim to be accurate, but is it really accurate? In fact, it is not accurate! Because the market must go with the trend. This ZhiBiTMG indicator gives the Martingale signal on the premise of the trend. This will be in line with market rules. Instructions for use: The red line is the downward trend line (Sell), a total of three lines; by de
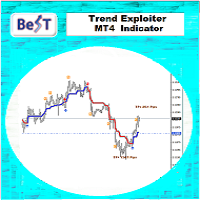
BeST_Trend Exploiter is a Metatrader Indicator based on a smart proprietary algorithm which can detect the market Median Trend while it filters out the noise providing Buy and Sell Signals and also wherever it is applicable it provides us with TP Levels of High Probability. Additionally as it has Built Inside all the necessary features it can be used as a Complete Strategy of very Impressive Results. Essential Advantages of the Indicator
Clear and Easily Understandable trading rules. Real Time
This indicator was developed to support multiple timeframe analysis. In the indicator settings, the user can set the color, width, and style of the horizontal lines for each timeframe. This way, when the horizontal lines are inserted into the chart, they will be plotted with the timeframe settings.
MTF Lines also allows visibility control of another objets like rectangles, trend lines and texts.
This is a product developed by Renato Fiche Junior and available to all MetaTrader 4 and 5 users!
FREE
This indicator was specially developed to support the powerful day trading strategy described in the book "The Price in Time". The NTZ BOX indicator automatically creates: The Day separators The No Trading Zone divided with the Green Box, the Peach Box and the Turqoise Box Extensions of the long and short Take Profit levels The Yellow Box to display the range of the Asian session The Money Manager for a perfect Position Sizing calculated on your risk percentage Using the NTZ BOX indicator will e
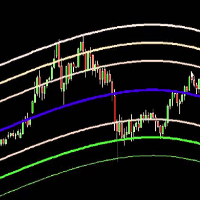
The Belkhayate center of gravity indicator is best used to confirm major turning points, and distinguish price extremes. Generally if price reaches the upper or lower levels one should expect a turn around coming soon, or at least a pull back towards the centre line if there is a strong trend. The upper and lower levels are red and green lines.
Our indicator use the same parameters as the well known trader M.Mostafa Belkhayate the inventor of the indicator, allow the use of buffers for your EA a

CSS " currency strength slope " is a a multi currency strength indicator that use Forex major currencies, EUR, USD, CAD, AUD, NZD, JPY, CHF, GBP. it use 28 major pairs to calculate the power of every currency using a based moving averages algorithm : you will see volatility clearly between currencies. input: MA Fast & Slow. - MA Mode : simple, exponential, smoothed, linear weighted
- Applied Price : close, open, high, low, median price, typical price, weighted price.

This indicator Super MA Pluss indicator.Indicator displays trend movement. Indicator calculates automatically line. Features
FiltPer - displays indicator period. How to understand the status: If the arrow is green, trend is up. If the arrow is red, trend is down. /////////////////////////////////////////////////////////////////////////////////////////////////////////////////////////////////////////////////// ///////////////////////////////////////////////////////////////////////////////////////

Supply Demand Zone Pro Indicator works with all products and timeframes. It is using a new calculation method, and now you can select the desired zone on any timeframe! Strongest Zones are already enabled by default This is a great advantage in trading.This indicator has a built in backtester enabled by default, just move the chart.
Supply and Demand ?
Supply is a price zone where sellers outnumbered buyers and drove the price lower. Demand is a price zone where buyers outnumbers sellers and dr

Индикатор внутри коробки считает количество баров и высоти коробки. фильтрация коробки происходит с помощью пробоя в пунктах или в процентах. Входные парамеиры Минмальное количество баров в нутри коробки Максимальное высота коробки Варянт величины (фылтрация коробки) величина в пунктах после пробоя коробки величина в % после пробоя коробки Максимальное количество стрелок, сигналы на покупку или на продажу.
Military dog s-army will help you identify entry points for the Indian processing. He works for all the peridos. You can open the ADR levels from the settings by double-clicking on the strategy. If you turn off the ADR feature, it will find more transactions.
In particular, in addition to your own strategy, it allows you to pass your processing inputs through a better quality filter.
Do you want the ADR level to average a certain daily volume and signal the trading when the number of points a
Keltner MTF (Not repaint!!!) is a channel indicator that can display price channels from different timeframes on a single chart of quotes. For example, on the H1 chart, you can see at the same time the Keltner price channel from the M15 and H4 timeframe. This tactic makes it possible to more clearly understand the tendency of price movements, to determine trading goals and points for making deals. How the Keltner MTF Indicator Works The Keltner MTF indicator can be used both - for trading in
The elite (V3) multi-indicator suite from JoaquinTrading specifically geared towards Forex & binary options, including regulated exchanges such Nadex, Cantor Exchange, and other binary option brokers.
The Probability Tool Suite Elite will provide the given win/loss outcome probabilities of up to 10 strike levels, a specific expiration duration, based on a combination of up to 16 indicators, rules, or conditions and derivative behavior (i.e. expiry, touch, touch & retrace). Using this indicato

The principle of the indicator. The StatChannel ( SC ) indicator is a development of the Bollinger Bands indicator ( ВВ ). BB is a moving average, on both sides of which two lines are drawn, separated from it by standard deviations std multiplied by the corresponding coefficient. At the same time, a moving average with an averaging period (2n + 1) bars is always obtained lagging behind n bars. Sliding std is also lagging behind on n bars, also calculated by (2n + 1) points. Such
Sessions PRO is a perfect tool which divide your chart screen by 3 main market sessions: 1> asian 2> european (with division for Frankfurt and London start) 3> american
Sessions PRO is perfect especially for trading indices, where main pivot points often occurs along with new market center enters the market. With Sessions PRO you see what events happened at their exact corresponding time - European and American moves and pivot points are much more important than asian. Stop analyzing your chart
The indicator is made on the basis of the algorithm put in the ZigZag History indicator ( https://www.mql5.com/ru/market/product/37376/ ).
In the real option there are no additional buffers and an opportunity to trace work history.
It causes the minimum involvement of random access memory, however productivity practically does not improve. Attention! The Price noise parameter - has significant effect on formation of extrema. Parameters: Depth - is depth of search of a local extremum in bars;

This indicator alerts you when/before new 1 or 5 minute bar candle formed. In other words,this indicator alerts you every 1/5 minutes. This indicator is especially useful for traders who trade when new bars formed.
*This indicator don't work propery in strategy tester.Use this in live trading to check functionality.
There is more powerful Pro version .In Pro version,you can choose more timeframe and so on.
Input Parameters Alert_Or_Sound =Sound ----- Choose alert or sound or both to notify y
FREE

This indicator alerts you when/before new candle bar formed. In other words,this indicator alerts you every 1/5/30/60/240 minutes.
This indicator is especially useful for traders who trade when new bars formed.
*This indicator don't work propery in strategy tester.Use Free Version to check functionality in live trading.
Input Parameters Alert_Or_Sound =Sound ----- Choose alert or sound or both to notify you when new bar is coming.
Enable_1mBarAlert ----- Enable alert for 1 min bar
diff_1m --
The brand new trading indicator using the box breakout strategy is presented by KING.Ai. This indicator with four-mode alerts is developed by KING.Ai ONLY. It is probably impossible that you could find a box breakout indicator like this one. It is very difficult for you to trade with the box breakout strategy as there is limited time for traders to monitor every currency. However, the box breakout strategy is very profitable. It is because when the price breaks the box, the trend will go further

This indicator Master XR indicator.Indicator displays trend movement. Indicator calculates automatically line. Features
FiltPer - displays indicator period. deviation - displays indicator deviation. deviation2 - displays indicator deviation. How to understand the status: If (Timeframe M1-H1) FiltPer = 100; If ( Timeframe H4-MN) FiltPer = 5-20; ////////////////////////////////////////////////////////////////////////////////////////////////////////////////////////////////////////////////////// //

Ultra Advanced RSI, MetaTrader 4 için RSI tabanlı bir göstergedir. Son iki tepe arasındaki uyumsuzluğu (divergence) veya uyumu (convergence) gösterir; bu da trader'ın momentumu fiyatla karşılaştırmasına yardımcı olur. Ana özellikler
- Göreceli Güç Endeksi'ne (RSI) dayanır
- Son iki tepe arasındaki uyumsuzluğu veya uyumu gösterir
- Momentumu en son fiyat hareketleriyle karşılaştırmaya yardımcı olur
- Kullanımı kolay
- Test için demo sürümü mevcuttur Önerilen ayarlar
Zaman dilimleri: M30, H1, H4,

Ultra Advanced Predictor, trader'ın trend ve momentumu okumasına yardımcı olan, MetaTrader 4 için bir teknik göstergedir. Herhangi bir grafik zaman dilimine eklenebilir. Geleceği tahmin etmez; fiyat davranışını incelemek için bir araçtır. Ana özellikler
- Herhangi bir grafik zaman dilimine eklenebilir
- H1, H4 ve D1'de önerilir
- Yakın zamandaki fiyat davranışını incelemeye yardımcı olur
- Kullanımı kolay
- Test için demo sürümü mevcuttur Önerilen ayarlar
Zaman dilimleri: H1, H4, D1
Pariteler: E

Ultra Advanced Stochastic, MetaTrader 4 için stokastik tabanlı bir göstergedir. Yazara göre, ardışık yükseliş ve düşüş mumlarını tespit eder; bu da trader'ın bir hareketin birkaç mum boyunca devam ettiğini görmesine yardımcı olur. Ana özellikler
- Stokastik tabanlı analiz
- Ardışık yükseliş ve düşüş mumlarını tespit eder
- H4 ve D1 zaman dilimlerine odaklanır
- Kullanımı kolay
- Test için demo sürümü mevcuttur Önerilen ayarlar
Zaman dilimleri: H4, D1
Pariteler: EUR/USD, USD/JPY, GBP/USD, USD/CHF

Ultra Advanced MACD, MetaTrader 4 için bir MACD göstergesidir. Fiyat üzerinden hesaplanan iki hareketli ortalamanın birbirinden çıkarılmasıyla hesaplanır; bu, momentumu ölçmenin klasik yoludur. Ana özellikler
- Fiyatın iki hareketli ortalamasından klasik MACD hesaplaması
- Momentumdaki değişimleri takip etmeye yardımcı olur
- H1, H4 ve D1 için uygundur
- Kullanımı kolay
- Test için demo sürümü mevcuttur Önerilen ayarlar
Zaman dilimleri: H1, H4, D1
Pariteler: EUR/USD, USD/JPY, GBP/USD, USD/CHF, U

Ultra Advanced Precision Trend, mumları trendin mevcut durumuna göre renklendiren, MetaTrader 4 için bir trend göstergesidir. Trend doğrudan fiyat grafiği üzerinde okunabilir. Ana özellikler
- Mumlar mevcut trend durumuna göre renklendirilir
- Ek pencere olmadan trend okuma
- Trend durumundaki değişimleri fark etmeyi kolaylaştırır
- Kullanımı kolay
- Test için demo sürümü mevcuttur Önerilen ayarlar
Zaman dilimleri: H1, H4, D1
Pariteler: EUR/USD, USD/JPY, GBP/USD, USD/CHF, USD/CAD, AUD/USD, EUR/J

Ultra Advanced Detrend, MetaTrader 4 için bir trendden arındırma (detrend) göstergesidir. Trendden arındırma, daha kısa döngülerin ve salınımların incelenmesini kolaylaştırmak için ana trendi fiyattan çıkarır. Ana özellikler
- Fiyatın trendden arındırılmış görünümü
- Daha kısa piyasa döngülerini incelemeye yardımcı olur
- Çeşitli pariteler ve zaman dilimleri için ayarlanabilir
- Kullanımı kolay
- Test için demo sürümü mevcuttur Önerilen ayarlar
Zaman dilimleri: H1, H4, D1
Pariteler: EUR/USD, USD

Ultra Advanced Scalper, kısa vadeli analize yönelik, MetaTrader 4 için bir teknik göstergedir. Yazara göre, düşük zaman dilimlerinde scalping için uygundur. Ana özellikler
- Kısa vadeli ve scalping analizi için tasarlanmıştır
- M15'ten H4'e kadar çalışır
- Kullanımı kolay
- Üst zaman dilimi trend filtresiyle birleştirilebilir
- Test için demo sürümü mevcuttur Önerilen ayarlar
Zaman dilimleri: M15, M30, H1, H4
Pariteler: EUR/USD, USD/JPY, GBP/USD, USD/CHF, USD/CAD, AUD/USD, EUR/JPY Nasıl kullanıl

Ultra Advanced MA SMA, MetaTrader 4 için basit hareketli ortalama (SMA) göstergesidir. Basit hareketli ortalama, periyodundaki her muma eşit ağırlık verir ve trendin yumuşak bir görünümünü sunar. Ana özellikler
- Basit hareketli ortalamaya dayanır
- Temel trendin yumuşak görünümü
- Dinamik destek ve direnç referansı olarak hizmet edebilir
- Kullanımı kolay
- Test için demo sürümü mevcuttur Önerilen ayarlar
Zaman dilimleri: M30, H1, H4
Pariteler: EUR/USD, USD/JPY, GBP/USD, USD/CHF, USD/CAD, AUD/U

Ultra Advanced MA Points, bir hareketli ortalamayla ilişkili noktaları işaretleyen, MetaTrader 4 için bir hareketli ortalama göstergesidir. Trader'ın fiyatın ortalama çevresindeki davranışını takip etmesine yardımcı olur. Ana özellikler
- Hareketli ortalama tabanlı analiz
- Noktalar, fiyat ile ortalama arasındaki ilişkiyi görmeyi kolaylaştırır
- Grafikteki geçmiş davranışı incelemek için kullanışlı
- Kullanımı kolay
- Test için demo sürümü mevcuttur Önerilen ayarlar
Zaman dilimleri: M30, H1, H4

Ultra Advanced AutoFibo, MetaTrader 4 için otomatik bir Fibonacci göstergesidir. Adından da anlaşılacağı gibi, trader'ın aracı elle çizmesine gerek kalmadan Fibonacci analizini uygulamak üzere tasarlanmıştır. Ana özellikler
- Otomatik Fibonacci analizi
- Elle çizim zamanından tasarruf sağlar
- Olası geri çekilme bölgelerini bulmaya yardımcı olur
- Kullanımı kolay
- Test için demo sürümü mevcuttur Önerilen ayarlar
Zaman dilimleri: M30, H1, H4
Pariteler: EUR/USD, USD/JPY, GBP/USD, USD/CHF, USD/CAD

Ultra Advanced FibonacciPro, MetaTrader 4 için bir Fibonacci göstergesidir. Fibonacci seviyeleri, bir fiyat salınımı içindeki geri çekilmeleri ve olası tepki bölgelerini incelemek için yaygın olarak kullanılır. Ana özellikler
- Fiyat salınımlarının Fibonacci tabanlı analizi
- Olası geri çekilme bölgelerini bulmaya yardımcı olur
- Stop ve hedefler için referans seviyeleri planlamada kullanışlı
- Kullanımı kolay
- Test için demo sürümü mevcuttur Önerilen ayarlar
Zaman dilimleri: M30, H1, H4
Parite

Ultra Advanced Force Meter, trader'ın piyasa hareketlerinin gücünü ölçmesine yardımcı olmak üzere tasarlanmış, MetaTrader 4 için bir teknik göstergedir. Fiyatın okunmasına bir güç ölçüsü ekler. Ana özellikler
- Fiyat hareketlerinin gücüne odaklanır
- Bir hareketin arkasında güç olup olmadığını değerlendirmeye yardımcı olur
- Dört majör döviz paritesinde önerilir
- Kullanımı kolay
- Test için demo sürümü mevcuttur Önerilen ayarlar
Zaman dilimleri: M30, H1, H4
Pariteler: EUR/USD, AUD/USD, NZD/USD,

Ultra Advanced Zig Zag, MetaTrader 4 için bir Zig Zag göstergesidir. Zig Zag araçları, piyasanın ana dalgalarının daha kolay görülebilmesi için salınım tepelerini ve salınım diplerini birleştirir. Ana özellikler
- Piyasanın ana salınımlarını vurgular
- Daha yüksek tepeler ve daha düşük dipler gibi piyasa yapısını incelemeye yardımcı olur
- Fibonacci ve grafik formasyonu analizine hazırlık için kullanışlı
- Kullanımı kolay
- Test için demo sürümü mevcuttur Önerilen ayarlar
Zaman dilimleri: M30, H

Ultra Advanced MA Pro, MetaTrader 4 için bir hareketli ortalama göstergesidir. Bir trendin yönünü ve gücünü incelemek için hareketli ortalamaları kullanan trader'lara yöneliktir. Ana özellikler
- Hareketli ortalama tabanlı trend analizi
- Hâkim yönü belirlemeye yardımcı olur
- Dinamik destek ve direnç referansı olarak kullanılabilir
- Kullanımı kolay
- Test için demo sürümü mevcuttur Önerilen ayarlar
Zaman dilimleri: M30, H1, H4, D1
Pariteler: EUR/USD, USD/JPY, GBP/USD, USD/CHF, USD/CAD, AUD/USD

Ultra Advanced Points Line, trader'ın trend ve momentumu okumasına yardımcı olan, MetaTrader 4 için bir teknik göstergedir. Piyasanın mevcut aşamasını takip etmek için görsel bir yardımcı olarak tasarlanmıştır. Ana özellikler
- Piyasa aşamasını takip etmek için görsel yardımcı
- Destek, direnç ve fiyat hareketiyle birleştirilebilir
- M30'dan D1'e kadar zaman dilimleri için uygundur
- Kullanımı kolay
- Test için demo sürümü mevcuttur Önerilen ayarlar
Zaman dilimleri: M30, H1, H4, D1
Pariteler: EU

Ultra Advanced Alfa MA, MetaTrader 4 için bir hareketli ortalama göstergesidir. Hareketli ortalamalar fiyat hareketini yumuşatır ve trader'ın piyasanın temel yönünü görmesine yardımcı olur. Ana özellikler
- Trend okumada hareketli ortalama yaklaşımı
- Grafikte dinamik bir referans bölgesi olarak işlev görebilir
- Diğer sinyaller için filtre olarak kullanışlı
- Kullanımı kolay
- Test için demo sürümü mevcuttur Önerilen ayarlar
Zaman dilimleri: M30, H1, H4, D1
Pariteler: EUR/USD, USD/JPY, GBP/USD,

Ultra Advanced R1S1 Pivot, birinci direnç (R1) ve birinci destek (S1) seviyelerine odaklanan, MetaTrader 4 için bir pivot göstergesidir. Trader'a seans için derli toplu bir referans fiyat seti sunar. Ana özellikler
- R1 ve S1 pivot seviyelerine odaklanır
- En yakın pivot referanslarının kompakt görünümü
- Fiyat tepkilerinin nerede izleneceğini planlamaya yardımcı olur
- Kullanımı kolay
- Test için demo sürümü mevcuttur Önerilen ayarlar
Zaman dilimleri: M30, H1, H4, D1
Pariteler: EUR/USD, USD/JPY

Ultra Advanced Double MA, iki hareketli ortalamayla çalışan, MetaTrader 4 için bir hareketli ortalama göstergesidir. İki ortalamayı karşılaştırmak, bir trendin yönünü ve hızını incelemenin yaygın bir yoludur. Ana özellikler
- İki hareketli ortalama etrafında oluşturulmuştur
- Kısa vadeli ve daha uzun vadeli yönü karşılaştırmaya yardımcı olur
- M30'dan D1'e kadar trend analizi için uygundur
- Kullanımı kolay
- Test için demo sürümü mevcuttur Önerilen ayarlar
Zaman dilimleri: M30, H1, H4, D1
Parit

Ultra Advanced MACD Pro, MetaTrader 4 için MACD tabanlı bir göstergedir. MACD gösterge ailesi, fiyatın iki hareketli ortalaması arasındaki ilişki üzerinden momentumu incelemek için kullanılır. Ana özellikler
- Hareketli Ortalama Yakınsama/Iraksama (MACD) kavramına dayanır
- Trader'ın momentumdaki değişimleri takip etmesine yardımcı olur
- Trend ve fiyat hareketi analiziyle birleştirilebilir
- Kullanımı kolay
- Test için demo sürümü mevcuttur Önerilen ayarlar
Zaman dilimleri: M30, H1, H4, D1
Pari

Ultra Advanced Money Line, MetaTrader 4 için, fiyat grafiğinin altındaki ayrı bir pencerede osilatör tarzı bir çizgi gösteren bir teknik göstergedir. Ana grafiğe nesne eklemeden trader'ın fiyat davranışını okumasına yardımcı olur. Ana özellikler
- Ayrı bir pencerede osilatör tarzı çizgi
- Ana fiyat grafiğini temiz tutar
- Aynı grafikte diğer araçlarla birlikte kullanılabilir
- Kullanımı kolay
- Test için demo sürümü mevcuttur Önerilen ayarlar
Zaman dilimleri: M30, H1, H4, D1
Pariteler: EUR/USD,

Ultra Advanced AutoChannel, MetaTrader 4 için bir kanal göstergesidir. Adından da anlaşılacağı gibi, bir fiyat kanalını otomatik olarak göstermek üzere tasarlanmıştır; böylece trader, kanalı elle çizmeden piyasanın aralığını ve yönünü inceleyebilir. Ana özellikler
- Otomatik kanal analizi
- Fiyatın hareket ettiği aralığı görselleştirmeye yardımcı olur
- Elle çizim gerektirmez
- Kullanımı kolay
- Test için demo sürümü mevcuttur Önerilen ayarlar
Zaman dilimleri: M30, H1, H4, D1
Pariteler: EUR/USD,

Ultra Advanced All Pivot, MetaTrader 4 için bir pivot noktası göstergesidir. Pivot seviyeleri, piyasanın duraklayabileceği, dönebileceği veya aşabileceği referans fiyatları işaretler; bu araç da onları grafiğe getirir. Ana özellikler
- Pivot tabanlı destek ve direnç referans seviyeleri
- Fiyat tepkilerinin nerede izleneceğini planlamak için kullanışlı
- M30'dan günlük grafiğe kadar çalışır
- Kullanımı kolay
- Test için demo sürümü mevcuttur Önerilen ayarlar
Zaman dilimleri: M30, H1, H4, D1
Parit
Master head and shoulders patterns for better trading decisions A head and shoulders pattern is a chart formation that resembles a baseline with three peaks, the outside two are close in height and the middle is highest. It predicts a bullish-to-bearish trend reversal and is believed to be one of the most reliable trend reversal patterns. It is one of several top patterns that signal, with varying degrees of accuracy, that a trend is nearing its end. [ Installation Guide | Update Guide | Trouble
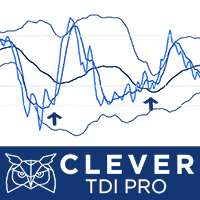
Description: The indicator shows the TDI indicator in a separate window, and with the RSI component, the indicator finds possible divergences with M or W patterns. KEY LINKS: How to Install - Frequent Questions - All Products Functions: Finds Market Makers patterns. Finds extremes or exhaustion into the market. Looks for a trend continuation. Content: TDI Indicator Divergence and M or W Signals Note 1: This indicator should only be considered as a part of any trading strategy. You shoul
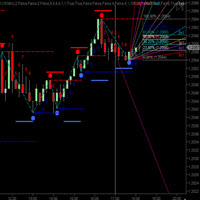
CycleTraderPro CycleWave Indicator is 9 indicators in 1. It uses the CycleTraderPro Indicators and Patterns to identify Cycles and more in real time. The 9 parts of CycleWave: Plots Cycle Bands and confirm Cycle High / Lows in real time after each successful cycle high or low. Plots Cycle Wave Price Windows above and below each bar using a modified % range of the previous bar. Automatically plots the Fibonacci Retracement from cycle low and highs after each cycle. Automatically plots Gann Fan
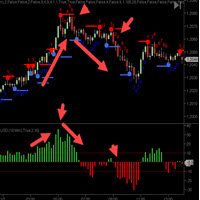
The C ycleTraderPro Close Strength Value Indicator measures the distance from the OPEN of a new bar to the CLOSE of that bar. Input - length = 10 default We add these values together going back the the length setting. If the 1st bar was plus 10 ticks and then the next bar was minus 7 ticks, then this would register +3
There are 2 ways to trade Close Strength Value: 1. Trading in the direction of lower highs and lower lows and vice versa for buys, higher highs, and higher lows. 2. Trade when the
FREE

ZhiBi Fast Scalp is a good fast scalping index system. The signal is oscillated according to the trend, and the Buy and Sell signals are frequently given. Suitable for all market varieties and time periods.
The up arrow appears to place the order Buy; the down arrow appears to place the order Sell;
Parameter setting description: [Signal_line_period]: The average period of the small cycle signal line. [Trend_line_period]: The average period of the large cycle trend line. [Alert_No_Off]: Open or
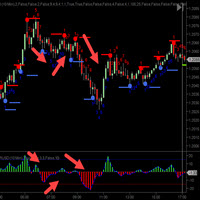
The CycleTraderPro Tick Momentum measures the number of ticks the market moves in the direction of consecutive closes. When the market makes a close above its over, it will start to count in the direction how many ticks it moved. If the next bar is in the moves and closes in the same direction, the Tick Momentum will continue to count up until the market closes below it's open. It will then start to count down in that direction. You can see these moves in a detrend fashion with the zero point be
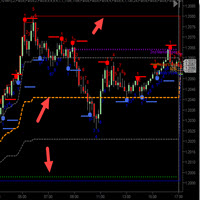
The CycleTraderPro Open/High/Low/Medium OHL takes the low and the high of the day and plots these values: 1. High of the day (Red Line)
2. Low of the day (Blue Line)
3. 25% from the low (Gray Line)
4. 50% of the range (Orange Line)
5. 75% from the low (Gray Line) We look to be long above the 50% range and short below You can easily see these levels as the market moves. If the market makes a new low or high, all the values will move automatically with the market's day. You can adjust these levels
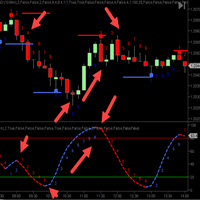
The CycleTraderPro Power Play Indicator (PPI) - is one of our favorite indicators. We take all the CT Indicators and combine them into one indicator. The entire selection of indicators come with On/Off functions which means you can pick your own mix of indicators and only plot this mix. We take an average of the mix chosen. When selecting 5 indicators, PPI will divide the mix values by 5. We then plot a cycle count for the direction of each move to help time you entry and exit plans. Red is do
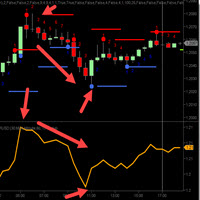
The CycleTraderPro Orange Line - Bressert DDS - DoubleStoch - My father, Walter Bressert made these DDS famous for years. They work with code from stochastic and then smooths them out one more time using just 1 line. Depending on the length of the indicators, longer being for more trends and shorter for scalping the markets, the Orange Line is a 100 length. There are 2 ways to trade the Orange Line: 1. Trade above and below the 50 level in the same direction. Above is a buy, below is a sell and
Revolution Martingale Pro
indicator for binary options!
at the time of opening and the appearance of the signal!
Blue diamond is shopping up.
A red diamond is an option down.
The indicator is already set to trade in binary options. ----------- protection is set against hitting on (steps - martingale knees) protection of several minuses under the row. ------------------------------------------- (Redrawing possible)

Alarm arrow indicator of increased sensitivity After closing the candle the arrows do not disappear Allows you to enter the transaction on time at the lowest price movements Can be used on any currency pairs, metals and cryptocurrency Suitable for working with binary options Distinctive features Does not redraw; Determines the price correction; Advanced settings for fine tuning; Works on all timeframes and on all symbols; Suitable for trading currencies, metals, options and cryptocurrency (Bitco
The original multi-indicator suite from JoaquinTrading specifically geared towards binary options, including regulated exchanges such Nadex, Cantor Exchange, and other binary option brokers.
The Probability Tool Suite Classic will provide the given win/loss outcome probabilities of up to 10 strike levels, a specific expiration duration, based on a particular indicator's parameters and derivative behavior (i.e. expiry, touch, touch & retrace). Using this indicator will give users an idea if a p
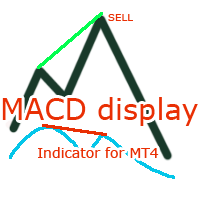
MACD Display is a MACD disaplay and cross monitoring indicator,which can works on 6 timeframe at same time. Indicator advantage: 1. Deviation from the point can be drawn on the main picture and indicator drawing. It is convenient to observe and can be hidden or displayed by parameter setting. 2. Deviation from the entry point is clearly indicated by the arrow in the drawing. 3. Cross-cycle monitoring can simultaneously monitor the MACD deviation and the golden dead fork of the six-cycle framewor

FZR indicator determines fractal zigzag reversal pattern of all the time frames of the chosen symbol and shows the information in the Info label. Indicator draws the detected pattern in the chosen time frame and also you can select in the menu to draw the trend line according to FZR peaks. What it is FZR? See the first picture in the screenshots. As you can see for every peak of FZR the AO indicator must cross zero line. FZR indicator determines the trend direction.
How to use FZR for trading?
FREE
Indicator for effective binary options trading.
Complete lack of redrawing The arrow indicates the direction of the next candle and the possible direction.
signal accuracy. Complete lack of redrawing. works great with support and resistance levels
it has an alert, it can be turned on or off in the settings
the accuracy of this tool is perfect
All successful trading.
Also see my other indicators

iVolX indicator horizontal volumes for all time periods
Main settings of the indicator: VolumeSource - select data for volumes (tick or real) PeriodMinutes - selection period for rendering of volumes PeriodsNumber - number of periods to show on the chart StartDate - the start date of the calculations ClusterPoints - cluster width Color - color MaxVolColor - maximum volume color ValueArea - the value of the zone of balance ValueAreaColor - color of the balance zone MaxVolFontSize - fon
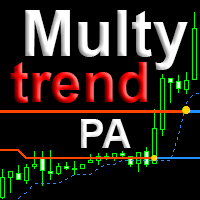
The indicator combines the principles of Price Action and a unique filtering algorithm with feedback for the three movings, this allows you to determine the pivot points and the current trend on any timeframe with a high probability. MultyTrend PA is an evolution of the Trend PA indicator and can be used on the principle of the three Elder screens, with everything you need is displayed on the same graph. Line 1 fast moving, Line 2 main moving, Line 3 - slow moving to determine the direct

indicator for binary options! open a deal only for 1 - candle The indicator is already set to trade in binary options. The indicator is ideal for trading on martingale since he very accurately combines what the next candle will be if you are trading in a martingale money management, this is the indicator that you were looking for; it is just created for you and your trading style p.s it is much better than relying on the color of the candle as some not very experienced traders do (therefore, the
This indicator is based on the previous option ( https://www.mql5.com/ru/market/product/37376 ) and includes all completions at the time of creation. Availability of additional data allows to understand more deeply the principle of work as this indicator and original. Points on extrema of bars show history of a portrayal of extrema as before. Levels of a reverse show as far as the price for formation of a new shoulder has to deviate. The Price noise parameter has a special impact (the name "devi
Mr Pip Scalping Indicator
is a momentum indicator that measures the magnitude of recent price changes to evaluate overbought or oversold conditions in the price of a stock or other asset with few major tweaks. This is NOT RSI. Features V2: Added Supply/Demand Filter
You can select which zone to see on the chart ( Important Resistance/Support; Verified Resistance/Support; etc ). You get alerts when prices is entering on a specific supply/demand zone. How to use? When the signal comes, you will
Trend Lines Cross This indicator will alert you on any cross of a Trendline. You can draw up to two trend lines and form a channel, a pennant , a triangle or a simple trend and when the price crosses either trend line the indicator will provide you with alerts that you define plus an up or down arrow when the cross happened. How to: Draw the 1st trendline and name it tl1. Draw the 2nd trendline and name it tl2. Select which type of alerts you would like in the indicator properties and you a
FREE

Nygma Binary Options is a momentum indicator that measures the magnitude of recent price changes to evaluate overbought or oversold conditions in the price of a stock or other asset with few major tweaks. This is NOT RSI.
Features V3: Added Supply/Demand Filter: You must add your own S/R indicator .
You get alerts when prices is entering on a specific supply/demand zone. How to use the S/R Filter? Load the Nygma_Mod.ex4 into the chart, after that load your S/R indicator on the chart. In order

Platinum FX индикатор для скальпинга. идеально подходит для торговли бинарными опционами.
работает на всех валютных парах мультитаймфреймовый.
когда появляемся красная стрелка мы покупаем когда появляемся красная мы продаем.
он должен был достичь успеха в трейдинге. Полное отсутствие перерисовки. Точность сигнала. точность данного инструмента можете увидеть в тестере Всем удачных торгов By Lilyyy

TT Arrows is a trend based indicator that very succesfully predicts the start of the new trend. The indicator is working with all trading instruments and in M5, M15, H1 and H4 timeframes. Up arrow signals a good time to enter a bullish trade while down arrow signals a good time to enter a bearish trade. The trade should be taken when the candle that has the arrow is closed. Following this strategy you will have have a high percentage of winning trades. Enjoy!
MetaTrader platformunun uygulama mağazası olan MetaTrader Mağazasından bir alım-satım robotunun nasıl satın alınacağını öğrenin.
MQL5.community Ödeme Sistemi, PayPal, banka kartları ve popüler ödeme sistemleri aracılığıyla yapılan işlemleri destekler. Daha iyi bir müşteri deneyimi için satın almadan önce alım-satım robotunu test etmenizi şiddetle tavsiye ederiz.

Alım-satım fırsatlarını kaçırıyorsunuz:
- Ücretsiz alım-satım uygulamaları
- İşlem kopyalama için 8.000'den fazla sinyal
- Finansal piyasaları keşfetmek için ekonomik haberler
Kayıt
Giriş yap
Web sitesi politikasını ve kullanım şartlarını kabul edersiniz
Hesabınız yoksa, lütfen kaydolun