 MetaTrader 5
 Uzmanlar
 Göstergeler
 Komut dosyaları
 Kütüphaneler
 Depo
DepoFan sayfamıza katılın

SAX Forecaster - MetaTrader 5 için gösterge

- Görüntülemeler:
- 22
- Derecelendirme:
- Yayınlandı:
-
 Alım-satım fırsatlarını kaçırıyorsunuz:
- Ücretsiz alım-satım uygulamaları
- İşlem kopyalama için 8.000'den fazla sinyal
- Finansal piyasaları keşfetmek için ekonomik haberler
Kayıt Giriş yapWeb sitesi politikasını ve kullanım şartlarını kabul edersiniz
Hesabınız yoksa, lütfen kaydolun -
 Bu koda dayalı bir robota veya göstergeye mi ihtiyacınız var? Freelance üzerinden sipariş edin
Freelance'e git
Bu koda dayalı bir robota veya göstergeye mi ihtiyacınız var? Freelance üzerinden sipariş edin
Freelance'e git
Genel Bakış
Grafiği okumak için geliştirdiğimiz hemen hemen her araç, sayılar dünyasında kalır. Bu araç ise bu dünyadan çıkar. 2003 yılında Jessica Lin, Eamonn Keogh ve meslektaşları tarafından tanıtılan Sembolik Toplam Yaklaşımı (SAX), bir fiyat aralığını alır ve onu bddcbbba gibi kısa bir harf dizisine dönüştürür. Piyasanın bir parçası bir kelimeye dönüştüğünde, bilgisayar biliminin metinlerle yapmayı bildiği her şeyi bu kelimeye uygulayabilirsiniz: eşleştirmek, saymak, hashlemek, aramak.
Bu yayın, bunu pratik bir soruya uyguluyor: Piyasa şu anda böyle davranıyor; daha önce ne zaman benzer bir davranış sergilemişti ve ardından ne olmuştu? Gösterge, mevcut aralığı kodlar, geçmişte benzer şekle sahip aralıkları bulmak için geçmişi tarar, her eşleşmenin bilinen geleceğini okur ve sonuçta ortaya çıkan dağılımı, arkasındaki istatistikleri raporlayan bir değerlendirme paneli ile birlikte grafikte bir tahmin konisi olarak çizer.
Dönüşümün kendisi üç adımdan oluşur ve her birinin bir nedeni vardır:
- Pencereyi Z-normalleştirin, böylece geriye sadece saf şekil kalır. EURUSD'deki bir yükseliş ve altındaki bir yükseliş, aynı şekilde yükseliyorsa aynı normalleştirilmiş eğriye karşılık gelir.
- Parça Parça Toplam Yaklaşımı: Normalleştirilmiş pencereyi w eşit parçaya bölün ve her birini ortalamasıyla değiştirin. w = 8 olan 48 çubukluk bir pencere sekiz sayıya dönüşür; bu, süreç boyunca gürültüyü düzeltmeye yarayan bir boyut azaltma işlemidir.
- Ayrıklaştırma: Standart normal dağılımı eşit olasılıklı bantlara ayıran kesme noktalarını kullanarak her segment ortalamasını bir harfe eşleştirin; böylece her harfin a priori eşit olasılığı olur.

SAX iş akışı: pencereyi z-normalleştirin, hücrelere göre ortalamasını alın, ardından her hücreyi Gauss kırılma noktaları kullanarak bir harfe eşleyin.
SAX aramasını sadece hızlı olmaktan öte mantıklı kılan şey, z-normalleştirilmiş seriler arasındaki gerçek Öklid mesafesinin kanıtlanabilir bir alt sınırını oluşturan, iki kelime arasındaki mesafe olan MINDIST' tir. Gerçek mesafeyi her zaman sadece daha az gösterebileceğinden, gerçek bir eşleşmeyi eleme riski olmaksızın adayları elemek için kullanılabilir. İşte bu, burada iki aşamalı aramayı mümkün kılan şeydir: önce ucuz kelime mesafesiyle eleme yapın, ardından kalanları gerçek Öklid mesafesine göre sıralayın. Yayınlanan doğrulama sistemi, bu iş akışının brute force yöntemiyle tam olarak aynı eşleşmeleri döndürdüğünü ve aynı zamanda iş yükünün büyük bir kısmını atladığını teyit etmektedir.
Göstergenin Çizdiği Şey
İki nesne; her ikisi de yeni bir çubuk kapandığında yeniden oluşturulur.
Yelpaze konisi, son kapanan çubuktan itibaren analogların ileriye dönük dağılımını geleceğe yansıtır. Kesintisiz çizgi her adımda medyan ileriye dönük hareketi gösterirken, üstündeki ve altındaki noktalı çizgiler sırasıyla 25. ve 75. yüzdelik dilimleri gösterir; böylece, önceki veriler arasındaki uyum azaldıkça koni genişler. Adım başına dağılım ATR birimlerinde tutulur ve mevcut ATR ile çarpılarak gerçek fiyat eksenine yerleştirilir; bu sayede sakin ve dalgalı dönemlere ait önceki veriler aynı koniye katkıda bulunabilir. Koni yalnızca kararın yükseliş veya düşüş yönünde olduğu durumlarda çizilir; dolayısıyla koninin olmaması, bir görüntüleme hatası değil, başlı başına bir bilgidir.
Karar paneli, koninin gizlediği rakamları gösterir:
| Satır | Ne Anlam İfade Ediyor |
|---|---|
| kelime | Mevcut pencerenin SAX kodlaması, aramanın gerçekte üzerinde çalıştırıldığı sorgu. |
| analoglar | Kaç tane eşleşen örnek bulundu ve bunların ortalama eşleşme mesafesi nedir? Düşük ortalama mesafeye sahip çok sayıda eşleşme, az sayıda yakın eşleşmeden daha zayıf bir durumdur. |
| fwd H | Ufuk çizgisi üzerindeki ileriye doğru hareketin medyanı, ATR katları ve yüzde olarak. |
| bant | Bu ileriye doğru hareketlerin 25. ile 75. persentil aralığı: sayısal olarak ifade edilen koninin genişliği. |
| yükselme oranı | Hiçbir şekilde yükseliş gösteren emsallerin oranı ve dağılımı. %51'lik bir yükseliş oranına dayanan bir medyan, bir emsalin şans eseridir, bir eğilim değildir. |
| SONUÇ | Yükseliş eğilimi, düşüş eğilimi, belirgin bir eğilim yok, çok az benzer örnek veya veri yok. |
Karara varmak kasıtlı olarak zorlaştırılmıştır. Önce benzer örneklerin çok az olduğu karar verilir, ardından yazı tura durumu değerlendirilir ve yalnızca her iki ikna bandını da geçen bir örnek bir yön alır: medyan hareket, ATR açısından avantaj eşiğini aşmalı ve yükseliş oranı 0,5 civarındaki bandı terk etmelidir. Herhangi birinde başarısızlık olursa, medyan ne derse desin cevap "avantaj yok" olur.
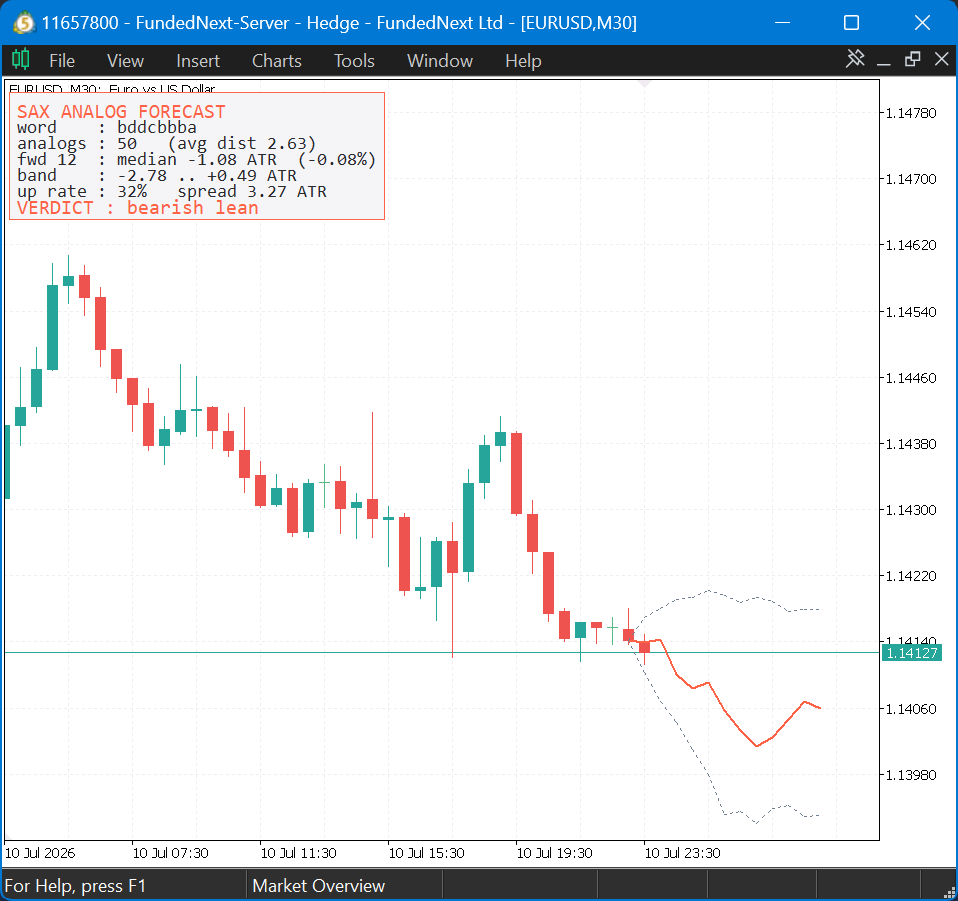
EURUSD, M30 için tahminci: benzer örneklerin medyanını ve çeyrekler arası aralığını gösteren yelpaze konisi ile arkasındaki örneği raporlayan karar paneli.
Temel Özellikler
Tasarımdan gelen dürüstlük
- İleriye bakma yok. Bir eşleşmenin sonuç penceresi, sorgu penceresi başlamadan önce kesinlikle sona ermelidir; böylece sorgunun kendi geleceğinden hiçbir şey, önceki örnekler kümesine sızamaz. Bu, analog aramayı eğri uydurmadan ayıran tek koruma mekanizmasıdır.
- ATR ile normalleştirilmiş sonuçlar. İleriye dönük hareketler, maç anında geçerli olan ATR'nin katları olarak ifade edilir; böylece sakin bir dönemden gelen bir öncül ile şiddetli bir dönemden gelen bir öncül, karşılaştırılabilir bir zeminde yer alır. Bu, z-normalleştirmenin göz ardı ettiği unsurları telafi eder.
- "Hayır" diyebilen bir karar. Örneklem çok küçük olduğunda veya her iki ölçütte de eğilim kesin olmadığında, araç tahmini saklar ve koniyi gizler.
Yaklaşık bir kütüphane değil, gerçek bir SAX kütüphanesi
- Z-normalleştirme, pencere uzunluğunun kelime uzunluğuna eşit olarak bölünmediği kesirli durumları da içeren PAA, Acklam'ın probit yöntemi ile Gauss kırılma noktaları, kodlama ve gerçek mesafeyi kanıtlanabilir şekilde alt sınırlayan bir MINDIST. Bunların hiçbiri daha önce platformda mevcut değildi.
- 2'den 10'a kadar alfabe boyutları desteklenir; kırılma noktaları yapılandırma sırasında bir kez oluşturulur ve önbelleğe alınır.
- Düz bir pencere, sessizce kodlanmak yerine düz olarak rapor edilir: standart sapmanın sıfıra yakın olması durumunda normalleştirilecek bir şekil yoktur ve bir şekil uydurmak anlamsız bir kelime üretir.
- Bir brute-force Öklid metriği, üretim boru hattıyla birlikte bir anahtar olarak sunulur; böylece budama işlemi, güvenilir olduğu varsayılmak yerine, yeniden üretmesi beklenen cevapla karşılaştırılarak kontrol edilebilir.
Canlı grafikte pratik
- Arama, her tick başına değil, kapanan her çubuk başına bir kez çalışır ve geçmişi 1. çubuktan okur; böylece oluşmakta olan çubuk ne sorguya ne de önceki kümeye girer.
- Panel kutusunun boyutu, gerçekte görüntülenen metne göre belirlenir; böylece hiçbir yazı tipi boyutu veya içerik kesilmez ve her iki grafik arka planında da okunabilmesi için açık ve koyu temalar sunulur.
- Her grafik nesnesi ortak bir önek taşır ve deinit sırasında kaldırılır; böylece geride hiçbir yetim nesne kalmaz.
Önerilen Kurulum
| Ayar | Önerilen değer | Not |
|---|---|---|
| Sembol | Herhangi bir likit enstrüman | Şekil eşleştirme, yapısı gereği ölçekten bağımsızdır. Geliştirme ve ekran görüntüsünde EURUSD kullanılmıştır. |
| Zaman aralığı | M30 ila H4 | Önceki verilerin anlamlı olabilmesi için yeterli geçmiş verisi gerekir. Pencere, ufuk ve geçmiş taraması bar cinsinden ölçülür, bu nedenle zaman dilimleri arasında değişmeden aktarılır. |
| Geçmiş Veriler | 6000 çubuk | Varsayılan tarama derinliği. Daha fazla geçmiş verisi, daha fazla emsal ve daha sağlam bir dağılım anlamına gelir; bunun karşılığında arama süresi doğrusal olarak artar. |
| Panel teması | Grafiğinize uyarın | Varsayılan olarak koyu. Beyaz bir grafikte açık temaya geçin, aksi takdirde ana metin okunmaz. |
Dosya Yapısı
Bir gösterge ve iki başlık. Başlıklar <SAX\...> olarak eklenir, bu nedenle kendi SAX alt klasörlerinde bulunmalıdır.
| Dosya | Rol | Açıklama |
|---|---|---|
| Include\SAX\SAXTransform.mqh | Dönüşüm | Z-normalleştirme, PAA, Gauss kırılma noktaları, kelime kodlaması ve alt sınır MINDIST. Grafiklere veya ticarete bağlı olmaksızın herhangi bir seride yeniden kullanılabilir. |
| Include\SAX\SAXAnalogs.mqh | Arama | İki aşamalı budama-sonra-sıralama eşleştirme, ileriye bakmama koruması, ATR ile normalize edilmiş sonuçlar, koninin arkasındaki adım başına dağılım ve karar sınıflandırması. |
| Göstergeler\SAX\SAXAnalog.mq5 | Gösterge | Her yeni çubukta aramayı çalıştırır ve tahmin yelpaze konisini ile karar panelini çizer. Tamponlara hiçbir şey çizmez; hepsi grafik nesneleridir. |
Giriş Parametreleri
| Giriş | Varsayılan | Neye etki eder |
|---|---|---|
| InpWinLen | 48 çubuk | Sorgu penceresi uzunluğu: Bir çubuğun öncül olarak sayılması için son şeklin ne kadarının eşleşmesi gerektiği. |
| InpHorizon | 12 çubuk | Tahmin ufku: Sonucun, her bir öncülün bilinen geleceğinin ne kadar ilerisine kadar ölçüldüğü ve koninin ne kadar uzağa uzandığı. |
| InpWordLen, InpAlphabet | 8, 4 | SAX çözünürlüğü. Daha uzun kelimeler ve daha geniş alfabeler daha ince ayrım yapar ve bu nedenle daha az sıklıkla eşleşme sağlar; daha kısa ve daha kaba olanlar ise daha gevşek benzerliğe sahip daha fazla öncül toplar. |
| InpMaxAnalogs, InpMinAnalogs | 50, 10 | Tutulacak en yakın emsallerin sayısı ve bu az sayıdaki emsallerin ne söylediğine bakılmaksızın kararın "çok az" olarak değerlendirilmesine neden olan minimum örnek sayısı. |
| InpEdgeATR | 0,25 | Karar eşiği: İleriye dönük hareketin medyan değeri, bir eğilim olarak kabul edilebilmesi için ATR'nin dörtte birini aşmalıdır. |
| InpMetric | MINDIST | Üretim ayarı olan iki aşamalı "budama-sıralama" iş akışı. Her aday üzerinde brute force uygulamak için Euclid'e geçin: aynı sıralama, budama yok; doğruluk ve hız açısından bir referans noktası olarak kullanışlıdır. |
| InpATRPeriod | 14 | Sonuçları normalleştirmek ve koniyi fiyat eksenine ölçeklendirmek için kullanılan ATR. |
| InpMaxHistory | 6000 çubuk | Önceki verileri taramak için geriye doğru ne kadar gidileceği. |
| Renkler, köşe, tema | Mavi / kırmızı / gri, sol üst, koyu | Karara göre koni ve panel vurgu renkleri, şerit çizgisi rengi, panelin sabit köşesi ve açık veya koyu tema. |
Araştırma Temeli
Uygulama, makaleleri bir araya getiren SAX sayfası ile Jessica Lin, Eamonn Keogh ve meslektaşları tarafından yapılan orijinal SAX çalışmasını takip eder.
SAX, fiyatlar konusunda bir kristal küre değildir ve bu araç, diğer sonuçlardan daha sık "kenar" sonucunu rapor etmez. Değeri, birçok gerçek emsalin aynı yönde olduğu nadir ve sağlam temelli durumlarda ve aksini iddia etmeyi reddeden bir aracın disiplininde yatmaktadır. Aynı kütüphane, daha ileri çalışmalar için de fırsat sunar: Makine öğrenimi modeli için kategorik özellikler olarak SAX kelimeleri, anomali tespiti için motif ve uyumsuzluk keşfi veya kelime sözlüğü üzerinde bir Markov geçiş modeli.
Eşlik eden bir makale, dönüşümü ve alt sınırı türetir, arama sürecini ve koruma mekanizmalarını adım adım açıklar ve doğrulama testlerinin başarılı olduğunu gösterir: MQL5’te Sembolik Toplam Yaklaşımı (SAX): Tarihsel Analog Arama ve Tahmin.
MetaQuotes Ltd tarafından İngilizceden çevrilmiştir.
Orijinal kod: https://www.mql5.com/en/code/75543
Trade Journal and Performance Analytics Dashboard
Kapalı işlem geçmişinizi okuyan ve kazanma oranını, kâr faktörünü, galibiyet serilerini ve sermaye eğrisini gösteren, hafif ve grafik üzerinde yer alan bir gösterge paneli — strateji girdisi gerekmez, sadece kendi verileriniz kullanılır ve veriler otomatik olarak güncellenir.
Order Block Detector
Detects order blocks — the last opposing candle before an impulsive move that breaks market structure — and draws them as zones that extend live until price returns and mitigates them. Structure breaks and mitigation are both evaluated only on closed bars, so nothing repaints.
Change in State of Delivery
Concept: Identifies market microstructure turning points based on ICT/SMC principles.
 Session Range Desk MT5
Session-range breakout EA with ATR filtering, stop-distance sizing, optional break-even/partial close, and a shared chart desk. Hedging accounts; educational source with documented execution and coordination limits.