 MetaTrader 5
 Uzmanlar
 Göstergeler
 Komut dosyaları
 Kütüphaneler
 Depo
DepoFan sayfamıza katılın

Trade Journal and Performance Analytics Dashboard - MetaTrader 5 için gösterge

- Görüntülemeler:
- 15
- Derecelendirme:
- Yayınlandı:
-
 Alım-satım fırsatlarını kaçırıyorsunuz:
- Ücretsiz alım-satım uygulamaları
- İşlem kopyalama için 8.000'den fazla sinyal
- Finansal piyasaları keşfetmek için ekonomik haberler
Kayıt Giriş yapWeb sitesi politikasını ve kullanım şartlarını kabul edersiniz
Hesabınız yoksa, lütfen kaydolun -
 Bu koda dayalı bir robota veya göstergeye mi ihtiyacınız var? Freelance üzerinden sipariş edin
Freelance'e git
Bu koda dayalı bir robota veya göstergeye mi ihtiyacınız var? Freelance üzerinden sipariş edin
Freelance'e git
Ticaret Analitiği Kontrol Paneli
Arkasındaki fikir
Kod, basit bir fikre dayanmaktadır: işlem hesabınızda zaten dürüst bir performans raporu bulunmaktadır, tek yapmanız gereken bunu okumaktır. Geçmiş verileri bir elektronik tabloya aktarmak yerine, bu gösterge HistorySelect() ve HistoryDealGetTicket() işlevlerini kullanarak terminalin kendi kapalı işlem geçmişini sorgular, bunları toplar ve sonucu CCanvas sınıfı ile doğrudan grafiğin üzerine çizilen küçük bir panel olarak görüntüler. Fiyat analizi yapmaz ve tek bir emir bile açmaz, değiştirmez veya kapatmaz — yalnızca daha önce yaptığınız işlemleri okur, bu nedenle Otomatik İşlem iznine gerek yoktur.
Paneli nasıl yorumlamalı?
Paneldeki her satır, ayarladığınız geçmiş penceresi ne olursa olsun, ticaretinizle ilgili belirli bir soruyu yanıtlar:
- İşlemler (Nd) — geriye dönük zaman aralığı içinde kaç adet kapatılmış işlem bulunmaktadır. Birkaç işleme dayalı bir kazanma oranı veya kâr faktörü henüz anlamlı değildir; yaklaşık 30 işlemin altındaki her şeyi bir ön izleme olarak değerlendirin, kesin bir sonuç olarak değil.
- Kazanç oranı — başabaş noktasında veya üzerinde kapanan işlemlerin yüzdesidir (swap ve komisyon dahil). Tek başına, sistemin kârlı olup olmadığı hakkında hiçbir şey söylemez — büyük kazançlar içeren %30’luk bir kazanç oranı, yine de oldukça kârlı bir sistem olabilir.
- Kâr faktörü — brüt kârın brüt zarara bölünmesiyle elde edilen değerdir. 1,0'ın üzerinde olması, bu pencerede kârlı işlemlerin zararlı işlemlerden daha ağır bastığı anlamına gelir; 1,0'ın altında olması ise, kazanma oranının ne gösterdiğine bakılmaksızın tam tersi anlamına gelir.
- Net Kâr/Zarar — komisyon ve swap düşüldükten sonraki net sonuç; renk kodlu olduğundan, zararlı bir pencere bir bakışta görsel olarak hemen fark edilir.
- Kazanç serisi / Kayıp serisi — en son işlemden geriye doğru sayıldığında, arka arkaya kaç işlemin aynı şekilde kapandığı gösterir. Bir sistemin normal davranışından saptığını fark etmek için kullanışlıdır.
- En iyi sembol / En kötü sembol — pencere içindeki net sonuca en fazla ve en az katkıda bulunan enstrüman. Bir sembol diğerlerini sessizce finanse ediyorsa, bu durum burada ortaya çıkar.
- Sermaye eğrisi — pencere boyunca biriken net kar/zarar, tek bir rakamı okumadan bile eğilimin görülebilmesi için basit bir çizgi olarak gösterilir.
Bu rakamların hiçbiri işlem sinyali değildir. Bu panel, her baktığınızda şu soruyu dürüstçe yanıtlamak için vardır: Bu gerçekten işe yarıyor mu, yoksa sadece öyle mi hissediliyor?
Dış değişkenler (girdiler)
Her girdi, Girdiler sekmesinde Panel, Veri Kapsamı ve Renkler altında gruplandırılmıştır ve kodu düzenlemeden grafik başına değiştirilebilir:
| Girdi | Varsayılan | Amaç |
|---|---|---|
| InpCorner | Sol Üst | Panelin hangi grafik köşesine sabitlendiği. |
| InpOffsetX / InpOffsetY | 12 / 18 | Panelin o köşeden piksel cinsinden ofseti. |
| InpPanelWidth / InpPanelHeight | 300 / 250 | Panelin piksel cinsinden boyutu. |
| InpRefreshSecs | 5 | Tiklerden bağımsız olarak panelin geçmişi ne sıklıkla yeniden okuduğu ve yeniden çizdiği. |
| InpHistoryDays | 90 | İstatistiklere dahil edilecek kapalı işlem geçmişinin kaç günlük olacağı. |
| InpAllSymbols | true | true, hesapta işlem gören tüm sembolleri toplar; false, paneli yalnızca mevcut grafiğin sembolüyle sınırlar. |
| InpBackColor | koyu lacivert | Panelin arka plan rengi. |
| InpBorderColor | amber | Panel kenarlık rengi. |
| InpTextColor | kirli beyaz | Birincil etiket ve değer metin rengi. |
| InpAccentColor | kehribar | Panel başlık metninin rengi. |
| InpProfitColor | mavi | Pozitif net sonuç, galibiyet serisi ve yükselen sermaye eğrisi için kullanılan renk. |
| InpLossColor | kırmızı | Negatif net sonuç, kaybetme serisi ve düşen sermaye eğrisi için kullanılan renk. |
Önerilen kullanım
Bu bir göstergedir, Uzman Danışman değildir; bu nedenle belirli bir sembol veya zaman dilimine bağlı değildir — herhangi bir grafiğe eklediğinizde, o grafiğin fiyat verileri yerine hesabınızın geçmişini okur. Tek bir hesapta birden fazla sembolle işlem yapıyorsanız, genel bir görünüm elde etmek için InpAllSymbols seçeneğini açık bırakın veya belirli bir grafikte bu seçeneği kapatarak o enstrümanı tek başına değerlendirin.
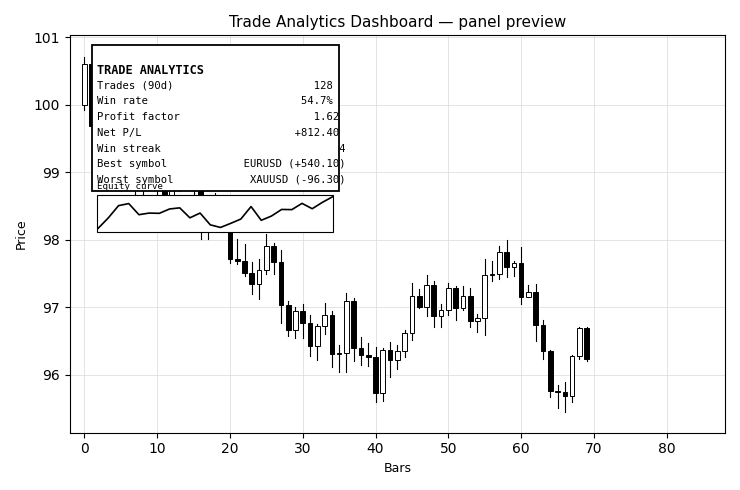
Şekil 1. Grafikte görünen panel: işlem sayısı, kazanma oranı, kâr faktörü, net kâr/zarar, mevcut galibiyet serisi, en iyi/en kötü sembol ve sermaye eğrisi sparkline. Code Base görsel yönergelerine uygun olarak siyah beyaz olarak gösterilmiştir.
MetaQuotes Ltd tarafından İngilizceden çevrilmiştir.
Orijinal kod: https://www.mql5.com/en/code/75553
Order Block Detector
Detects order blocks — the last opposing candle before an impulsive move that breaks market structure — and draws them as zones that extend live until price returns and mitigates them. Structure breaks and mitigation are both evaluated only on closed bars, so nothing repaints.
 PropFirmGuard
Equity guard that enforces a daily loss limit and a total drawdown limit, flattens the account on breach and blocks trading until the next daily reset. Includes the guard as a reusable include file plus a self-test expert that proves the behaviour in the strategy tester.
SAX Forecaster
Sembolik Toplam Yaklaşımı (SAX) yöntemiyle oluşturulmuş bir tahmin modeli
Change in State of Delivery
Concept: Identifies market microstructure turning points based on ICT/SMC principles.