 MetaTrader 5
 Experts
 지표
지표 스크립트
스크립트 라이브러리
라이브러리 보관함
보관함당사 팬 페이지에 가입하십시오

SAX Forecaster - MetaTrader 5용 지표

- 조회수:
- 10
- 평가:
- 게시됨:
-
 이 코드를 기반으로 한 로봇이나 지표가 필요하신가요? 프리랜스로 주문하세요
프리랜스로 이동
이 코드를 기반으로 한 로봇이나 지표가 필요하신가요? 프리랜스로 주문하세요
프리랜스로 이동

개요
차트를 분석하기 위해 우리가 만드는 거의 모든 도구는 숫자의 세계에 머물러 있습니다. 하지만 이 도구는 그 경계를 벗어납니다. 2003년 Jessica Lin, Eamonn Keogh 및 동료들이 소개한 SAX( Symbolic Aggregate approXimation )는 특정 기간의 가격 데이터를 가져와 bddcbbba와 같은 짧은 문자열로 변환합니다. 시장의 한 부분이 단어가 되면, 컴퓨터 과학이 텍스트에 대해 이미 수행할 줄 아는 모든 작업—일치시키기, 개수 세기, 해시 처리하기, 검색하기—을 그 단어에 적용할 수 있습니다.
이 논문은 이를 한 가지 실용적인 질문에 적용합니다: 현재 시장이 이런 움직임을 보이고 있는데, 과거에 언제 비슷한 움직임을 보였으며, 그 후 어떤 결과가 뒤따랐는가? 이 지표는 현재 구간을 인코딩하고, 과거 데이터에서 유사한 형태의 구간을 스캔하며, 각 일치 항목에 대해 알려진 미래 상황을 분석한 뒤, 그 결과로 도출된 결과 분포를 차트 상의 예측 팬 콘(fan cone) 형태로 표시하고, 그 배후의 통계를 보고하는 판정 패널을 함께 제공합니다.
변환 과정 자체는 세 단계로 이루어져 있으며, 각 단계에는 분명한 이유가 있습니다:
- 창을 Z-정규화하여 순수한 형태만 남깁니다. EUR/USD의 상승과 금 가격의 상승이 동일한 방식으로 발생한다면, 둘 다 동일한 정규화 곡선에 매핑됩니다.
- 구간별 집계 근사법: 정규화된 창을 w개의 동일한 구간으로 분할하고, 각 구간을 그 평균값으로 대체합니다. w = 8인 48봉 창은 8개의 수치로 변환되는데, 이는 차원 축소를 통해 과정에서 발생하는 노이즈를 완화하는 효과도 있습니다.
- 이산화: 표준 정규 분포를 확률이 동일한 대역으로 나누는 분할점을 사용하여 각 구간 평균을 문자로 매핑합니다. 따라서 모든 문자는 선험적으로 동일한 확률을 가집니다.

SAX 파이프라인: 윈도우를 z-정규화한 후, 셀별로 평균을 구하고, 가우시안 분할점을 사용하여 각 셀을 문자로 매핑합니다.
SAX 검색이 단순히 빠르기만 한 것이 아니라 합리적(sound)인 이유는 MINDIST 때문입니다. MINDIST는 두 단어 간의 거리로, z-정규화된 시계열 간의 실제 유클리드 거리를 증명 가능하게 하한으로 보장합니다. 실제 거리를 항상 과소평가할 수밖에 없기 때문에, 진정한 일치 항목을 제거할 위험 없이 후보를 걸러내는 데 사용할 수 있습니다. 이것이 바로 여기서 2단계 검색을 가능하게 하는 이유입니다: 계산 비용이 적은 단어 간 거리를 이용해 후보를 선별한 후, 남은 후보들을 실제 유클리드 거리에 따라 순위를 매깁니다. 공개된 검증 결과에서 이 파이프라인은 많은 작업 단계를 생략하면서도 무차별 대입 방식과 정확히 동일한 일치 결과를 반환함이 확인되었습니다.
지표가 보여주는 것
두 개의 객체로, 새로운 봉이 마감될 때마다 모두 재구성됩니다.
팬 콘(fan cone)은 마지막 종가 바를 기준으로 유사 사례들의 향후 분포를 미래로 투영합니다. 실선은 각 단계에서 예상되는 중간값의 향후 움직임을 나타내며, 위아래의 점선은 25번째 및 75번째 백분위수를 나타내므로, 선행 사례들 간의 일치도가 낮아질수록 콘은 넓어집니다. 각 단계별 분포는 ATR 단위로 유지되며, 현재 ATR에 곱해 실제 가격 축에 표시됩니다. 이를 통해 변동성이 적은 시기와 격동적인 시기의 선행 데이터가 동일한 원뿔에 반영될 수 있습니다. 원뿔은 강세 또는 약세 판정이 내려졌을 때만 그려지므로, 원뿔이 나타나지 않는 것 자체가 렌더링 오류가 아니라 하나의 정보입니다.
판단 패널은 원뿔이 가리고 있는 수치를 보여줍니다:
| 행 | 의미 |
|---|---|
| 단어 | 현재 창의 SAX 인코딩, 즉 검색이 실제로 실행된 쿼리입니다. |
| analogs | 발견된 선례의 수와 그 평균 일치 거리. 평균 거리가 나쁘면서 개수가 많은 경우보다, 개수는 적지만 일치도가 높은 경우가 더 유력한 사례입니다. |
| fwd H | 지평선 상의 앞으로 이동 중위값으로, ATR 배수 및 백분율로 표시됩니다. |
| band | 해당 전방 이동의 25~75번째 백분위수 범위: 수치로 나타낸 원뿔의 폭. |
| 상승률 | 상승한 선례의 비율 및 그 분포 범위. 51%의 상승 비율을 바탕으로 상승 쪽으로 기울어진 중앙값은 단순한 우연일 뿐, 명확한 경향을 나타내는 것은 아닙니다. |
| 판결 | 강세, 약세, 우위 없음, 유사 사례가 너무 적음, 또는 데이터 없음. |
판단은 의도적으로 얻기 어렵게 설정되어 있습니다. 먼저 유사 사례가 너무 적은지 여부를 판단하고, 그 다음 동전 던지기 수준으로 판단하며, 두 확신 구간을 모두 통과한 표본만이 방향성을 얻습니다: 중앙값 변동폭은 ATR 기준 우위 임계값을 초과해야 하며, 상승률은 0.5 전후의 구간을 벗어나야 합니다. 둘 중 하나라도 충족하지 못하면 중앙값이 어떻게 나오든 상관없이 ‘우위 없음’으로 판단됩니다.
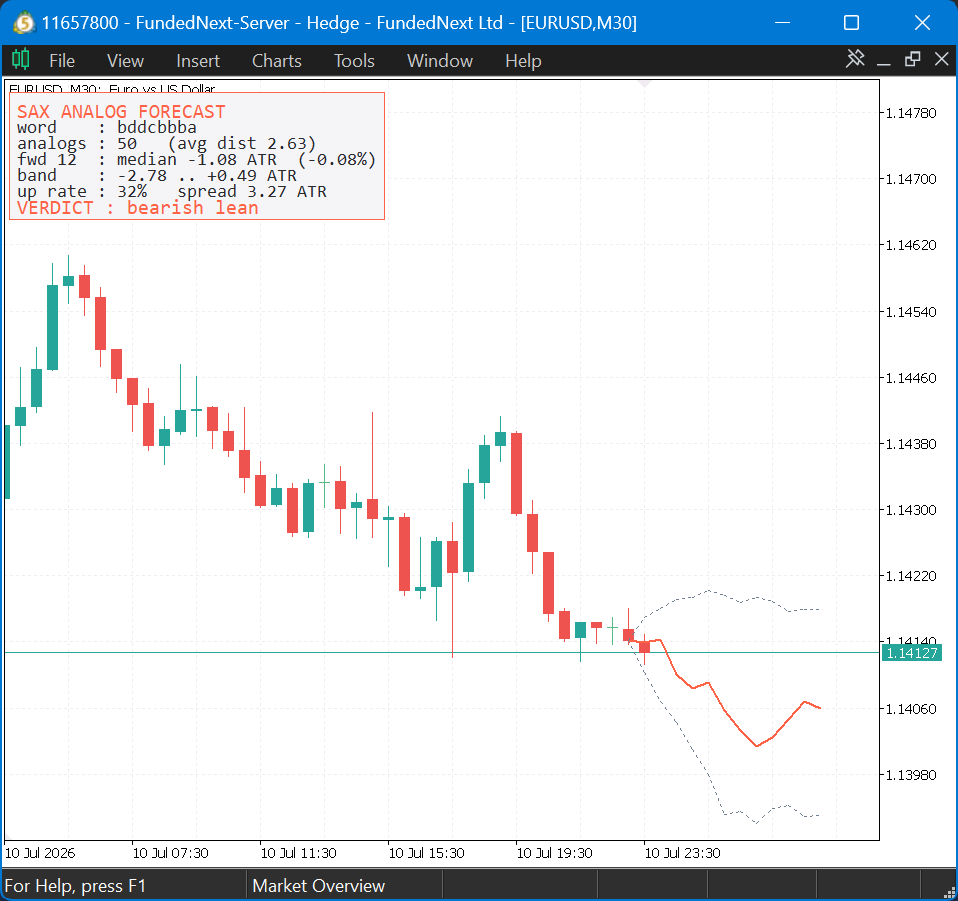
EURUSD, M30 차트의 예측 모델: 유사 사례들의 중앙값과 사분위수 범위를 투영한 팬 콘, 그리고 그 뒤에 위치한 샘플을 보고하는 판정 패널.
주요 특징
구조적 정직성
- 선행 정보 배제. 매치의 결과 창은 쿼리 창이 시작되기 전 반드시 종료되어야 하므로, 쿼리 자체의 미래 정보가 선례 집합으로 유출될 수 없습니다. 이것이 유사 사례 검색과 곡선 피팅을 구분하는 유일한 안전장치입니다.
- ATR로 정규화된 결과. 가격 변동 폭은 매치 시점에 적용되던 ATR의 배수로 표현되므로, 변동이 미미했던 기간의 선례와 변동이 격렬했던 기간의 선례가 동등한 기준으로 비교됩니다. 이는 z-정규화가 배제했던 요소를 보완하기 위한 조치입니다.
- '아니오'라고 말할 수 있는 판정. 표본 크기가 너무 작거나 두 지표 모두에서 경향성이 결정적이지 않을 경우, 이 도구는 예측을 보류하고 예측 범위를 표시하지 않습니다.
단순한 근사치가 아닌 진정한 SAX 라이브러리
- Z-정규화, 창 길이가 단어 길이로 정확히 나누어지지 않는 분수 경우를 포함한 PAA, Acklam의 프로빗을 통한 가우시안 분할점, 인코딩, 그리고 실제 거리의 하한을 증명할 수 있는 MINDIST. 이 중 어느 것도 이전 플랫폼에는 존재하지 않았습니다.
- 알파벳 크기는 2부터 10까지 지원되며, 브레이크포인트는 구성 시점에 한 번 생성되어 캐시에 저장됩니다.
- 평평한 윈도우는 묵인하여 인코딩하지 않고 그대로 평평하다고 보고됩니다. 표준 편차가 0에 가까우면 정규화할 모양이 없으며, 억지로 모양을 만들어내면 무의미한 단어가 생성되기 때문입니다.
- 무차별 대입 방식의 유클리드 메트릭이 프로덕션 파이프라인과 함께 스위치 형태로 제공되므로, 프루닝 결과를 단순히 신뢰하는 대신 재현해야 할 정답과 대조하여 검증할 수 있습니다.
실시간 차트에서 실용적
- 검색은 틱(tick) 단위가 아닌 마감된 봉(bar) 하나당 한 번씩 실행되며, 1번 봉부터 이력을 읽기 때문에 형성 중인 봉은 쿼리나 선행 집합에 절대 포함되지 않습니다.
- 패널 상자의 크기는 실제로 렌더링된 텍스트를 기준으로 결정되므로, 어떤 글꼴 크기나 콘텐츠에서도 잘리는 현상이 발생하지 않으며, 차트 배경에 상관없이 가독성이 좋도록 밝은 테마와 어두운 테마가 제공됩니다.
- 모든 차트 객체는 공통 접두사를 가지며, deinit 시 제거되어 고아 객체가 남지 않습니다.
권장 설정
| 설정 | 권장 값 | 비고 |
|---|---|---|
| 심볼 | 모든 유동성 상품 | 구조상 모양 매칭은 스케일에 구애받지 않습니다. 개발 과정과 스크린샷에는 EURUSD가 사용되었습니다. |
| 시간대 | M30 ~ H4 | 선례가 유의미하게 작용하려면 충분한 과거 데이터가 필요합니다. 창(window), 전망 기간(horizon), 과거 데이터 스캔(history scan)은 모두 바(bar) 단위로 측정되므로, 시간대 간에 변경 없이 그대로 적용됩니다. |
| 이력 | 6000 바 | 기본 스캔 깊이입니다. 과거 데이터가 많을수록 선례가 더 많아지고 분포가 더 확고해지지만, 검색 시간도 그에 비례하여 증가합니다. |
| 패널 테마 | 차트와 조화 | 기본값은 어두운 테마입니다. 흰색 차트에서는 밝은 테마로 전환해야 본문 텍스트가 잘 보입니다. |
파일 구조
지표 하나와 헤더 두 개로 구성됩니다. 헤더는 <SAX\...> 형식으로 포함되므로, 별도의 SAX 하위 폴더에 위치해야 합니다.
| 파일 | 역할 | 설명 |
|---|---|---|
| Include\SAX\SAXTransform.mqh | 변환 | Z 정규화, PAA, 가우시안 브레이크포인트, 워드 인코딩 및 하한 MINDIST. 차트나 거래에 의존하지 않고 모든 시계열에서 재사용할 수 있습니다. |
| Include\SAX\SAXAnalogs.mqh | 검색 | 2단계 ‘정리 후 순위 지정’ 매칭, 선행 분석 없는 가드, ATR 정규화 결과, 콘(cone)의 단계별 분포, 판정 분류. |
| Indicators\SAX\SAXAnalog.mq5 | 지표 | 새로운 각 막대마다 검색을 실행하고 예측 팬 콘과 판정 패널을 그립니다. 버퍼에는 아무것도 그리지 않으며, 모든 것이 차트 객체입니다. |
입력 매개변수
| 입력 | 기본값 | 제어 대상 |
|---|---|---|
| InpWinLen | 48 막대 | 쿼리 창 길이: 한 막대가 선행 사례로 간주되기 위해 최근 모양이 얼마나 일치해야 하는지. |
| InpHorizon | 12 바 | 예측 기간: 각 선행 사례의 알려진 미래 중 어느 시점까지 결과를 측정하며, 예측 범위가 어느 정도까지 확장되는지 나타냅니다. |
| InpWordLen, InpAlphabet | 8, 4 | SAX 해상도. 단어가 길고 알파벳이 많을수록 구별이 더 정교해지므로 일치 빈도가 낮아지며, 단어가 짧고 알파벳이 적을수록 유사성이 덜한 선례가 더 많이 수집됩니다. |
| InpMaxAnalogs, InpMinAnalogs | 50, 10 | 유지할 가장 유사한 선례의 수와, 그 수가 이 기준 미달일 경우 해당 소수의 내용이 무엇이든 상관없이 판정이 “너무 적음”으로 강제되는 최소 표본 수. |
| InpEdgeATR | 0.25 | 확신 임계값: 횡보 후 상승 움직임이 ATR의 1/4을 넘어야만 ‘경향성’으로 간주됩니다. |
| InpMetric | MINDIST | 실전 환경에서 사용되는 2단계 ‘전처리한 후 순위 매기기’ 파이프라인입니다. 모든 후보에 대해 무차별 대입(brute force)을 수행하려면 Euclid로 전환하십시오: 순위 매기기는 동일하지만 전처리가 없으며, 정확도와 속도 기준선으로 유용합니다. |
| InpATRPeriod | 14 | 결과를 정규화하고 콘을 가격 축에 맞춰 조정하는 데 사용되는 ATR. |
| InpMaxHistory | 6000 바 | 선례를 찾기 위해 얼마나 과거까지 검색할지 지정합니다. |
| 색상, 모서리, 테마 | 파란색/빨간색/회색, 왼쪽 상단, 어두운 테마 | 판결에 따른 원뿔 및 패널 강조색, 밴드 선 색상, 패널의 고정 모서리, 밝은 또는 어두운 테마. |
연구 근거
이 구현은 제시카 린(Jessica Lin), 이몬 키오(Eamonn Keogh) 및 동료들이 수행한 원본 SAX 연구를 따르며, 해당 연구팀의 SAX 페이지에는 관련 논문들이 수집되어 있습니다.
SAX는 가격을 예측하는 수정구슬이 아니며, 이 도구는 다른 결과를 보고하는 것보다 ‘에지(edge)’가 없다고 보고하는 경우가 더 많을 것입니다. 이 도구의 가치는 수많은 확실한 선례가 같은 방향으로 기울어지는 드물고 근거가 탄탄한 경우에 있으며, 그렇지 않은 척하지 않는 도구의 엄격함에 있습니다. 이 라이브러리는 추가 연구를 유도합니다: 머신러닝 모델을 위한 범주형 특징으로서의 SAX 단어, 이상 탐지를 위한 모티프 및 불일치 발견, 또는 단어 사전을 기반으로 한 마르코프 전이 모델 등이 있습니다.
관련 논문에서는 변환식과 하한을 도출하고, 검색 과정과 그 조건들을 단계별로 설명하며, 검증 테스트를 통과하는 모습을 보여줍니다: MQL5의 기호적 집계 근사법(SAX): 역사적 유사성 검색 및 예측.
MetaQuotes Ltd에서 영어로 번역함.
원본 코드: https://www.mql5.com/en/code/75543
Trade Journal and Performance Analytics Dashboard
마감된 거래 내역을 분석하여 승률, 수익 계수, 연승 기록, 자산 곡선을 보여주는 가벼운 차트 내 대시보드입니다. 별도의 전략 설정이 필요 없으며, 사용자의 실제 데이터만 반영되어 자동으로 업데이트됩니다.
Order Block Detector
Detects order blocks — the last opposing candle before an impulsive move that breaks market structure — and draws them as zones that extend live until price returns and mitigates them. Structure breaks and mitigation are both evaluated only on closed bars, so nothing repaints.
Change in State of Delivery
Concept: Identifies market microstructure turning points based on ICT/SMC principles.
 Session Range Desk MT5
Session-range breakout EA with ATR filtering, stop-distance sizing, optional break-even/partial close, and a shared chart desk. Hedging accounts; educational source with documented execution and coordination limits.