|
2 года
опыт работы
|
6
продуктов
|
1
демо-версий
|
|
0
работ
|
0
сигналов
|
0
подписчиков
|
An MQL5 indicator forecasts where a movement is likely to terminate and how far the opposite leg has typically traveled, using statistics from completed moves on the same symbol and timeframe. It detects confirmed pivots, takes a single snapshot, selects similar historical observations, and reads entry, stop loss, and take profit from their distributions. Empirical hit rates come from a chronological replay without look‑ahead, and resolved forecasts leave the chart with an option to review them.
This article turns the Part 1 evidence into a working MQL5 Expert Advisor. It formalizes entry conditions, designs direction-aware stop loss and take profit, and stress-tests the combined logic before coding, with every rule linked to measured features. Readers receive a reproducible implementation with configurable inputs and per-bar execution consistent with the study.
This article implements a multi‑timeframe Granger causality monitor for MetaTrader 5. A Jupyter notebook tests predefined timeframe pairs, selects lags, applies multiple‑testing control, and exports a calibration table. An MQL5 Expert Advisor reloads the setup, recomputes the F‑test live on rolling windows, and marks pairs VALID/INVALID to gate its vote‑based BUY/SELL generator. The workflow shows alignment rules, live/offline parity, and a filtered vs unfiltered comparison on EURUSD.
An evidence-first workflow for Range Breakout in MQL5: a non-trading logger captures session/time windows and records 61 fields per breakout to CSV, with a strict split between entry features and hindsight labels. The MT5 AI Assistant processes the dataset in nine phases, helping validate data, quantify baselines, and locate stable, entry-usable thresholds for subsequent EA coding.
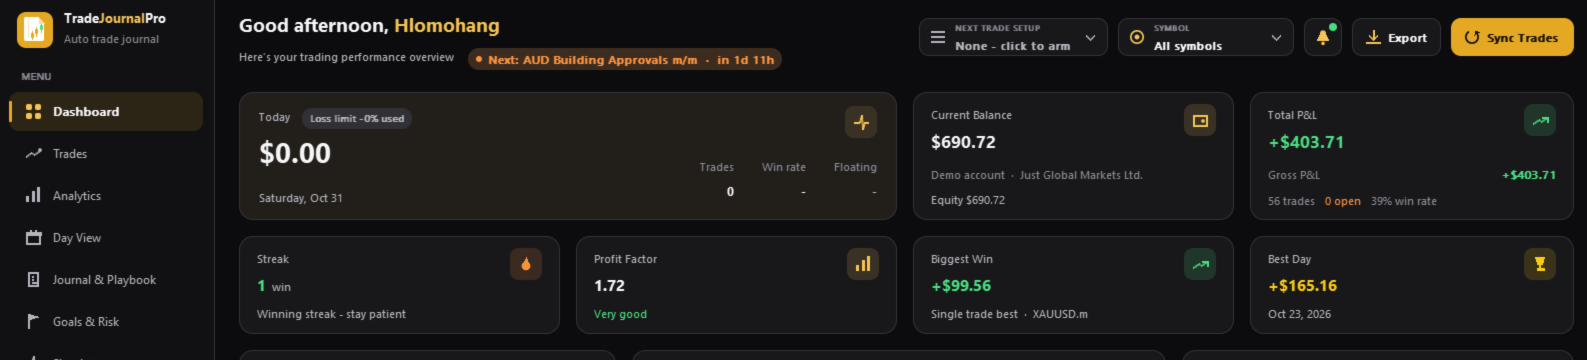
TradeJournalPro — the trading journal that holds you accountable TradeJournalPro is a full-screen, automatic trading journal for MetaTrader 5. Drop it on any chart and it turns that chart into a complete trading workspace. It reads your account history, logs every trade, captures the chart at entry and exit, and keeps you honest about how you trade, not just how much you made. Why traders use it It enforces your rules, not just records your results. Build your own setups in the Playbook , each
ULTIMATE SUPPORT AND RESISTANCE (MT5) Multi-timeframe support and resistance zones, a clear dashboard, and a reaction-based entry signal with entry, stop loss and take profit drawn for you. WHAT IT DOES Builds support and resistance zones from H4, H1, M30 and M15 swing structure and merges overlapping zones into one. Each zone is labelled with the timeframes that agree on it (for example "S H4+H1+M30"). Zone width adapts to volatility, so zones stay proportional on any symbol. Broken zones are
Smif — Statistical Market Inflection Forecasting Smif shows where the current price move is likely to run out of steam, and what has typically happened after moves like it. Instead of fixed pip targets, every forecast is based on how this symbol has actually behaved in the past. Each one shows a suggested entry, stop loss and take profit, the number of past cases behind it, and how often those levels were reached. When there isn't enough evidence for a solid setup, Smif shows no forecast at all
This article implements an MQL5 Expert Advisor that scores each impulse leg behind a swing extreme with a 0–100 Candle Imbalance Score. The score combines four bounded components—body dominance, directional consistency, leg efficiency, and Fair Value Gap coverage—to filter weak swings before any pullback setup is armed. You will see enforced swing alternation, a state machine for first-clean-retest-only entries, and a three-mode trailing stop, enabling consistent setup selection and exit management.
This article describes an MQL5 Expert Advisor that models the market as a random graph rather than a fixed structure. Bars are encoded into discrete states; bar-to-bar moves form a decaying, Laplace-smoothed transition matrix, and a k-step random walk yields a bounded directional signal gated by an Erdos–Renyi null-model test. A separate trade-outcome graph over R-milestones learns survival probabilities to manage exits, turning position management into evidence-based rules.
We implement a five-stage MQL5 pipeline that quantifies market structure, liquidity interaction, and price behavior on four timeframes, then resolves them into a 0–100 Market Intent Score. Decision states (WAIT/WATCH/ACTION) are driven by explicit weights plus hard gates. The analytical core feeds a concise dashboard and, when AutoTrade is on, an execution layer with entry zones, invalidation and liquidity‑based targets.
This article presents a reproducible MetaTrader 5 workflow: collect history, engineer nine context features, label simulated EMA crossover trades, train with FLAML, and export to ONNX with fixed opset and plain probabilities. The Expert Advisor loads the model natively, mirrors the Python feature contract, and uses a tunable confidence threshold as a trade filter. Readers can swap signals and features to reuse the same pipeline.
The EA learns each symbol's volatility profile before trading by processing 1000 bars and summarizing candle ranges, bodies and wicks, noise ratio, trend runs, pullback size, and true‑range dispersion. A classifier assigns regime and structure labels per pair. The stop‑loss optimizer maps those labels to a symbol‑specific ATR multiplier, and the risk module sizes lots to maintain constant percentage risk.
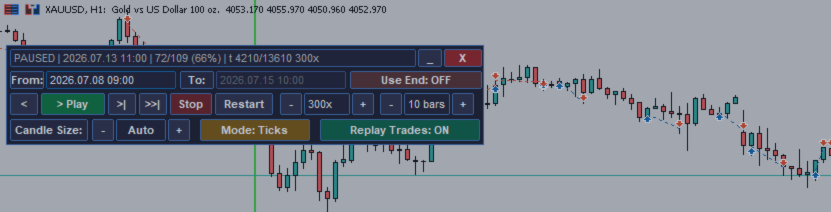
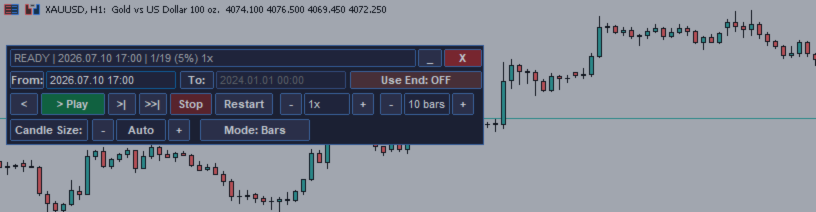
MT5 Chart Replay Rewind the Market. Replay Every Trade You Took. Review Every Decision . Have you ever wished you could rewind the candlesticks on your chart and the trades you took and watch the market unfold again ? Perhaps you wanted to see exactly where a trade started going wrong, identify the setup you missed, or revisit a period when your strategy was perfectly aligned with market structure. Introducing MT5 Chart Replay — a professional MetaTrader 5 chart replay engine designed to
This article finalizes the Forward Simulation Engine for MetaTrader 5 by calibrating synthetic candles to recent market volatility instead of using slope-only sizing. It samples average body, upper wick, and lower wick from closed bars, applies a sine-envelope with decay, proportional wicks, gaps between candles, and periodic counter-trend injections. The result is a live projection that advances one bar ahead, with code you can reuse for calibrated, anchor-based forward rendering and automatic cleanup.
В статье представлен советник на MQL5, который адаптирует метод максимального потока Форда-Фалкерсона в фильтр ликвидности и пропускной способности. Рыночные структуры — максимумы/минимумы свингов, ценовой дисбаланс (FVG), ордер-блоки и пулы ликвидности — образуют ориентированный граф с пропускной способностью ребер, определяемой объемом, ценовой реакцией, расстоянием и качеством структуры. Максимальный поток позволяет оценить возможности ICT-сделок, отфильтровать слабые пути и использовать динамическое управление размером позиции для последовательного двухэтапного процесса принятия решений.
В этой статье бинарная проверка свингов заменяется моделью отката, нормализованной по волатильности. Глубина коррекции измеряется как доля предшествующего импульса и калибруется с учетом режима волатильности, определяемого по скользящему ATR, а для входа в сделку требуются оценка качества не ниже минимальной и подтверждение сигналами структуры или ликвидности. Пятиуровневая архитектура объединяет обнаружение, проверку, картирование ликвидности, оценку с учетом рыночного режима и исполнение сделок, помогая отфильтровывать слабые коррекции и динамически подбирать размер стоп-лоссов под текущие условия.
В статье представлен фильтр исполнения для нескольких торговых инструментов, который оценивает качество рынка в реальном времени, прежде чем разрешить сделку. Он измеряет динамику спреда, скорость тиков, разрывы в котировках и микроволатильность, оценивает проскальзывание, а затем классифицирует состояние рынка, чтобы блокировать торговлю при неблагоприятных условиях. После затухания шума модель продолжения движения после свипа ликвидности оценивает изменения структуры рынка, чтобы входы в рынок происходили только при стабильных условиях исполнения.