MT5 Chart Replay
- Утилиты
-
Hlomohang John Borotho
 Quantitative intraday trading strategies
· MQL5 Expert Advisor development ·
Python + AI automation for MetaTrader 5.
Built by a developer who actually trades. - Версия: 3.0
- Обновлено: 29 июля 2026
- Активации: 5
Rewind the Market. Replay Every Trade You Took. Review Every Decision.
Have you ever wished you could rewind the candlesticks on your chart and the trades you took and watch the market unfold again?
Perhaps you wanted to see exactly where a trade started going wrong, identify the setup you missed, or revisit a period when your strategy was perfectly aligned with market structure.
Introducing MT5 Chart Replay — a professional MetaTrader 5 chart replay engine designed to help traders relive historical market conditions directly inside their MT5 terminal.
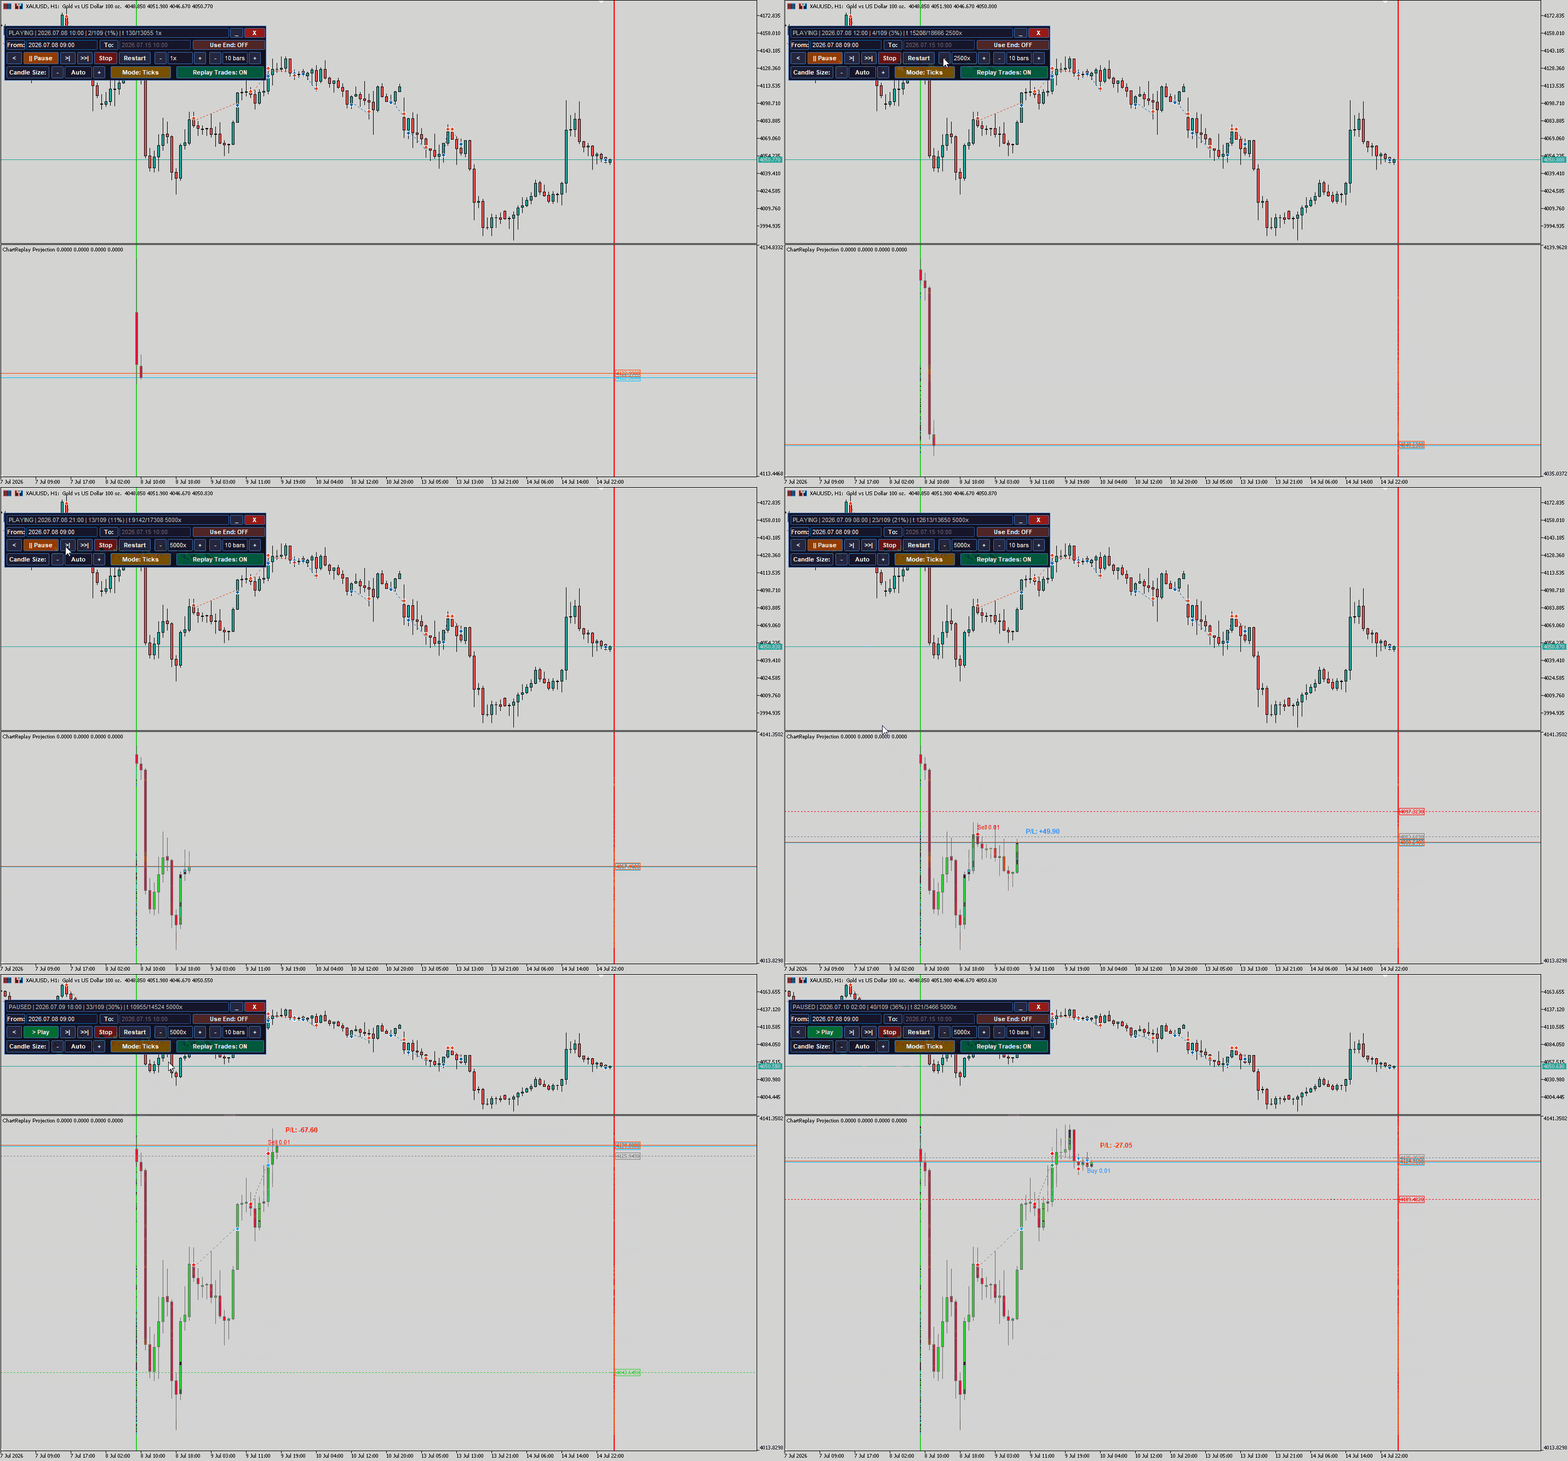
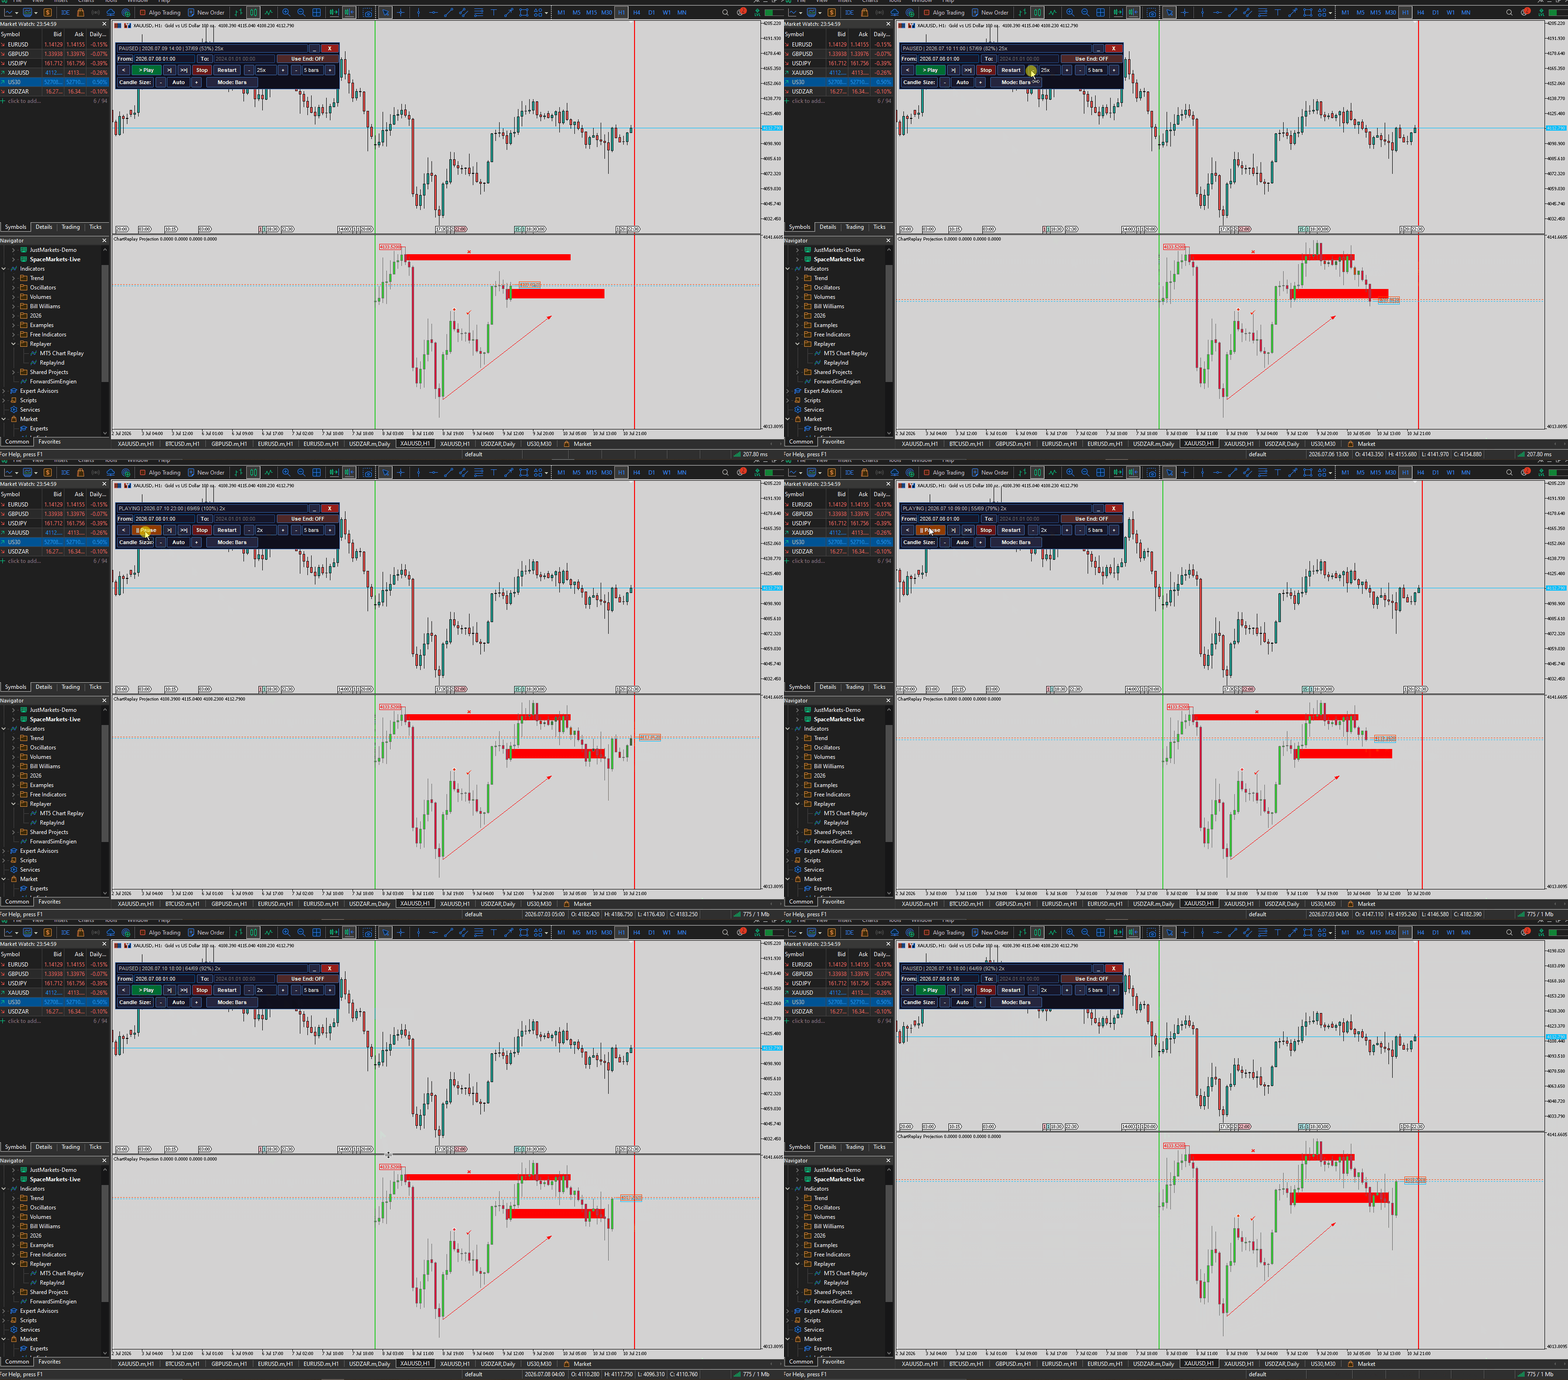
MT5 Chart Replay allows you to replay historical candlesticks from virtually any date and time, candle-by-candle, as if the market were happening live. Instead of scrolling through static charts and relying on hindsight, you can experience price action in real-time simulation mode, making your analysis, learning, and strategy development far more effective. Whether you're a discretionary trader, algorithmic trader, mentor, educator, or student of the markets, MT5 Chart Replay provides a practical way to study market behavior, validate trading ideas, and sharpen your decision-making skills.
Key Features- Replay historical price action directly inside MetaTrader 5
- Select any historical date and begin replaying market movements
- Control replay speed to match your preferred learning pace
- Study market structure as it develops candle by candle
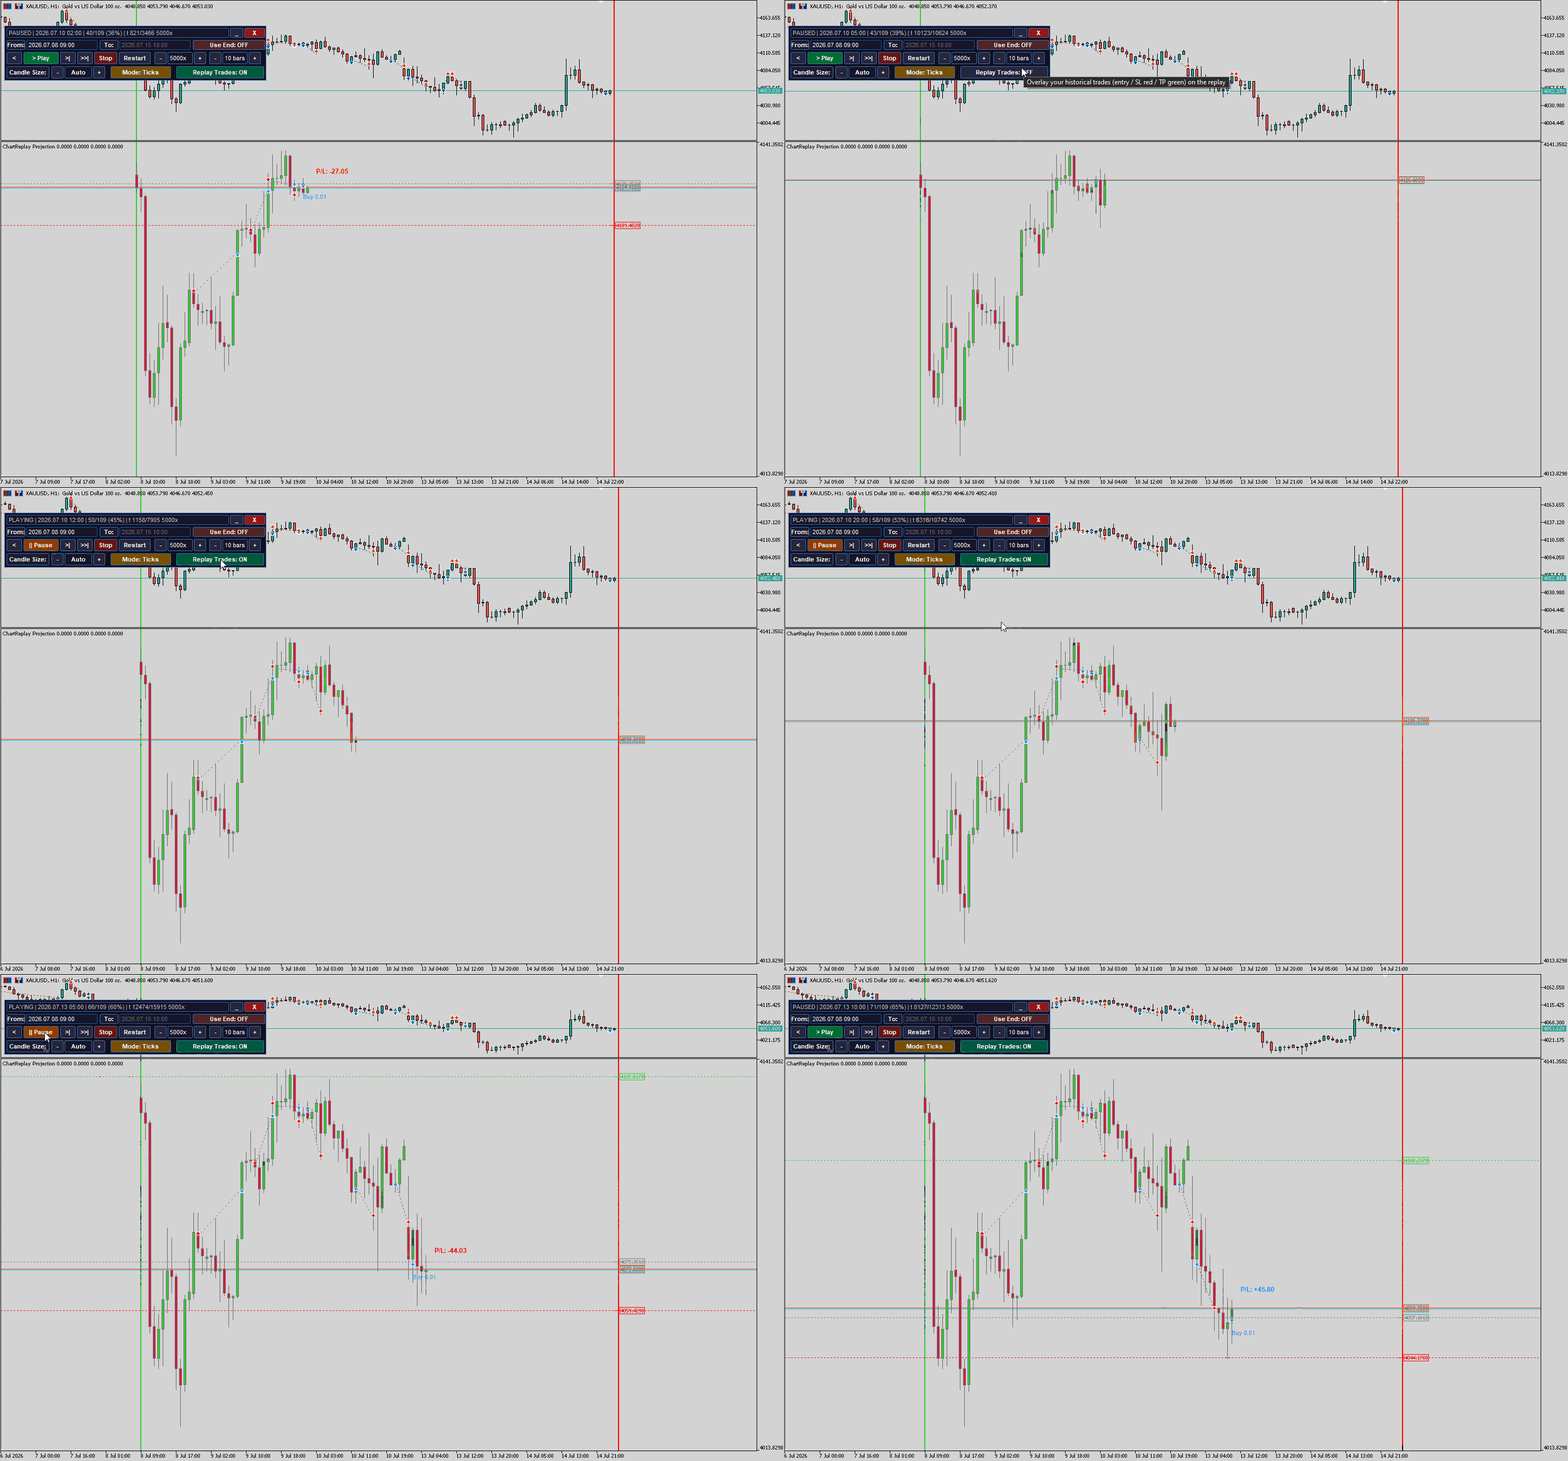
- Analyze entries, exits, liquidity sweeps, breakouts, and reversals in real-time simulation
- Review missed opportunities and trading mistakes
- Compatible with multiple symbols and timeframes
- Designed for traders, mentors, and trading communities
- Learn From Past Trades
- Improve Market Analysis Skills
- Conduct Detailed Market Recaps
- Practice Strategy Execution
- Perfect for Trading Education
- Build Confidence Without Market Pressure
- EVERYONE AND ANYONE
MT5 Chart Replay — User Manual1. Installation
- Drag MT5 Chart Replay from the Navigator onto the chart.
- Adjust the input settings if you wish (see Section 3), then click OK.
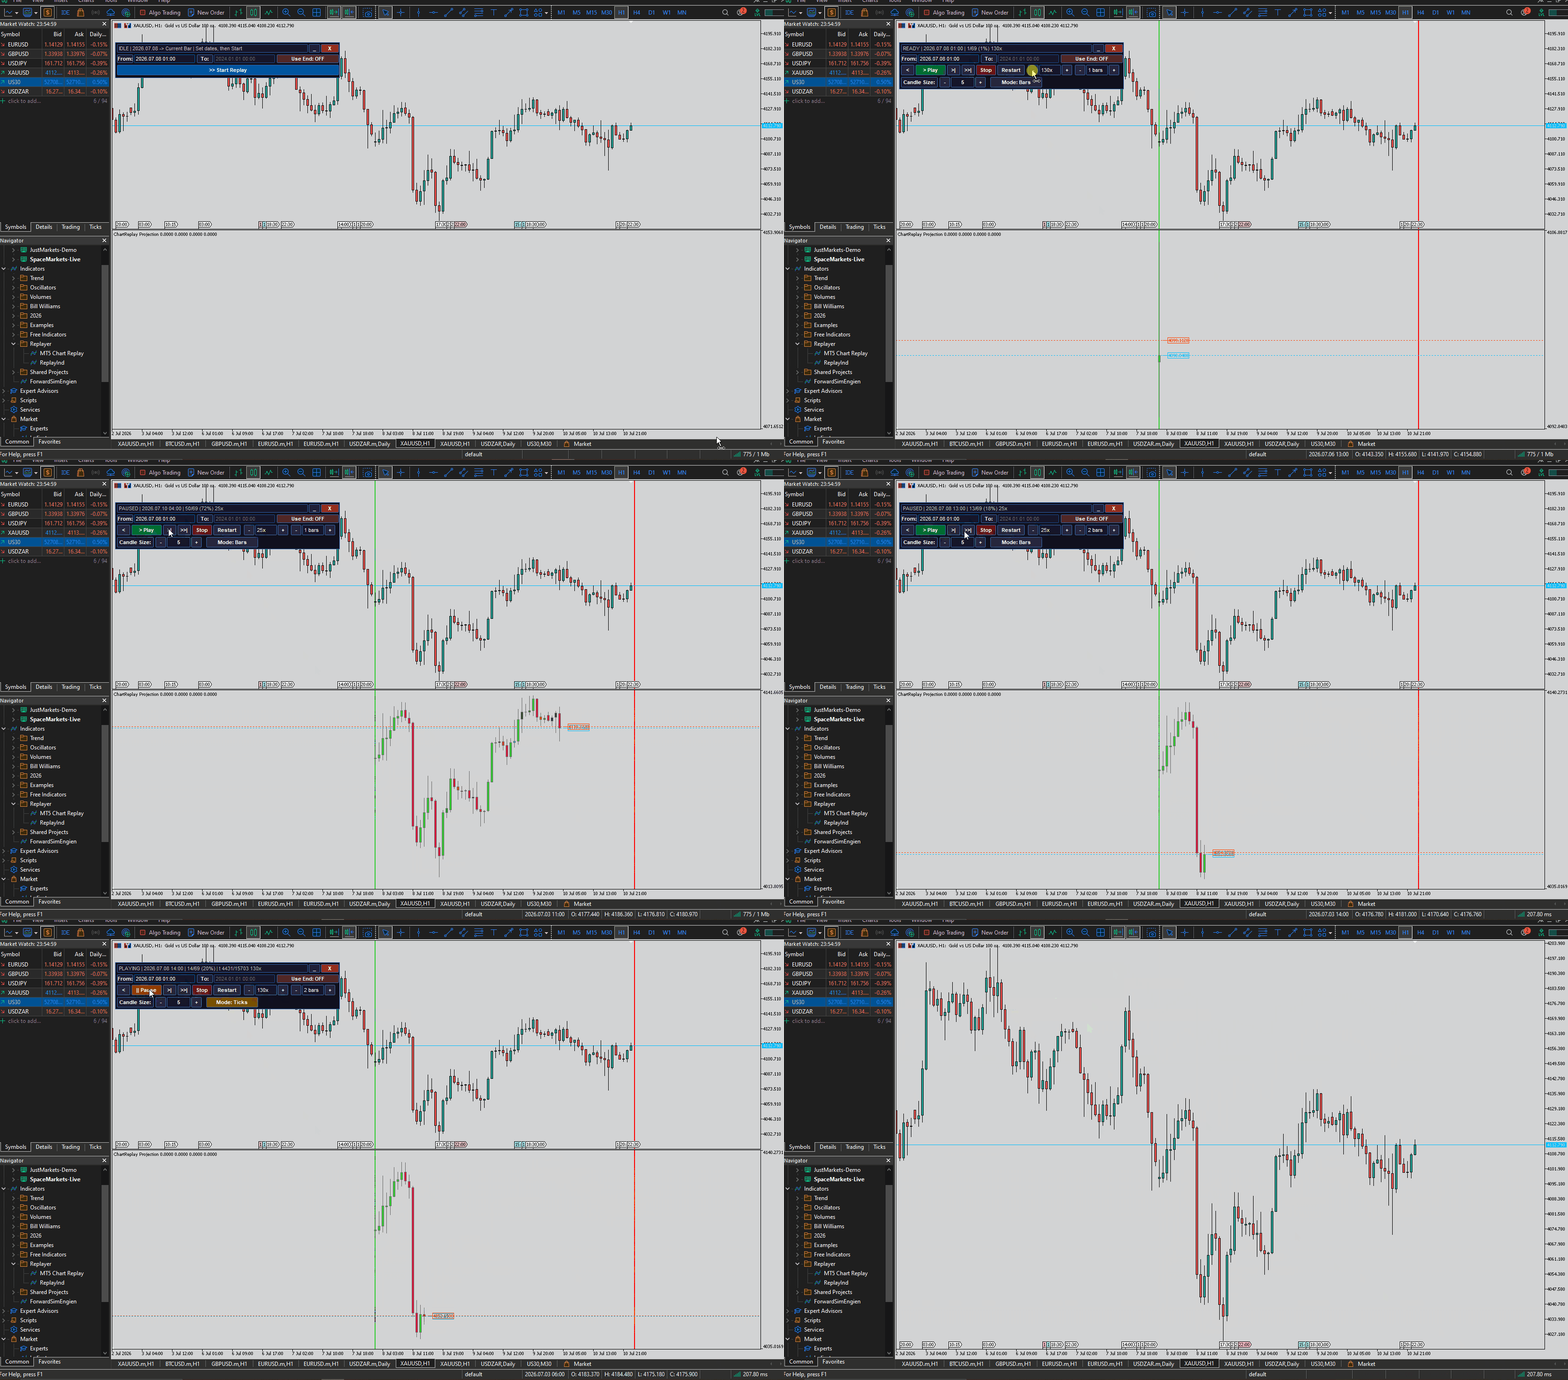
- Click >><< — the sub-window expands and the panel appears.
- Set the From date — click the From: field, type a start date in YYYY.MM.DD HH:MM format, press Enter.
- (Optional) Set an end date — click Use End: OFF to turn it ON, then type a date into the To: field. Leave it OFF to replay all the way to the current bar.
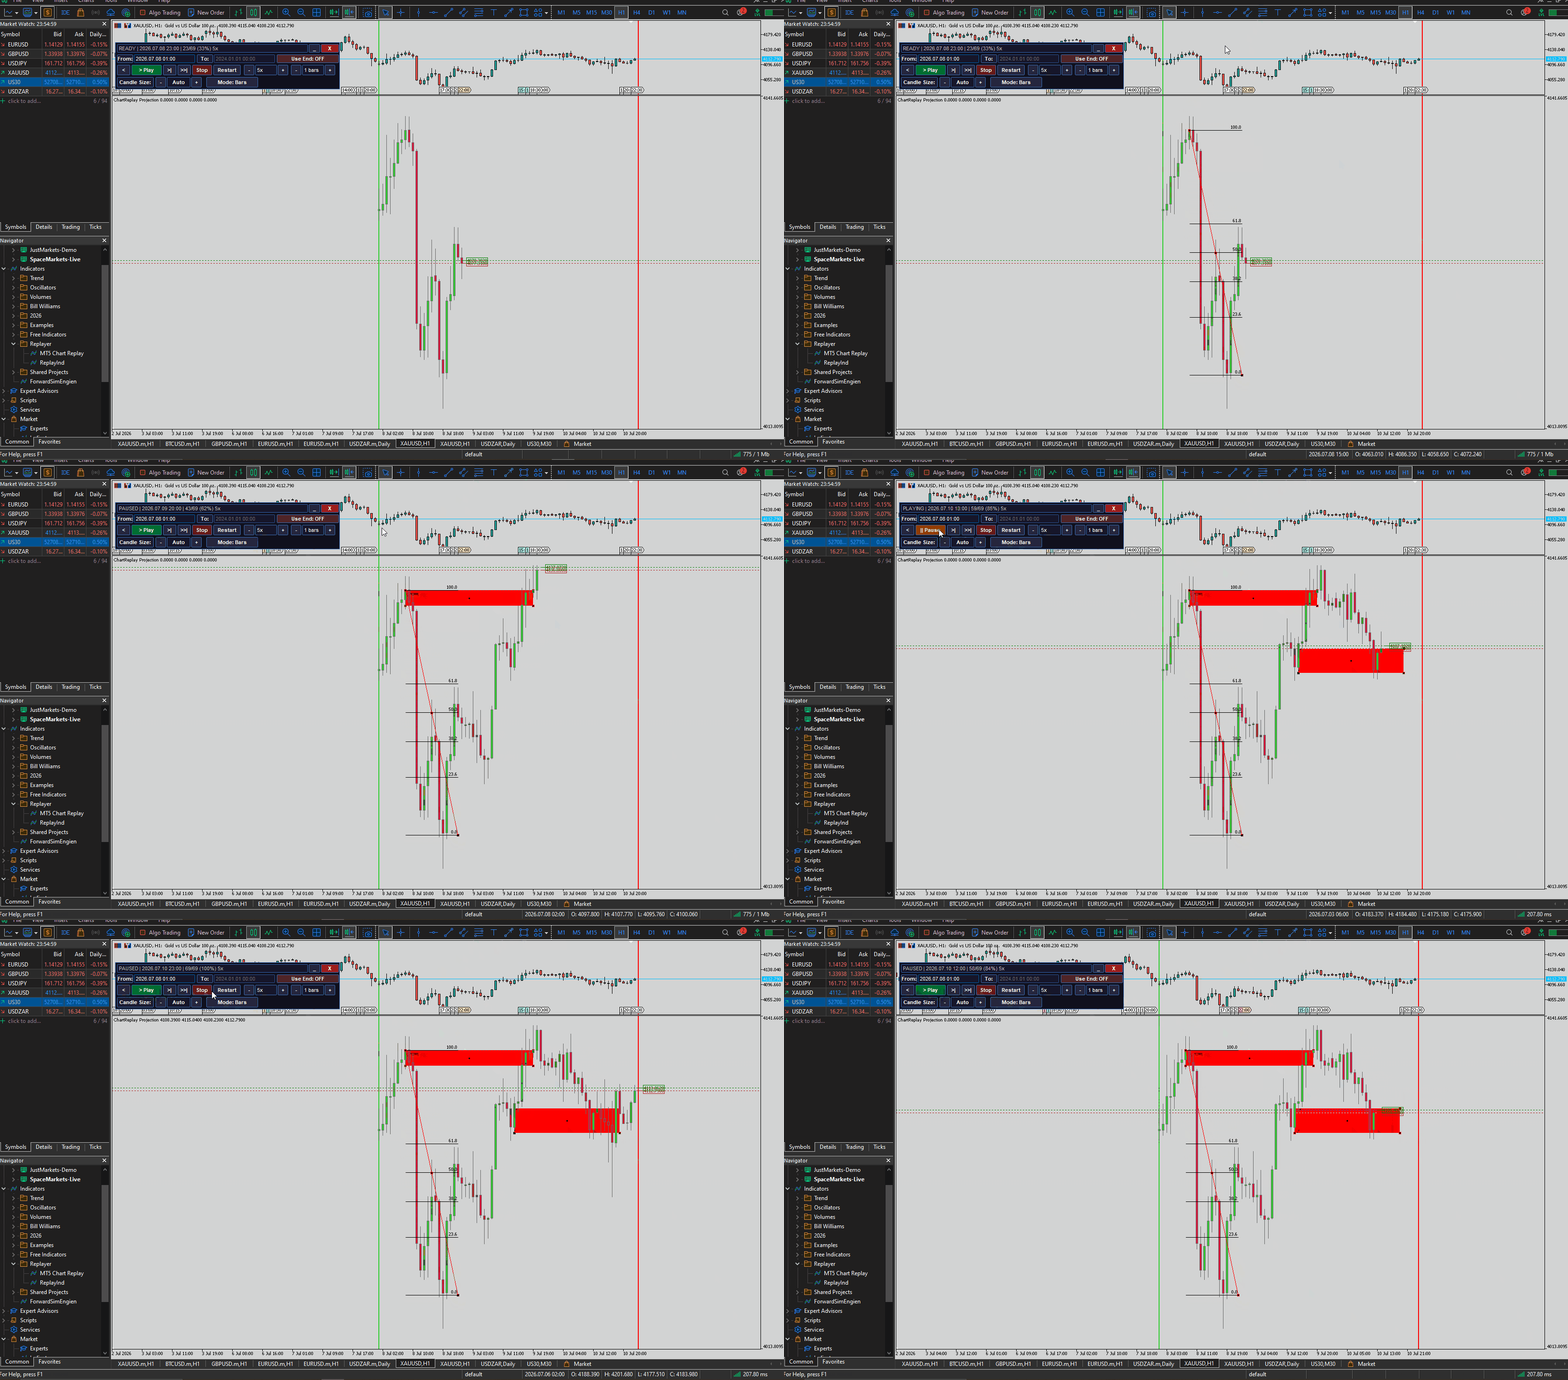
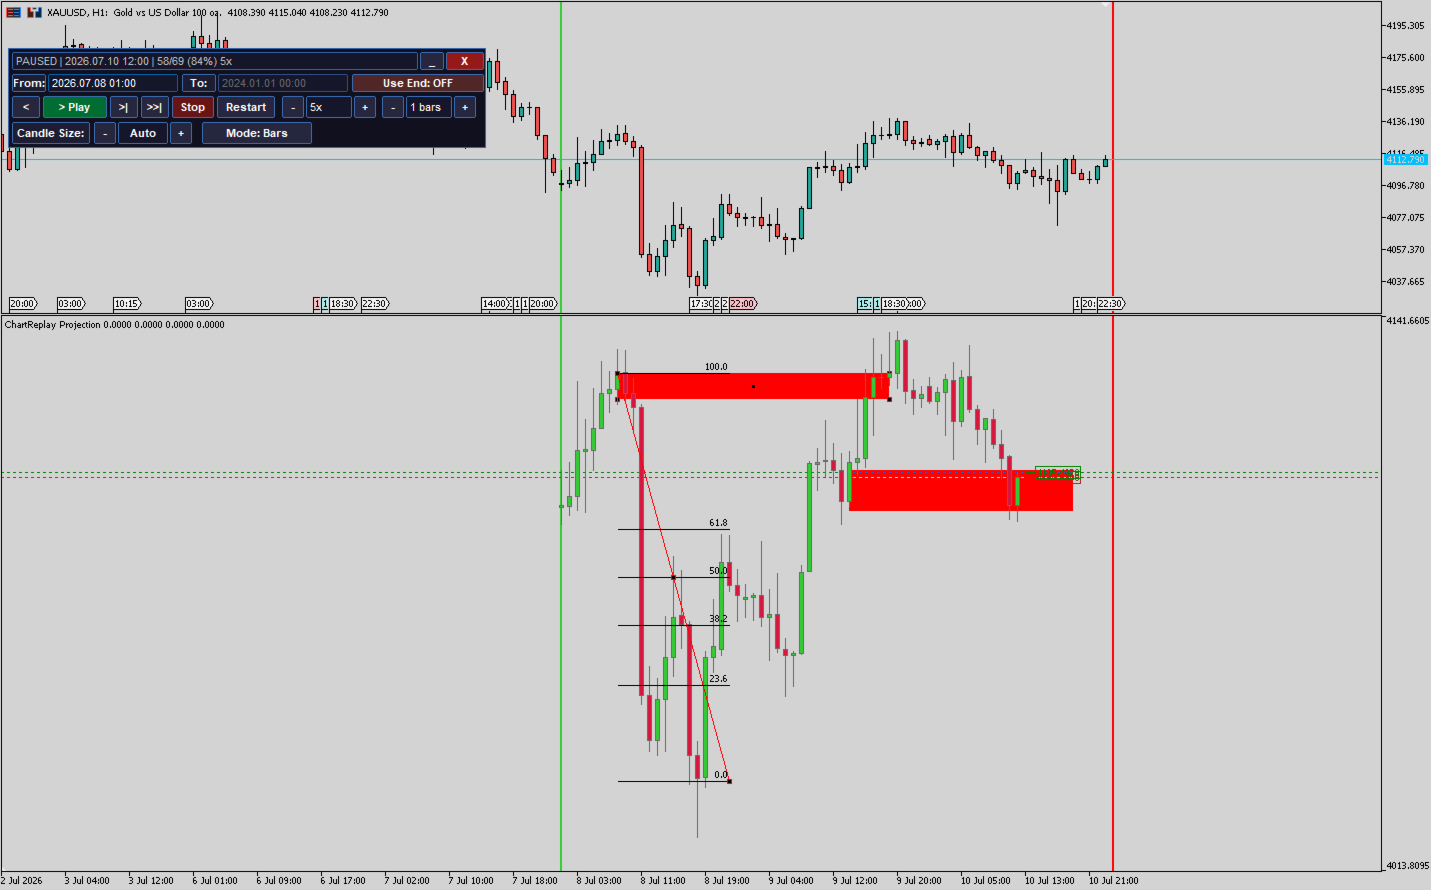
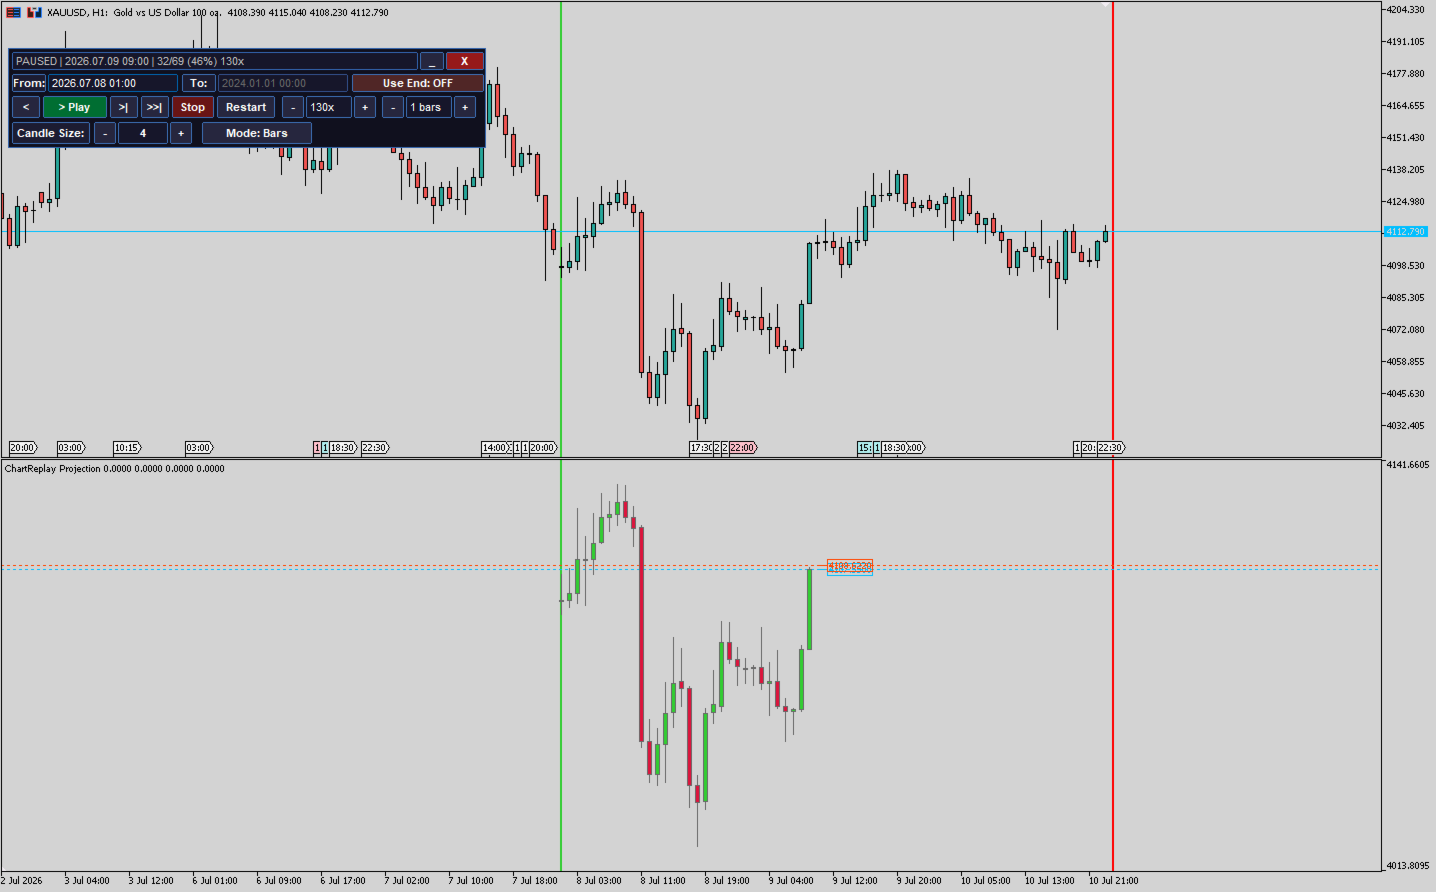
- Click >> Start Replay — the first candle of the range is drawn, a green line marks the start and a red line marks the end of the range.
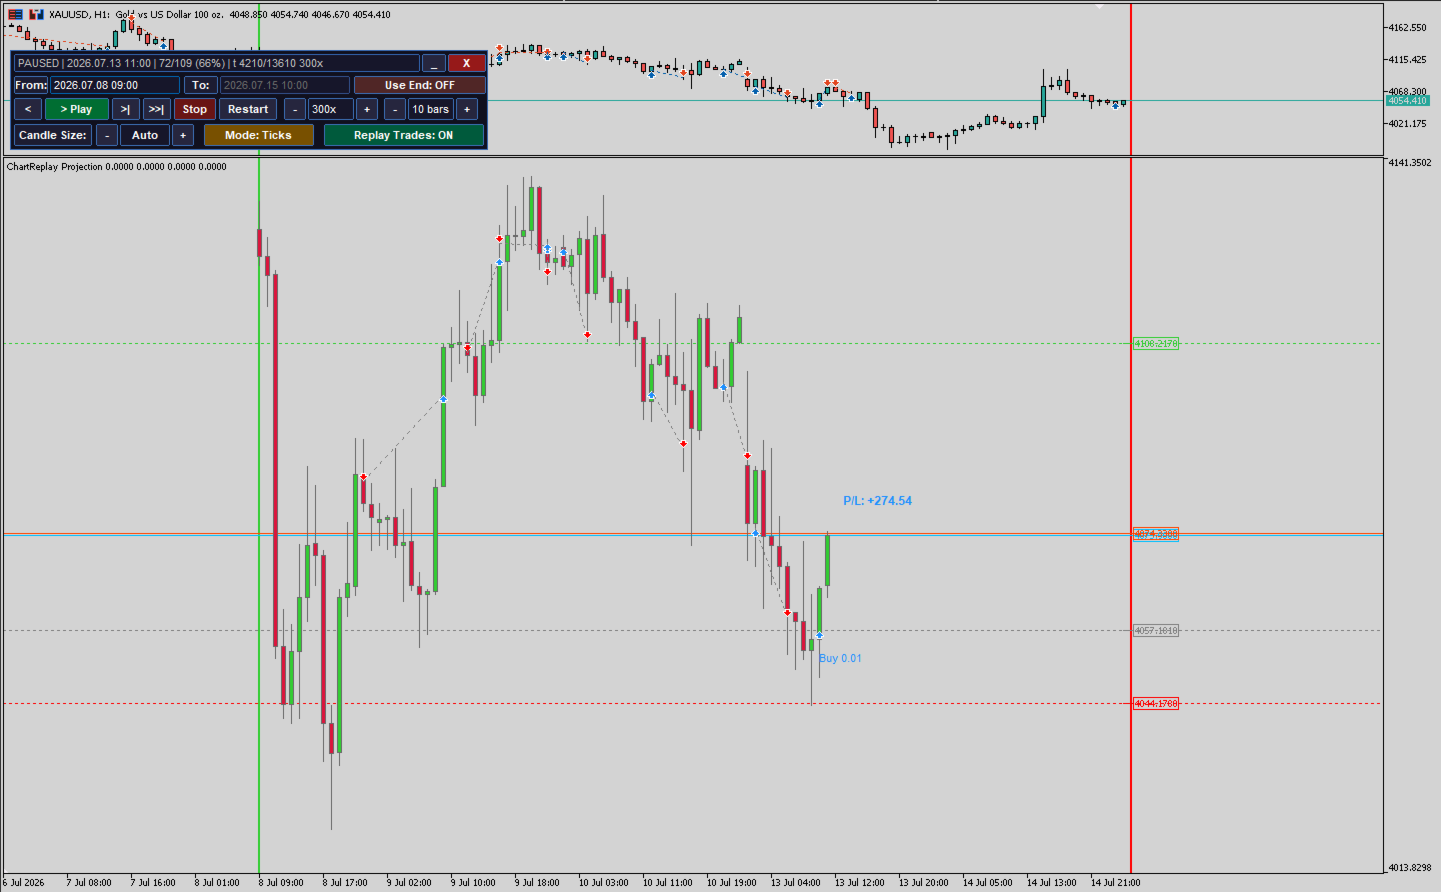
- Choose a mode — Mode: Bars reveals one whole candle per step; Mode: Ticks forms each candle live from its recorded ticks.
- Press > Play — playback runs at the selected speed. Use the speed - / + buttons to slow down or accelerate at any time.
- Pause, step, and study — || Pause freezes playback; >| advances one bar (or one tick in Tick mode); < steps backward.
- Finish — press Stop to end the session (panel returns to the landing), or the red X to remove the indicator from the chart.
Zooming. Use the Candle Size control (or the terminal's own +/− zoom). Candles in the sub-window always render with the same width, gap, and centered wicks as the main chart, at every zoom level.
4. Tick mode — what to expect
- Tick data comes from your broker's server and typically covers only the recent months. If your start date is older than the available tick history, the indicator tells you with a red status alert ("No tick data for set date - skipped N bars to …") and reveals the no-tick era instantly, then begins live tick formation at the boundary.
- The first tick request of a session may pause briefly while the terminal downloads tick history from the server. This happens once.
- The forming candle is built from bid ticks; when its ticks are exhausted it snaps to the bar's official recorded OHLC, so the finished chart is always exact.
- The status bar shows ' t 1234/56789'— the tick position inside the forming candle.
Turn Historical Data Into Trading Experience
Replay it. Study it. Learn from it.
MT5 Chart Replay — Bringing Historical Markets Back to Life, One Candle at a Time.
Was $249