• Информация
6+ лет
опыт работы
32
продуктов
135
демо-версий
0
работ
0
сигналов
0
подписчиков
👑 Физик-теоретик, программист.
Трейдингом занимаюсь лет пятнадцать с акцентом на поисках математических закономерностей рынка.
----------------------------------------------------------------------------------------------------------------------------------
💰 Представляемая продукция:
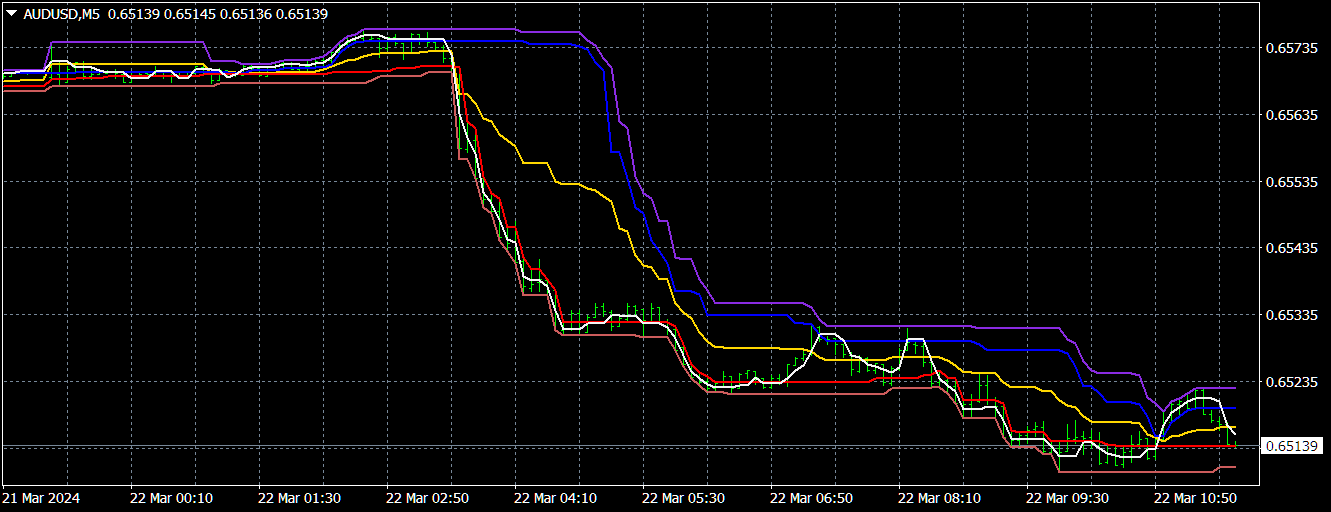
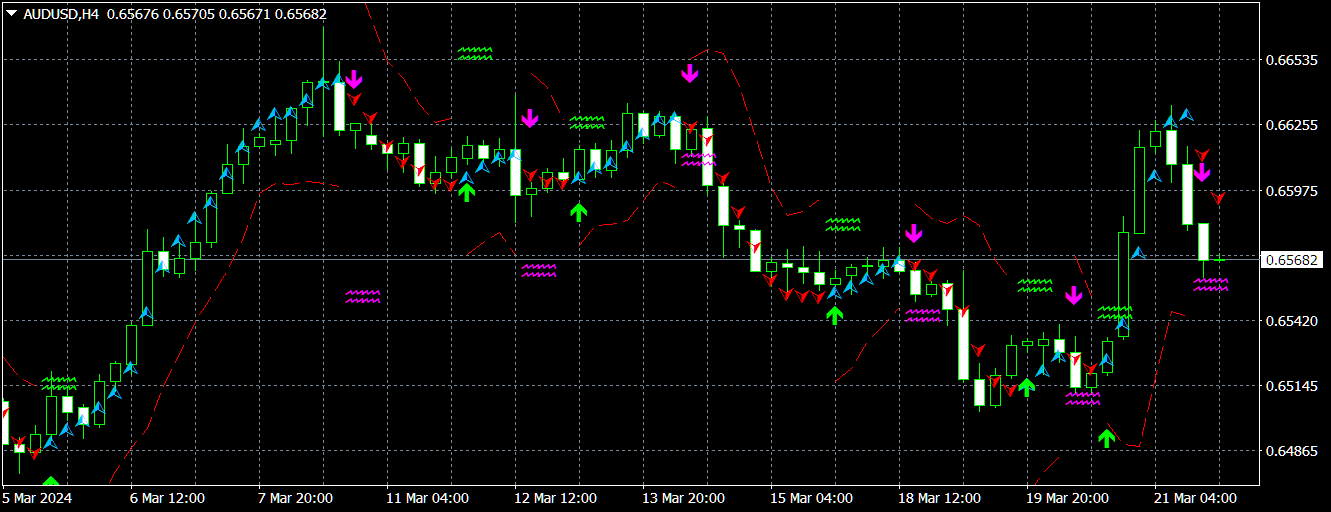
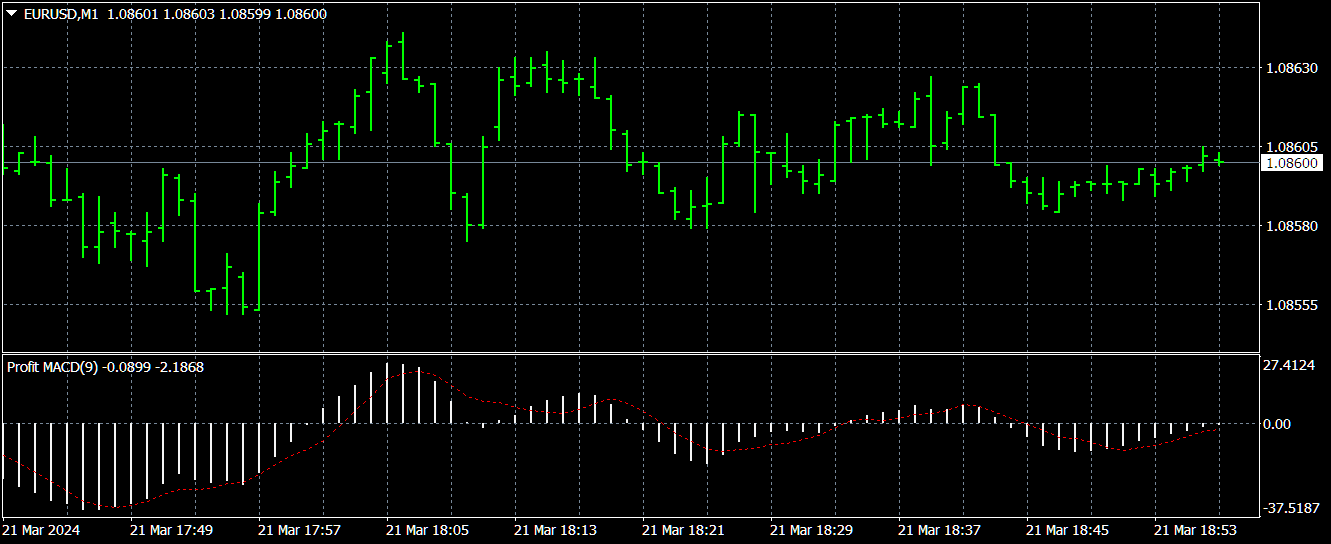
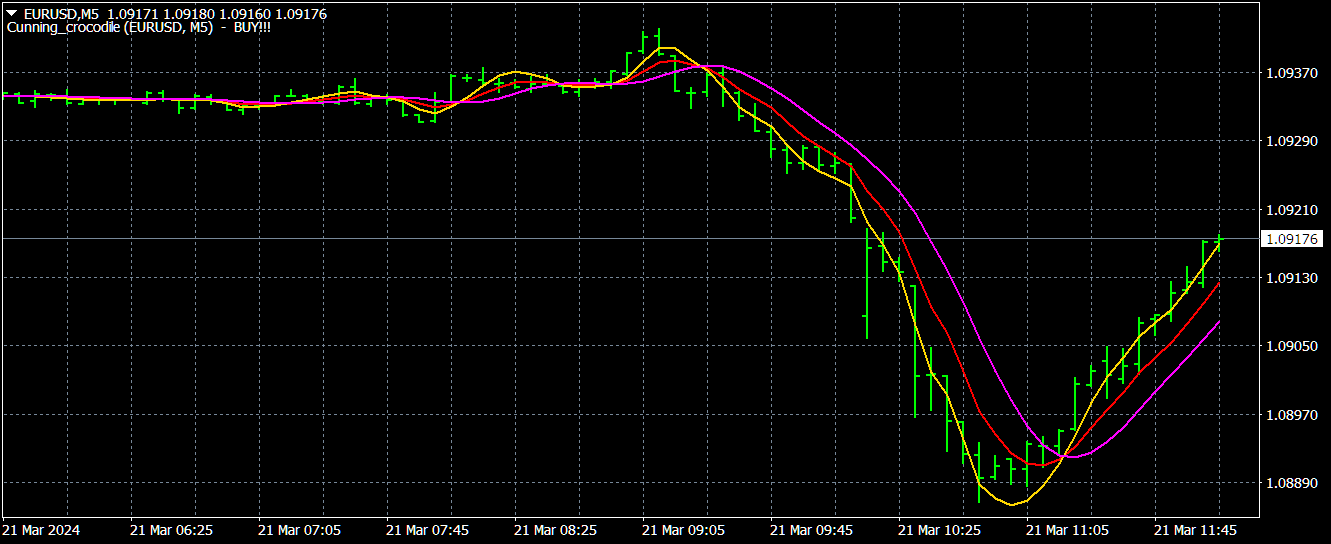
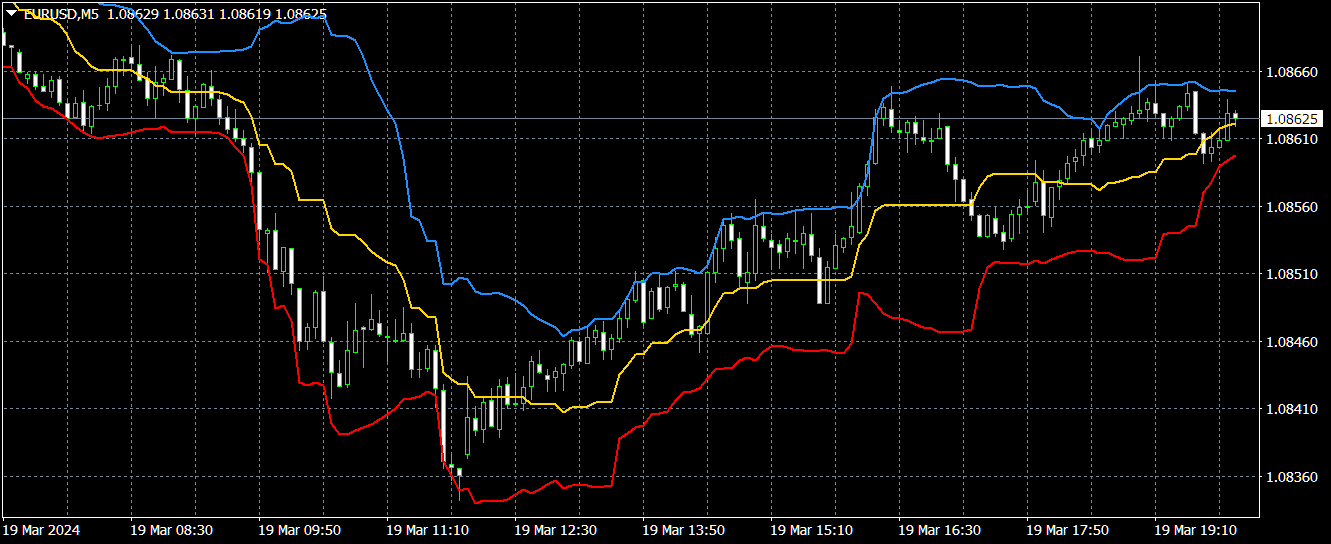
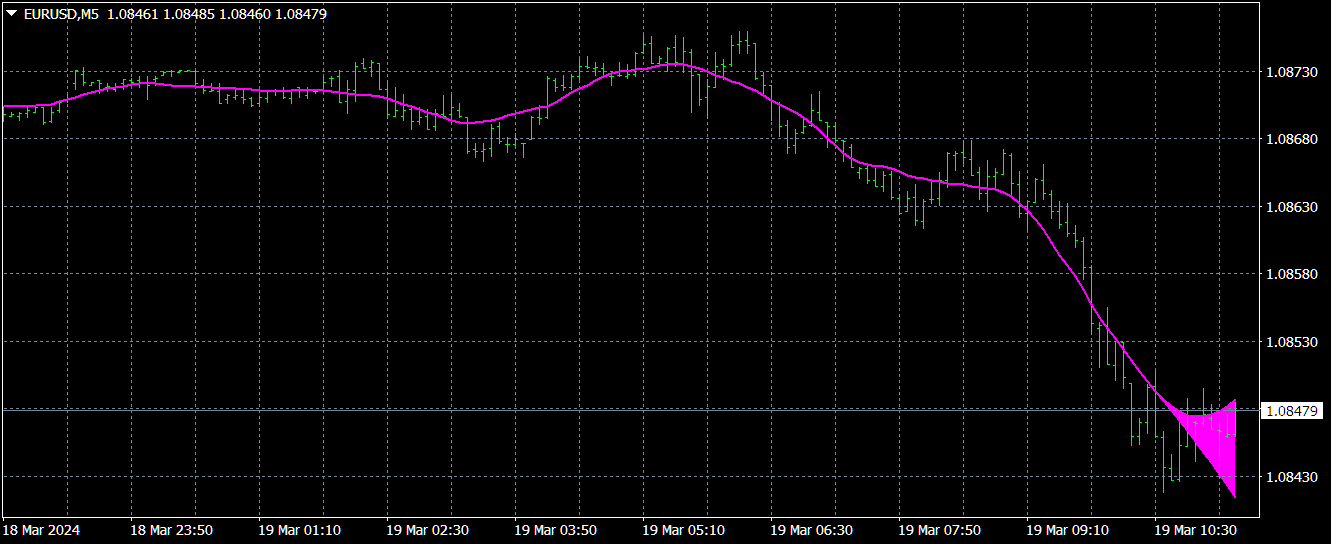
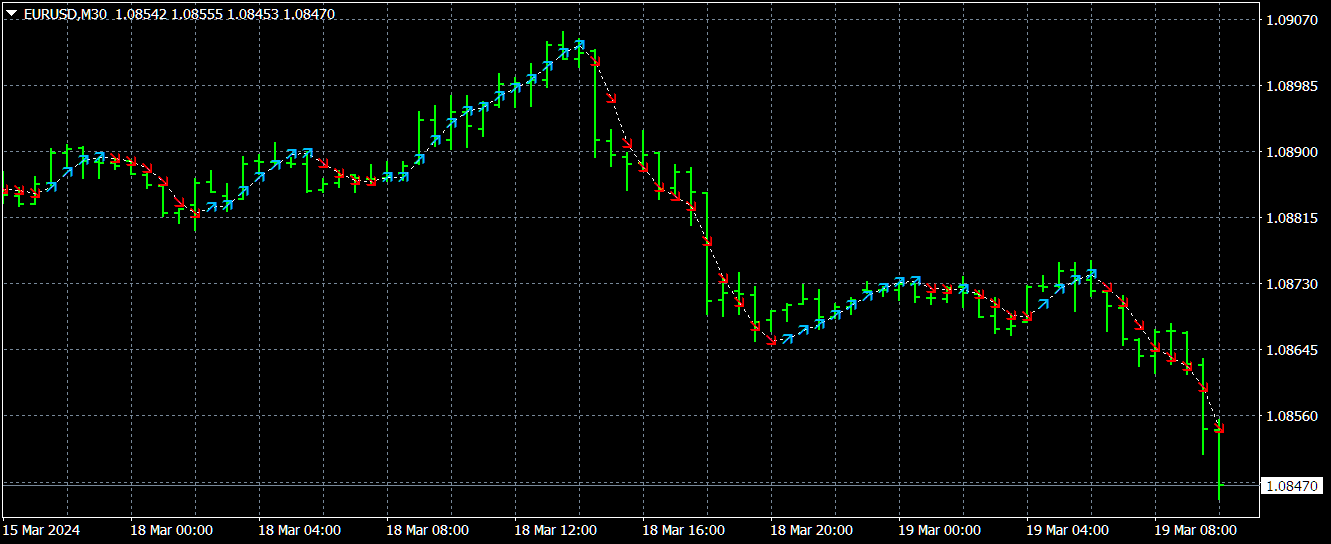
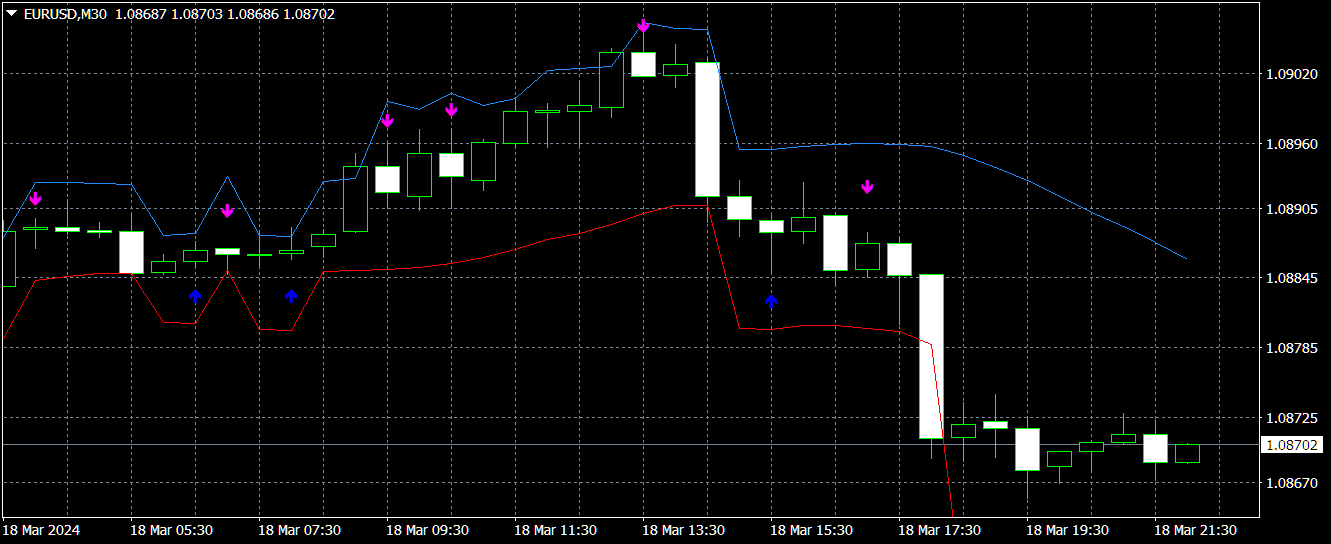
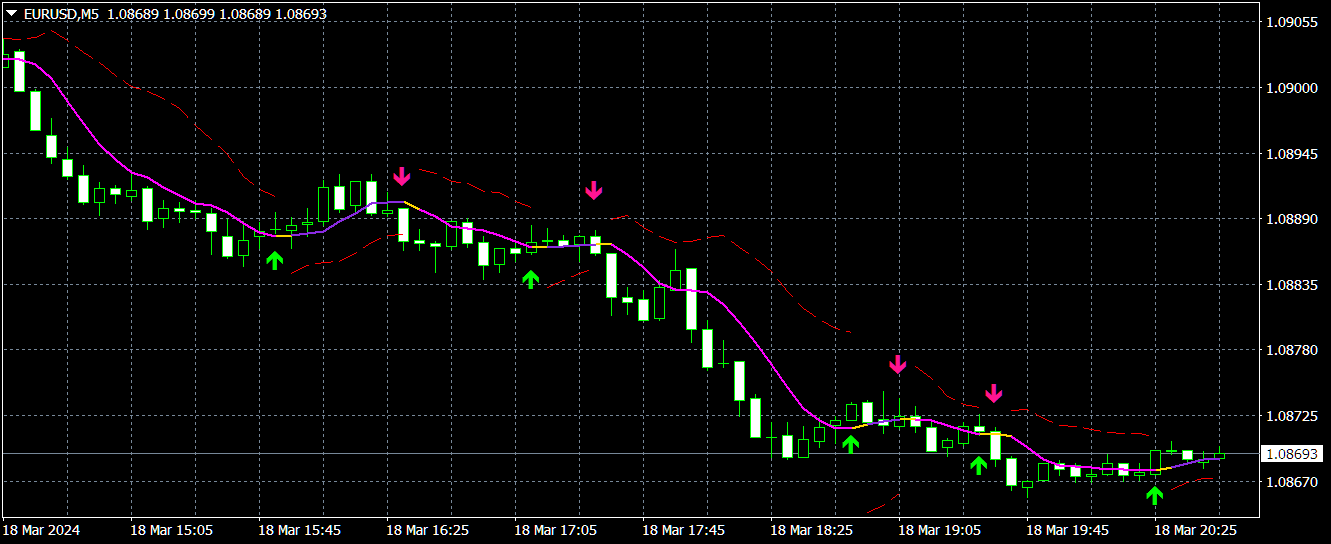
1) 🏆 Индикаторы с оптимальной фильтрацией рыночных шумов (для выбора точек открытия и закрытия позиций).
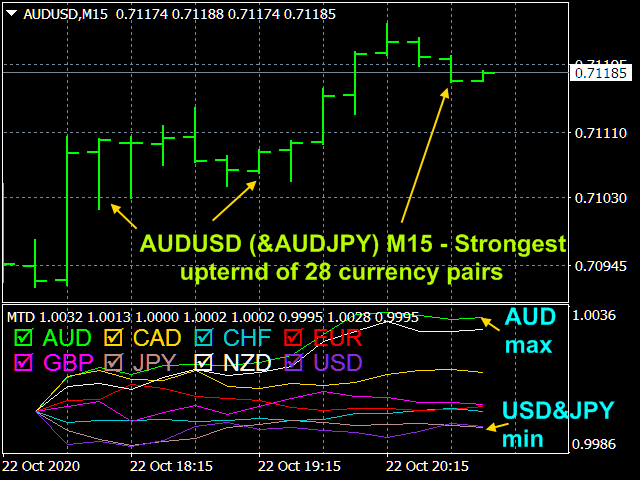
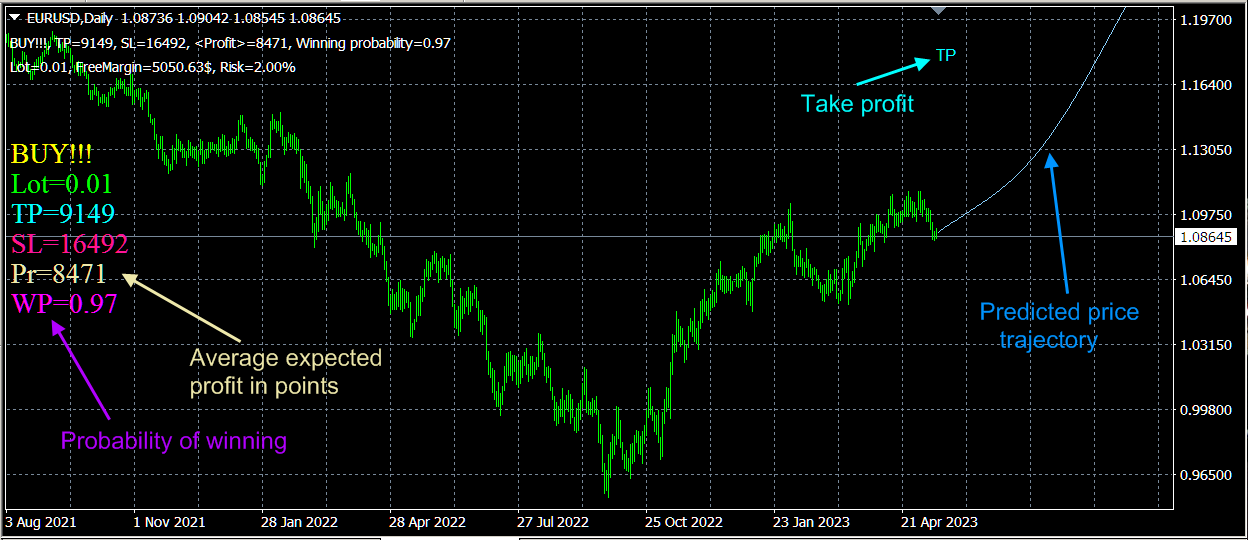
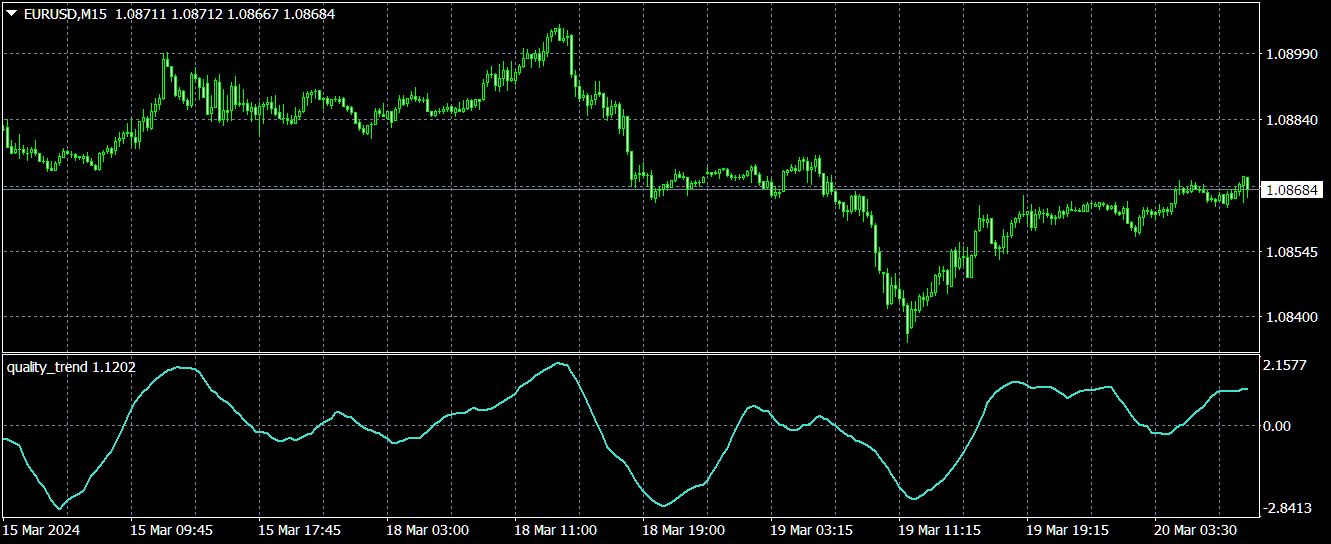
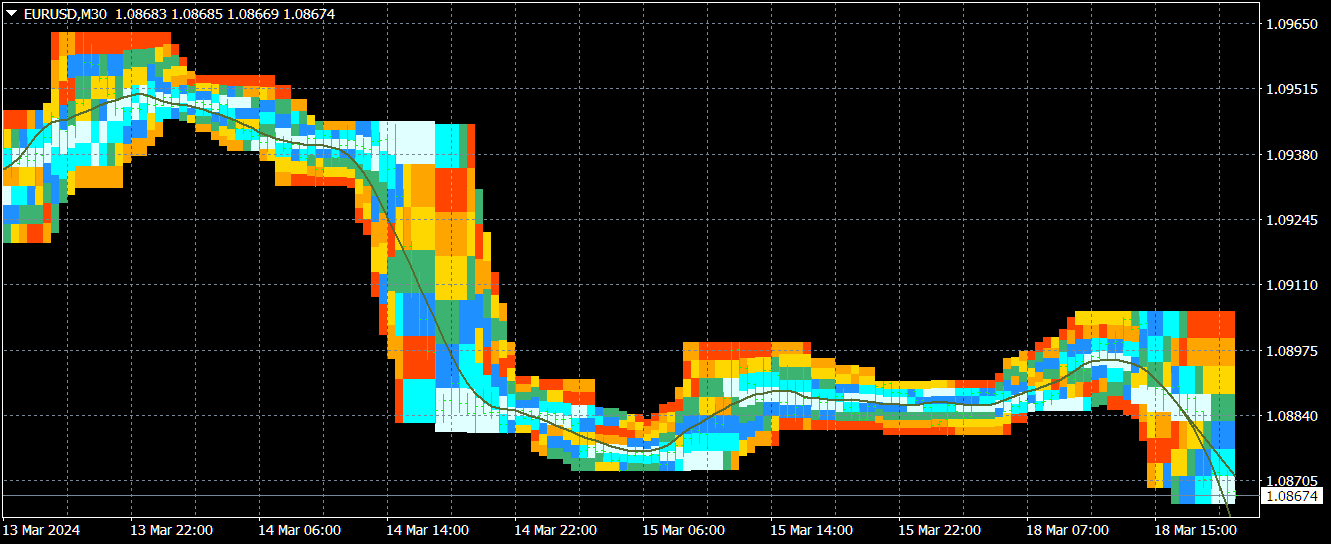
2) 🏆 Статистические индикаторы (для определения глобального тренда).
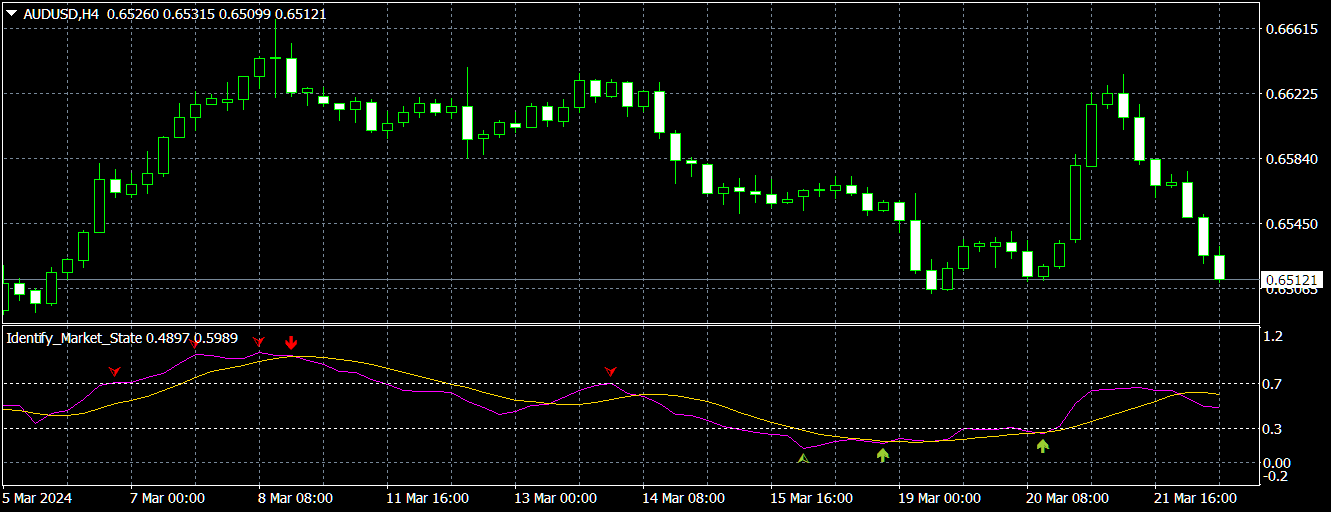
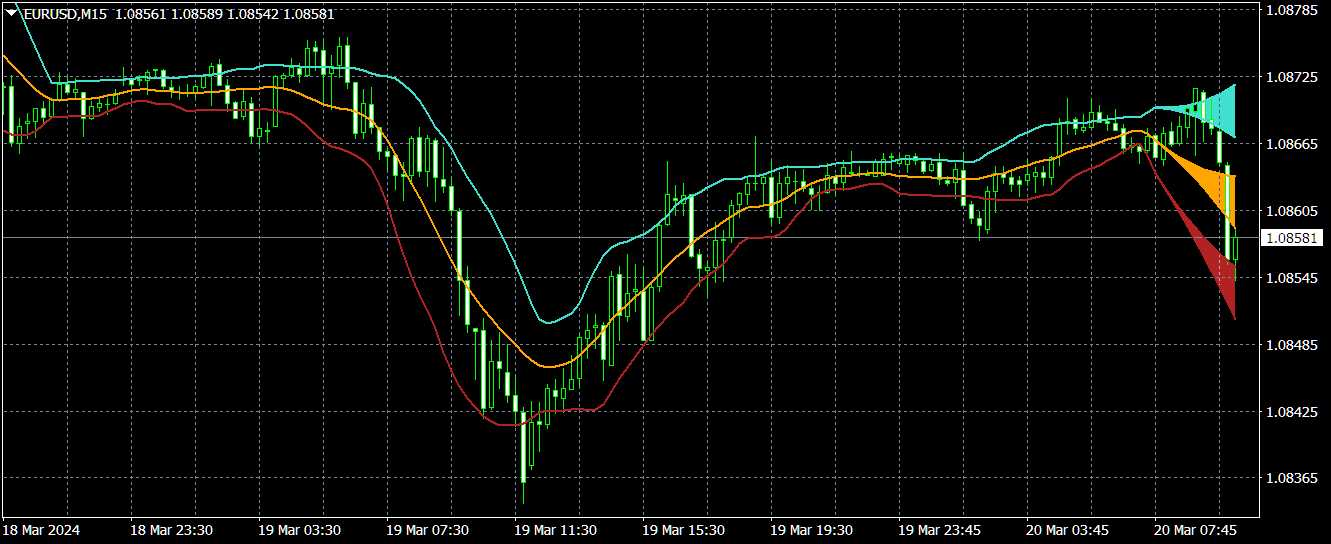
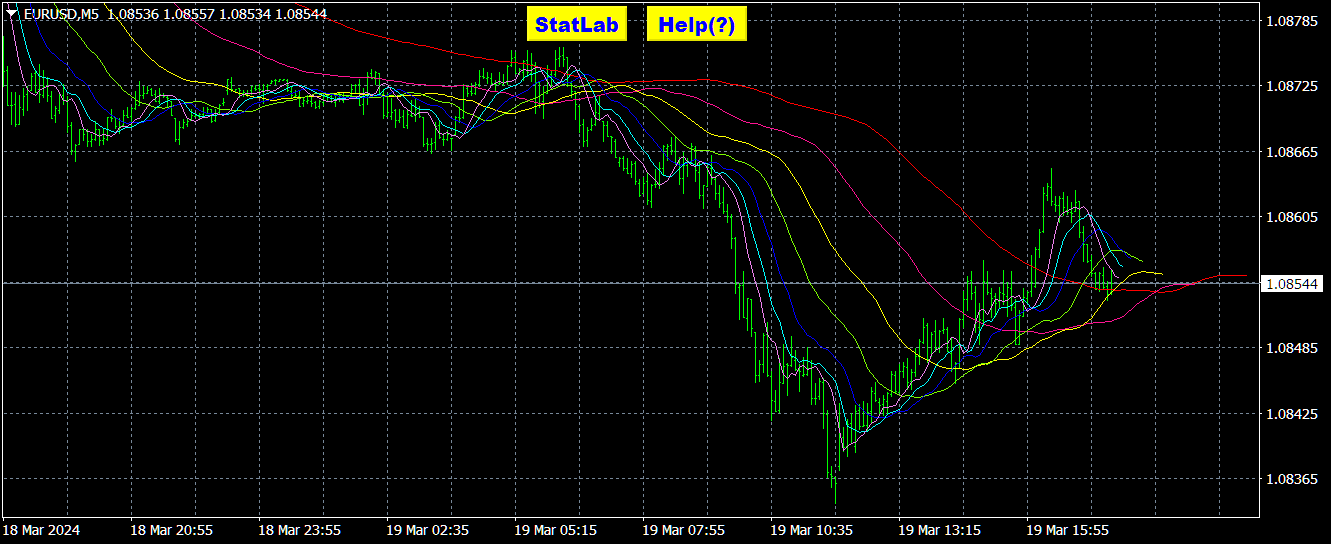
3) 🏆 Индикаторы исследования рынка (для выяснения микроструктуры цены, построения каналов, идентификации отличий разворотов тренда от откатов).
----------------------------------------------------------------------------------------------------------------------------------
☛ Более подробная информация в блоге https://www.mql5.com/en/blogs/post/741637
Aleksey Ivanov
Aleksey Ivanov
Sensitive Signal https://www.mql5.com/en/market/product/34171
✔️The most sensitive indicator with optimal market noise filtering.
✔️The best indicator for scalpers.
✔️Calculates stop loss and take profit positions.
✔️It has built-in management and all kinds of alerts.
✔️The algorithms of this indicator are unique and developed by their author
Author Aleksey Ivanov https://www.mql5.com/en/users/60000382
Aleksey Ivanov
Aleksey Ivanov
Profit MACD https://www.mql5.com/en/market/product/35659
✔️ One of my most profitable indicators with optimal filtering.
✔️The algorithms of this indicator are unique and developed by their author
✔️The indicator has all kinds of alerts.
✔️ The indicator does not redraw.
Author Aleksey Ivanov https://www.mql5.com/en/users/60000382
Aleksey Ivanov
Aleksey Ivanov
Cunning crocodile https://www.mql5.com/en/market/product/32028
✔️ One of the best indicators with optimal market noise filtering.
✔️The indicator has all kinds of alerts.
✔️ The indicator does not redraw.
✔️The algorithms of this indicator are unique and developed by their author
Author Aleksey Ivanov https://www.mql5.com/en/users/60000382
Aleksey Ivanov
Aleksey Ivanov
✔️ Here are indicators from the creator of the scientific rigorous theory of price movement Part 1 https://www.mql5.com/en/articles/10955 ,
Part 2 https://www.mql5.com/en/articles/11158
Part 3 https://www.mql5.com/ru/articles/12891
and
the author of the well-known Identify Trend indicator https://www.mql5.com/en/market/product/36336 .

✔️The algorithms of most indicators (Modern profitable indicators https://www.mql5.com/en/blogs/post/741637 ) are unique and developed by their author.
Aleksey Ivanov
Aleksey Ivanov
Friends! For those who bought the Scientific trade indicator, it is advisable to download 2 auxiliary tools for it - a script + an indicator.
1. CalculateScientificTradePeriod script
https://www.mql5.com/en/market/product/99909
Firstly, the script estimates how many Mx bars of the chart (on which this script is applied) the future trend will most likely continue and what is its quality.

Secondly, the script is an auxiliary tool for the extremely mathematically advanced and extremely effective ScientificTrade indicator in trading. https://www.mql5.com/en/market/product/98467

2. FindScientificTradePeriod indicator
https://www.mql5.com/en/market/product/99926
The indicator visualizes the result of the CalculateScientificTradePeriod script (which, of course, also needs to be downloaded), which, firstly, estimates how many Mx bars of the active chart the future trend will most likely continue and what is its quality, and, secondly, calculates the optimal the averaging period (which is also equal to Mx) of the ScientificTrade indicator, which gives the maximum profit according to the extremely effective ScientificTrade strategy.
Aleksey Ivanov
Aleksey Ivanov
Scientific trade https://www.mql5.com/en/market/product/98467
An extremely convenient indicator that truly makes the process of making money on the exchange easy. It is based on the scientifically rigorous theory of the market developed by the author, the beginning of which is presented https://www.mql5.com/en/articles/10955 .

The full algorithm of this indicator operation is presented in the article. https://www.mql5.com/ru/articles/12891

The indicator calculates the most probable price movement trajectory and displays it on the chart. Based on the predicted price movement trajectory, the indicator calculates the direction of the position and the position of the take profit. Based on the statistically calculated uncertainty of the trajectory of the predicted price movement, the selected risk level and the size of the deposit, the indicator also calculates the lot size and stop loss position. The averaging period of the indicator is selected based on the maximum probability of winning, which is presented for each period on the main chart of the trading terminal.
It is better to use M1-M15 timeframes in the indicator; at the same time, it is recommended to play according to the global trend, determined on H4, D1, i.e. if the indicator gives a SELL signal, then this position is opened when the global trend is down; if the indicator signal is BUY, then the position is opened when the global trend is up.
After choosing a timeframe, you sort through the averaging values like 20, 30, 40, …, 200 and look at the trading terminal at what value the maximum probability of winning is achieved. This is the value you should use. Since the averaging period of the indicator must be selected manually in the process of moving along the price history, the indicator readings in the tester cannot reflect the full effectiveness of its work and may be incorrect.
To automatically determine the optimal averaging period (which gives the maximum probability of winning), the CalculateScientificTradePeriod script has been developed. https://www.mql5.com/en/market/product/99909

The operation of the indicator is based on predicting the market's own trends, so it is not recommended to use it before and immediately after strong news, as well as in case of strong market volatility, especially if the volatility is the result of crisis processes. The indicator's forecast period, which is its averaging period, should not go beyond the future moment of strong news release.
Before opening a position, you should only assess the state of the market and take into account news factors.
Everything else - position direction, lot size and stop orders - will be automatically calculated by the indicator for you. After that, you open a position, and then turn off the computer and do things that are pleasant for you.
Aleksey Ivanov
Aleksey Ivanov
StatChannel https://www.mql5.com/en/market/product/37619
StatChannel is a bolinger bands indicator with no lag.
✔️The algorithms of this indicator are unique and developed by their author
Author Aleksey Ivanov https://www.mql5.com/en/users/60000382
Aleksey Ivanov
Aleksey Ivanov
Quality trend https://www.mql5.com/en/market/product/79505
The Quality trend indicator expresses the ratio of the strength of a trend or the speed of its growth (fall) to the degree of its noisiness or a certain norm of amplitudes of chaotic fluctuations of a growing (falling) price. The position of the indicator line above zero shows an increasing trend, below zero - a falling trend, the fluctuation of the indicator line near zero shows a flat.
If the indicator line begins to fluctuate rapidly around zero and approach it, then this indicates the imminent beginning of a trend movement. Quite often, an increase in the noise of even a rapidly growing trend or an increase in volatility indicates upcoming changes in the market, in particular, the end of the corresponding trend movement. Consequently, if the readings of an indicator with a high quality factor value suddenly start to decrease, then this indicates the imminent end of the corresponding trend movement. Therefore, the indicator readings are often leading and show the near end of a trend movement with a transition to a flat or even a change in the direction of the trend movement.
✔️The indicator does not lag behind and does not redraw
✔️The algorithms of this indicator are unique and developed by their author.

The algorithm of this indicator is presented in the article. https://www.mql5.com/ru/articles/12891
Aleksey Ivanov
Aleksey Ivanov
StochasticExtrapolator https://www.mql5.com/en/market/product/80820
The indicator predicts the future values of the Stochastic indicator, which allows you to use this indicator much more efficiently.
The market has a very short memory; in any case, the information that formally describes it quickly becomes obsolete and loses its weight in the formation of the current price. Therefore, wavelet analysis is the most promising for predicting future market parameters. The author uses a number of wavelet functions (including the Morlet wavelet and a somewhat modified Gaussian function, which are shown in the last screenshot), the expansion by which, with a sufficient degree of reliability, allows extrapolating future values of oscillator indicators.
Author Aleksey Ivanov https://www.mql5.com/en/users/60000382
Aleksey Ivanov
Aleksey Ivanov
Channel Builder FREE https://www.mql5.com/en/market/product/34818
The Channel Builder (CB) or Ivanov Bands indicator is a broad generalization of the Bollinger Bands indicator. First, in CB, the mean line is calculated using various averaging algorithms. Secondly, the mean deviations calculated by Kolmogorov averaging are plotted on both sides of the middle line .
✔️The algorithms of this indicator are unique and developed by their author
Author Aleksey Ivanov https://www.mql5.com/en/users/60000382
Aleksey Ivanov
Aleksey Ivanov
Alligator Analysis FREE https://www.mql5.com/en/market/product/35227
The “Alligator Analysis” (AA) indicator allows you to build various (by averaging types and by scales) “Alligators” and their combinations, i.e. allows you to analyze the state of the market based on the correlation of this state with a whole range of different "Alligators". The classic "Alligator" by Bill Williams is based on moving averages and Fibonacci numbers, which makes it one of the best indicators now. The classic "Alligator" is based on Fibonacci numbers and is a combination of three smoothed moving averages (SМMA) with periods 5, 8 and 13, which are part of the Fibonacci sequence. In this case, the moving averages are shifted forwards by 3, 5, and 8 bars, respectively, which are numbers from the same sequence (preceding the corresponding period values).
Alligators from the AA indicator is based, on the same principle as the classic “Alligator”, but on different parts of a number of Fibonacci numbers, as well as on different moving average averaging algorithms.
The indicator AA uses 6 types of averaging, where the classical averaging SMA, EMA, SMMA, LMA are supplemented by averaging the moving average by the median and averaging weighted by volume.
Line shifts can be removed. The colors of the AA indicator lines are set according to the type of color spectrum: from violet for a small smoothing period to red - for the largest period.
Author Aleksey Ivanov https://www.mql5.com/en/users/60000382
Aleksey Ivanov
Aleksey Ivanov
Estimation moving average without lag https://www.mql5.com/en/market/product/36945
A simple moving average (SMA) with an averaging period (2n + 1) of bars is always obtained lagging by n bars. If SMA or other types of moving averages are the basis for making trading decisions, then their strong delay does not allow to open positions in time and close positions, which leads to losses.
The Estimation moving average without lag indicator calculates an estimate of a non-lagging moving average and displays the corresponding confidence interval.
✔️The algorithms of this indicator are unique and developed by their author
Author Aleksey Ivanov https://www.mql5.com/en/users/60000382
Aleksey Ivanov
Aleksey Ivanov
Iterative Moving Average https://www.mql5.com/en/market/product/31714
Iterative Moving Average – IMA. IMA is obtained by correcting the usual MA. The correction consists in addition to MA averaged difference between the time series (X) and its MA, i.e. IMA(X)=MA(X) + MA (Х-MA(X)). Correction is done in several iterations (and, exactly, 2 iterations in this indicator) and with a change in the averaging period.
As a result, the time-series points begin to cluster around (on all sides) of the getting IMA and with a smaller delay than around the usual MA. Therefore, IMA is a more effective tool for manual and automatic trading than all types of conventional MA (SMA, EMA, SSMA, LMA).
✔️The algorithms of this indicator are unique and developed by their author
Author Aleksey Ivanov https://www.mql5.com/en/users/60000382
Aleksey Ivanov
Aleksey Ivanov
Scientific trade https://www.mql5.com/en/market/product/98467
An extremely convenient indicator that truly makes the process of making money on the exchange easy. It is based on the scientifically rigorous theory of the market developed by the author, the beginning of which is presented https://www.mql5.com/en/articles/10955 .

The full algorithm of this indicator operation is presented in the article. https://www.mql5.com/ru/articles/12891

The indicator calculates the most probable price movement trajectory and displays it on the chart. Based on the predicted price movement trajectory, the indicator calculates the direction of the position and the position of the take profit. Based on the statistically calculated uncertainty of the trajectory of the predicted price movement, the selected risk level and the size of the deposit, the indicator also calculates the lot size and stop loss position. The averaging period of the indicator is selected based on the maximum probability of winning, which is presented for each period on the main chart of the trading terminal.
It is better to use M1-M15 timeframes in the indicator; at the same time, it is recommended to play according to the global trend, determined on H4, D1, i.e. if the indicator gives a SELL signal, then this position is opened when the global trend is down; if the indicator signal is BUY, then the position is opened when the global trend is up.
After choosing a timeframe, you sort through the averaging values like 20, 30, 40, …, 200 and look at the trading terminal at what value the maximum probability of winning is achieved. This is the value you should use. Since the averaging period of the indicator must be selected manually in the process of moving along the price history, the indicator readings in the tester cannot reflect the full effectiveness of its work and may be incorrect.
To automatically determine the optimal averaging period (which gives the maximum probability of winning), the CalculateScientificTradePeriod script has been developed. https://www.mql5.com/en/market/product/99909

The operation of the indicator is based on predicting the market's own trends, so it is not recommended to use it before and immediately after strong news, as well as in case of strong market volatility, especially if the volatility is the result of crisis processes. The indicator's forecast period, which is its averaging period, should not go beyond the future moment of strong news release.
Before opening a position, you should only assess the state of the market and take into account news factors.
Everything else - position direction, lot size and stop orders - will be automatically calculated by the indicator for you. After that, you open a position, and then turn off the computer and do things that are pleasant for you.
Aleksey Ivanov
Aleksey Ivanov
Signal Bands https://www.mql5.com/en/market/product/29171
Signal Bands is a sensitive and convenient indicator, which performs deep statistical processing of information. It allows to see on one chart (1) the price trend, (2) the clear price channel and (3) latent signs of trend change. The indicator can be used on charts of any periods, but it is especially useful for scalping due to its high sensitivity to the current market state.
✔️The indicator has all types of alerts.
✔️The indicator does not redraw.
✔️The algorithms of this indicator are unique and developed by their author
Author Aleksey Ivanov https://www.mql5.com/en/users/60000382
Aleksey Ivanov
Aleksey Ivanov
Robust filter https://www.mql5.com/en/market/product/52668
The Robust filter indicator is based on the robust filtering algorithm developed by the author using the multi-period averaged moving median.
The indicator calculates and shows:
✔️1. The direction of the trend;
✔️2. Entry and exit points of positions;
✔️3. StopLoss lines calculated from current price probability distributions and selected probability of closing an order by StopLoss before the trend reversal;
✔️4. Lot sizes based on the accepted risk level, deposit size and StopLoss position.
============================================================
✔️The indicator has all kinds of alerts.
✔️The indicator does not redraw.
✔️The indicator can be used both for trading scalper strategies and for long-term trading strategies.
Author Aleksey Ivanov https://www.mql5.com/en/users/60000382
Aleksey Ivanov
Aleksey Ivanov
Probabilities distribution of price https://www.mql5.com/en/market/product/27070
Indicator is used for:
1. defining price probability distributions. This allows for a detailed representation of the channel and its borders and forecast the probability of a price appearing at each segment of its fluctuations;
2. defining the channel change moment.
✔️The algorithms of this indicator are unique and developed by their author
✔️ It has built-in management
Author Aleksey Ivanov https://www.mql5.com/en/users/60000382
Aleksey Ivanov
Aleksey Ivanov
Prof MACD (MT5) https://www.mql5.com/en/market/product/65276
✔️ One of my most profitable indicators with optimal filtering.
✔️The algorithms of this indicator are unique and developed by their author
✔️The indicator has all kinds of alerts.
✔️ The indicator does not redraw.
Author Aleksey Ivanov https://www.mql5.com/en/users/60000382
Aleksey Ivanov
Aleksey Ivanov
Asummetry https://www.mql5.com/en/market/product/40005
The Asummetry indicator allows you to predict the beginning of a change in the direction of trends, long before their visual appearance on the price chart.
✔️The algorithms of this indicator are unique and developed by their author
Author Aleksey Ivanov https://www.mql5.com/en/users/60000382
Aleksey Ivanov
Aleksey Ivanov
Strong Trend Flat Signal https://www.mql5.com/en/market/product/37203
The Strong Trend Flat Signal indicator is the intersection of two, developed by the author, non-lagging moving averages with averaging periods 21 and 63.
✔️The algorithms of this indicator are unique and developed by their author
Author Aleksey Ivanov https://www.mql5.com/en/users/60000382