AT24 Divergence Pro
- Индикаторы
-
Pravin Awari
 # Algotraders24 AI
We build trading tools for MetaTrader 5: Expert Advisors, indicators and utilities for Forex, gold, indices and crypto.
## What we do
- MetaTrader 5 Expert Advisors and indicators
- Testing, validation and risk analysis of our own products - Версия: 1.0
- Активации: 5
AT24 Divergence Pro shows RSI divergences that do not repaint and keeps a record of how past divergences played out on your chart.
What it does
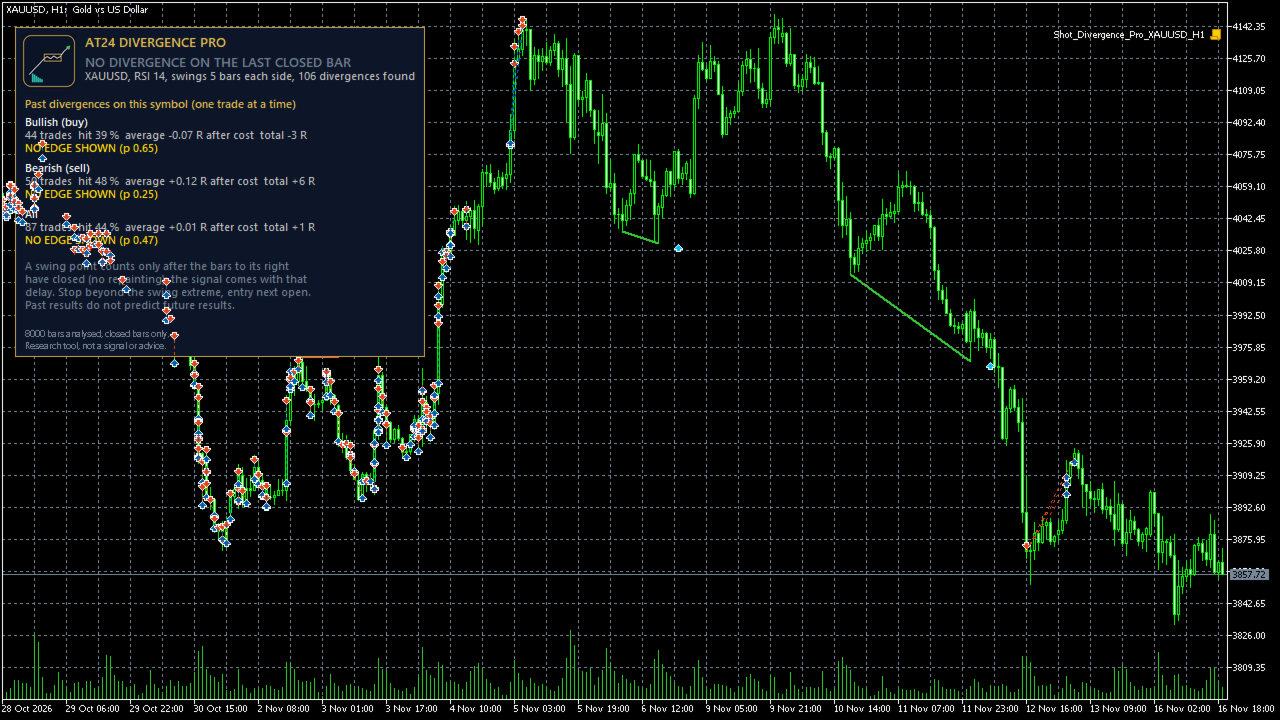
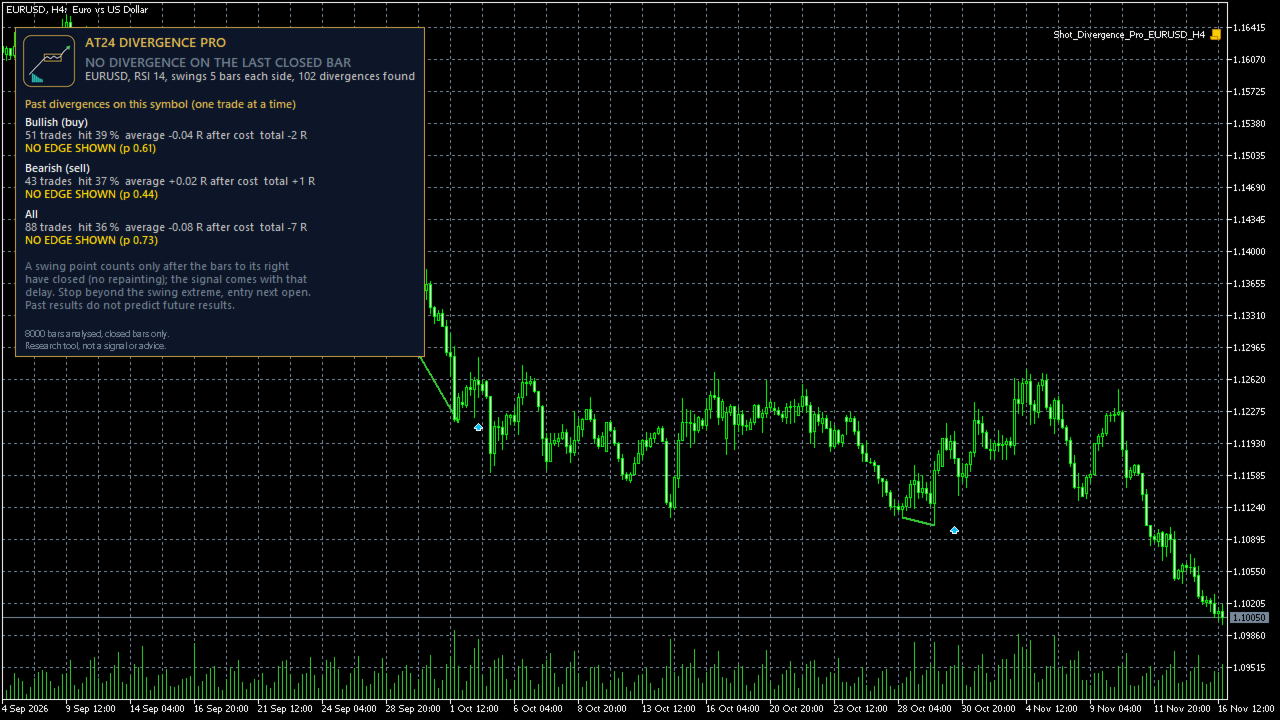
The indicator compares price swings with RSI swings, draws a line between the two swings and an arrow on the bar where the divergence is confirmed. For a divergence that has just been confirmed it shows an entry level, a stop level and a target level, so the idea is visible before any trade.
No repainting
A swing point is used only after the bars to its right have closed. The signal therefore arrives a few bars after the swing, and drawn divergences do not move or disappear later.
The scorecard
Every past divergence is scored as a trade on the history of the chart you are on. A small table lists bullish, bearish and all divergences: number of trades, hit rate, average result in R after cost, total R and a luck test. When the history shows no edge beyond chance, the table says so. When there are too few trades, it says that too.
Points to know
RSI and swing settings, trade plan settings (stop buffer, reward to risk, holding period, cost), number of bars analysed, alerts and dashboard position. The dashboard is hidden in the Strategy Tester by default.
Notes
Works on any symbol and timeframe that has enough history. Cost is taken from the current spread unless you set it. Slippage and gaps are not modelled in the scorecard.
Research and planning tool, not a signal or a forecast. Past results do not predict future results. Not financial advice.
What it does
The indicator compares price swings with RSI swings, draws a line between the two swings and an arrow on the bar where the divergence is confirmed. For a divergence that has just been confirmed it shows an entry level, a stop level and a target level, so the idea is visible before any trade.
No repainting
A swing point is used only after the bars to its right have closed. The signal therefore arrives a few bars after the swing, and drawn divergences do not move or disappear later.
The scorecard
Every past divergence is scored as a trade on the history of the chart you are on. A small table lists bullish, bearish and all divergences: number of trades, hit rate, average result in R after cost, total R and a luck test. When the history shows no edge beyond chance, the table says so. When there are too few trades, it says that too.
Points to know
- The calculation chain was compared with an independent calculation on the same bars and gave identical numbers.
- The scorecard is in-sample. Several inputs can be changed, and tuning them until a table looks good will find a lucky result. Treat the table as research, not as a forecast.
- Only regular divergence is included.
- Optional alert and push notification at bar close. They are off by default and have not yet been watched on a long live session.
- The indicator places no trades.
RSI and swing settings, trade plan settings (stop buffer, reward to risk, holding period, cost), number of bars analysed, alerts and dashboard position. The dashboard is hidden in the Strategy Tester by default.
Notes
Works on any symbol and timeframe that has enough history. Cost is taken from the current spread unless you set it. Slippage and gaps are not modelled in the scorecard.
Research and planning tool, not a signal or a forecast. Past results do not predict future results. Not financial advice.