MQL Pro Trader
- Утилиты
-
Ronaldo Castor da Silva
 MQL5 Developer & Trader | Creator of MQL PRO TRADER
I develop software and tools for MetaTrader 5, with a focus on trading automation, position management, execution and practical workflow. - Версия: 5.0
- Активации: 20
**MQL PRO TRADER — execution panel, position manager and built-in performance analytics.**
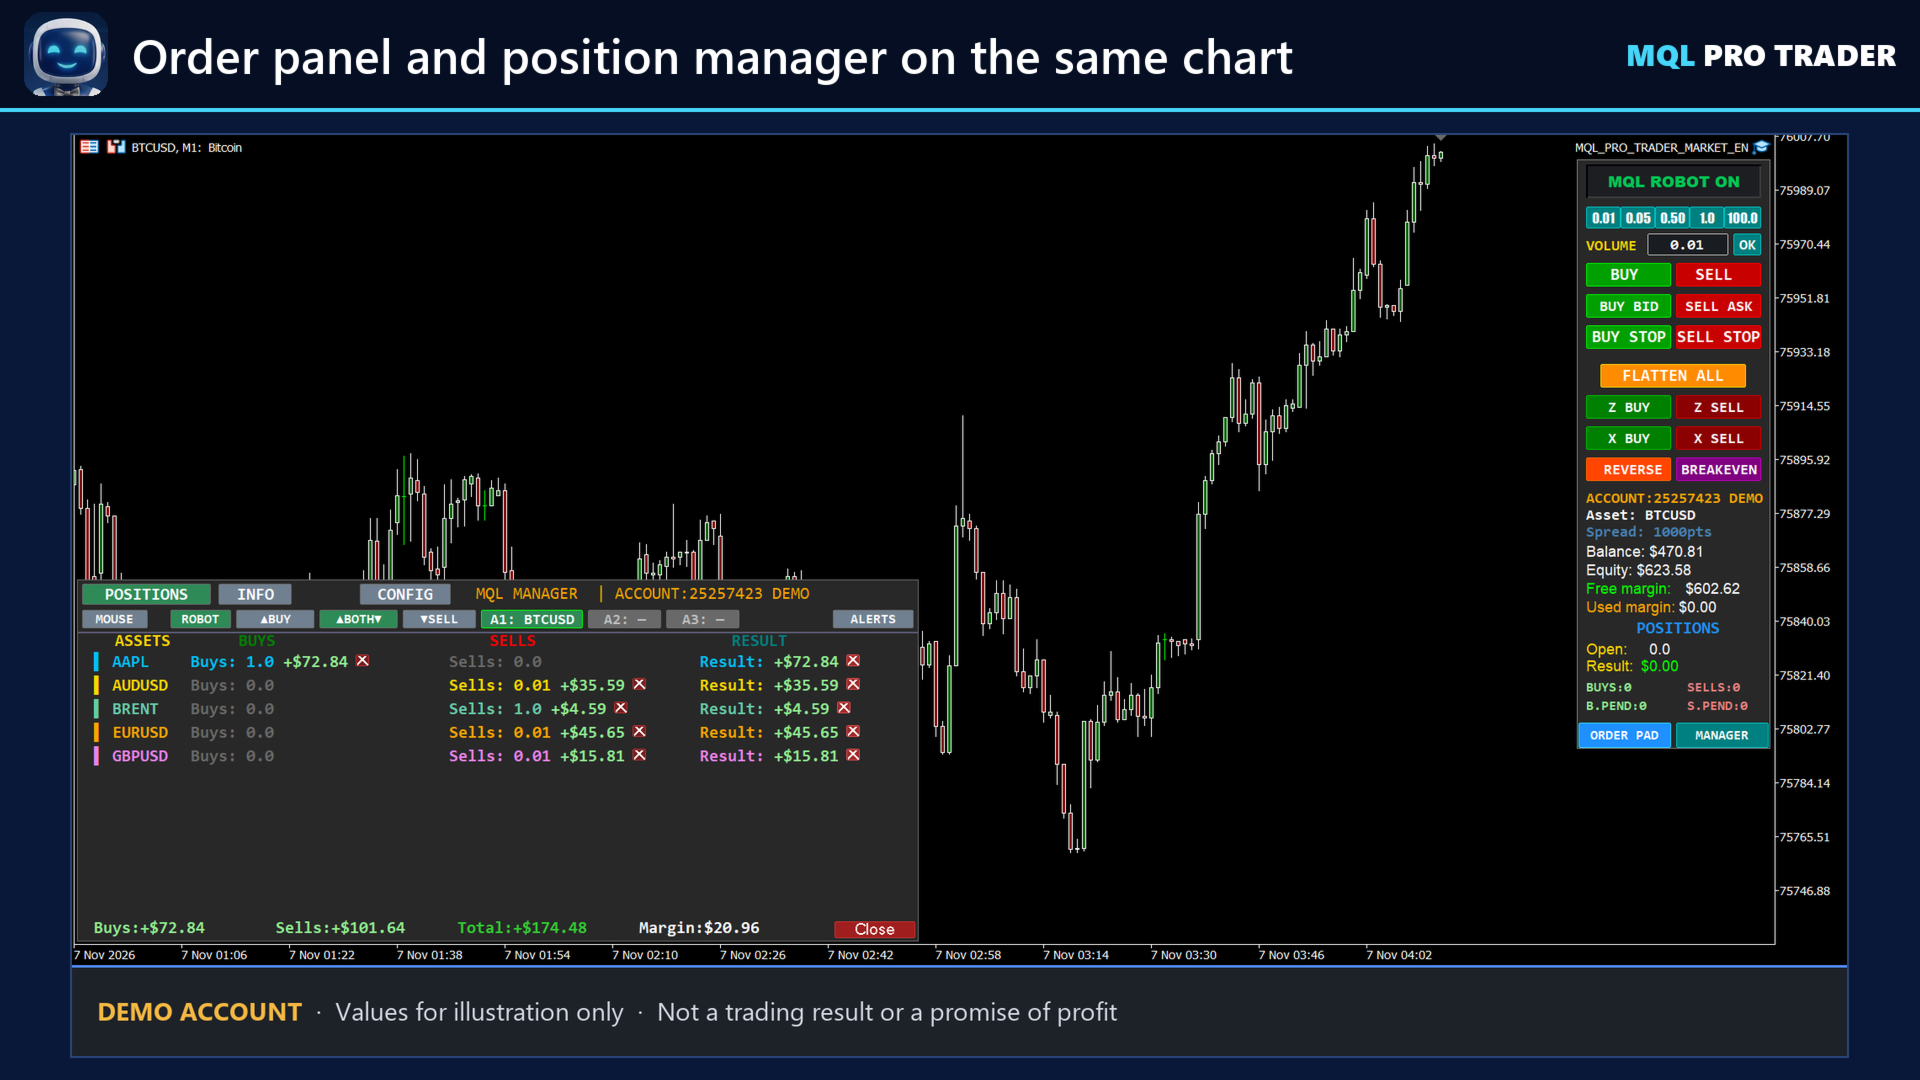
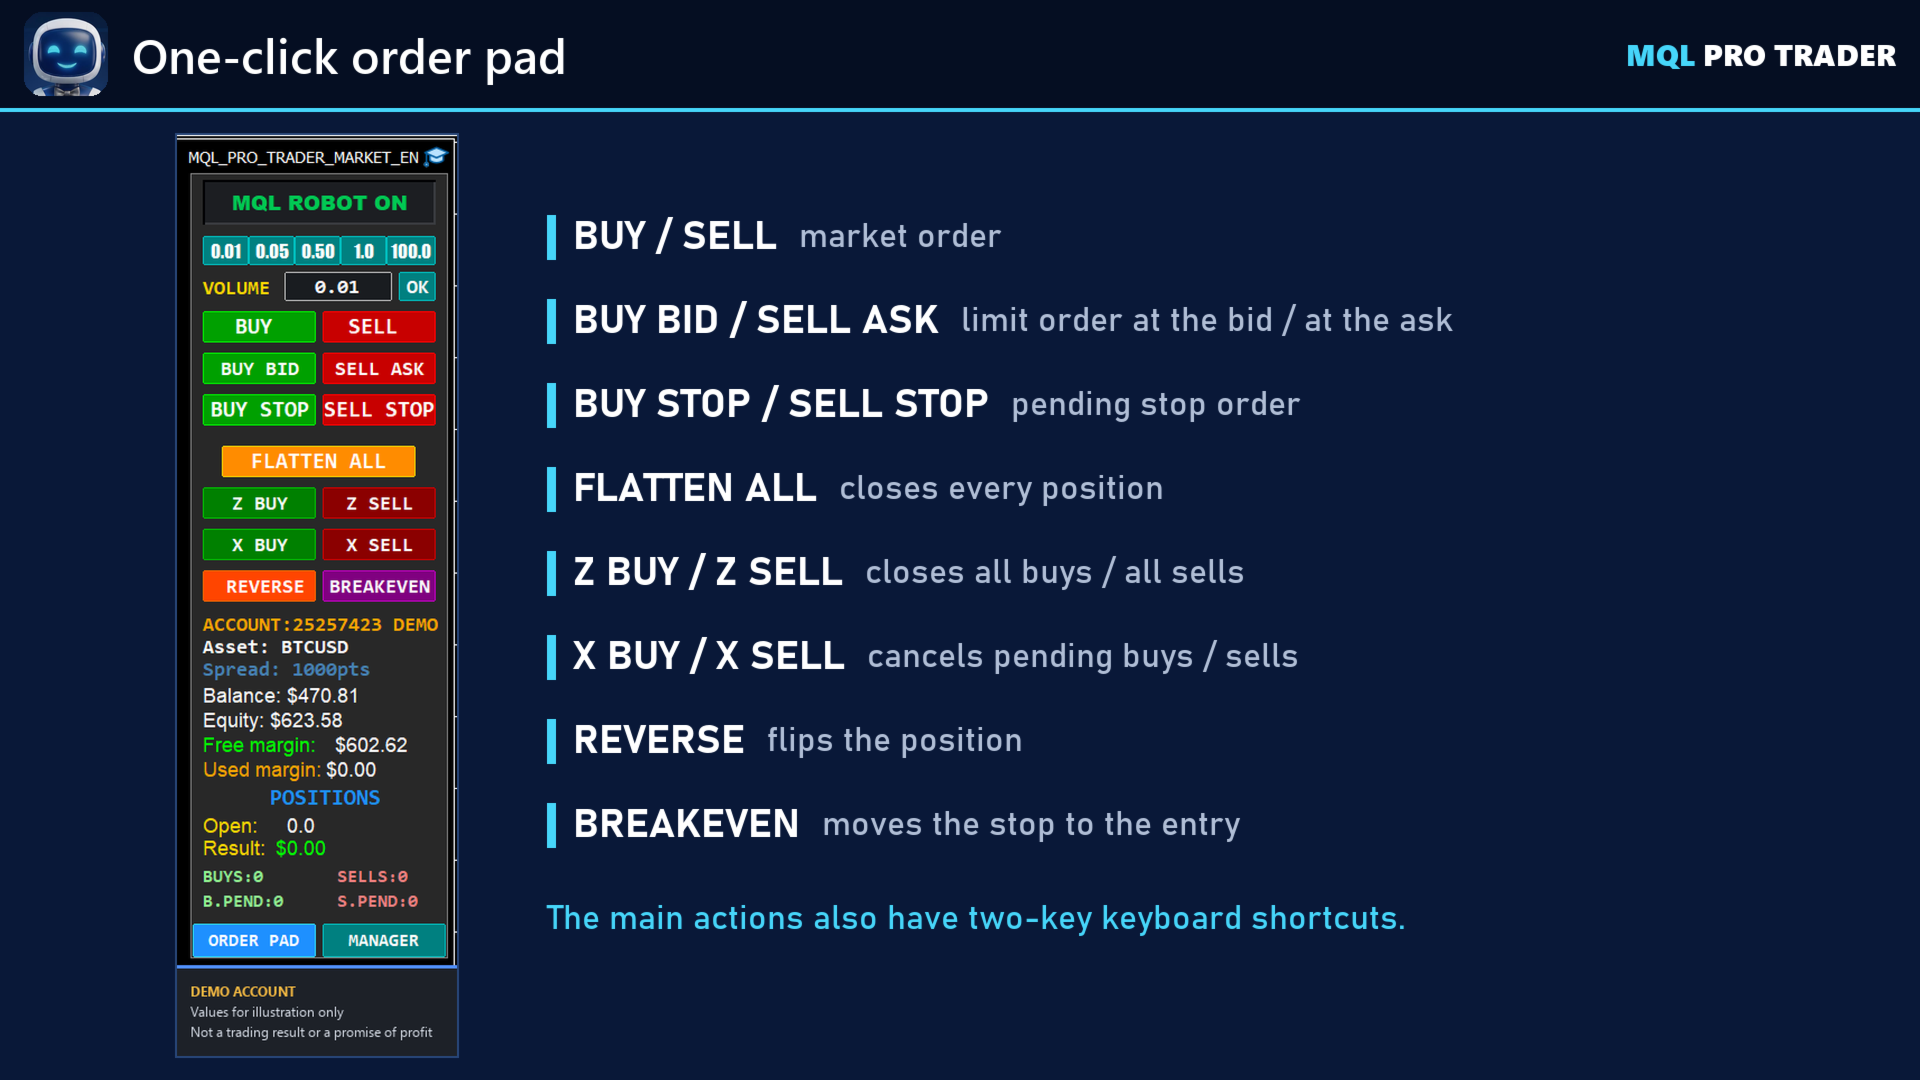
A trading toolkit for MetaTrader 5: an on-chart order panel, a position manager with partial targets,
a rule engine you write yourself, and a performance report built from your own account history.
You decide the rules; the robot executes them.
**IT RUNS ENTIRELY INSIDE YOUR TERMINAL**
No DLL. No web requests. No API key. Nothing about your account, your trades or your results leaves
your computer. Everything you see, including the performance report, is computed locally from the
history your terminal already has.
**WRITE YOUR OWN RULES**
Entries, exits and stop management are written as short expressions, in plain text:
HIGH[0]>HIGH[1] @MARKET -> SetVolume[0.01]
Ten independent slots for buy rules, ten for sell rules, ten for exits and ten for stop/target
management. They run at the same time, so several setups can coexist on one chart.
The examples ship disabled on purpose: a rule starting with // is ignored. The robot never trades
before you have read what it would do.
Trading by hand on the same symbol? One switch keeps the robot's exits and stop management away from
the positions you opened yourself.
**A LIBRARY OF READY STRATEGIES TO STUDY AND TEST**
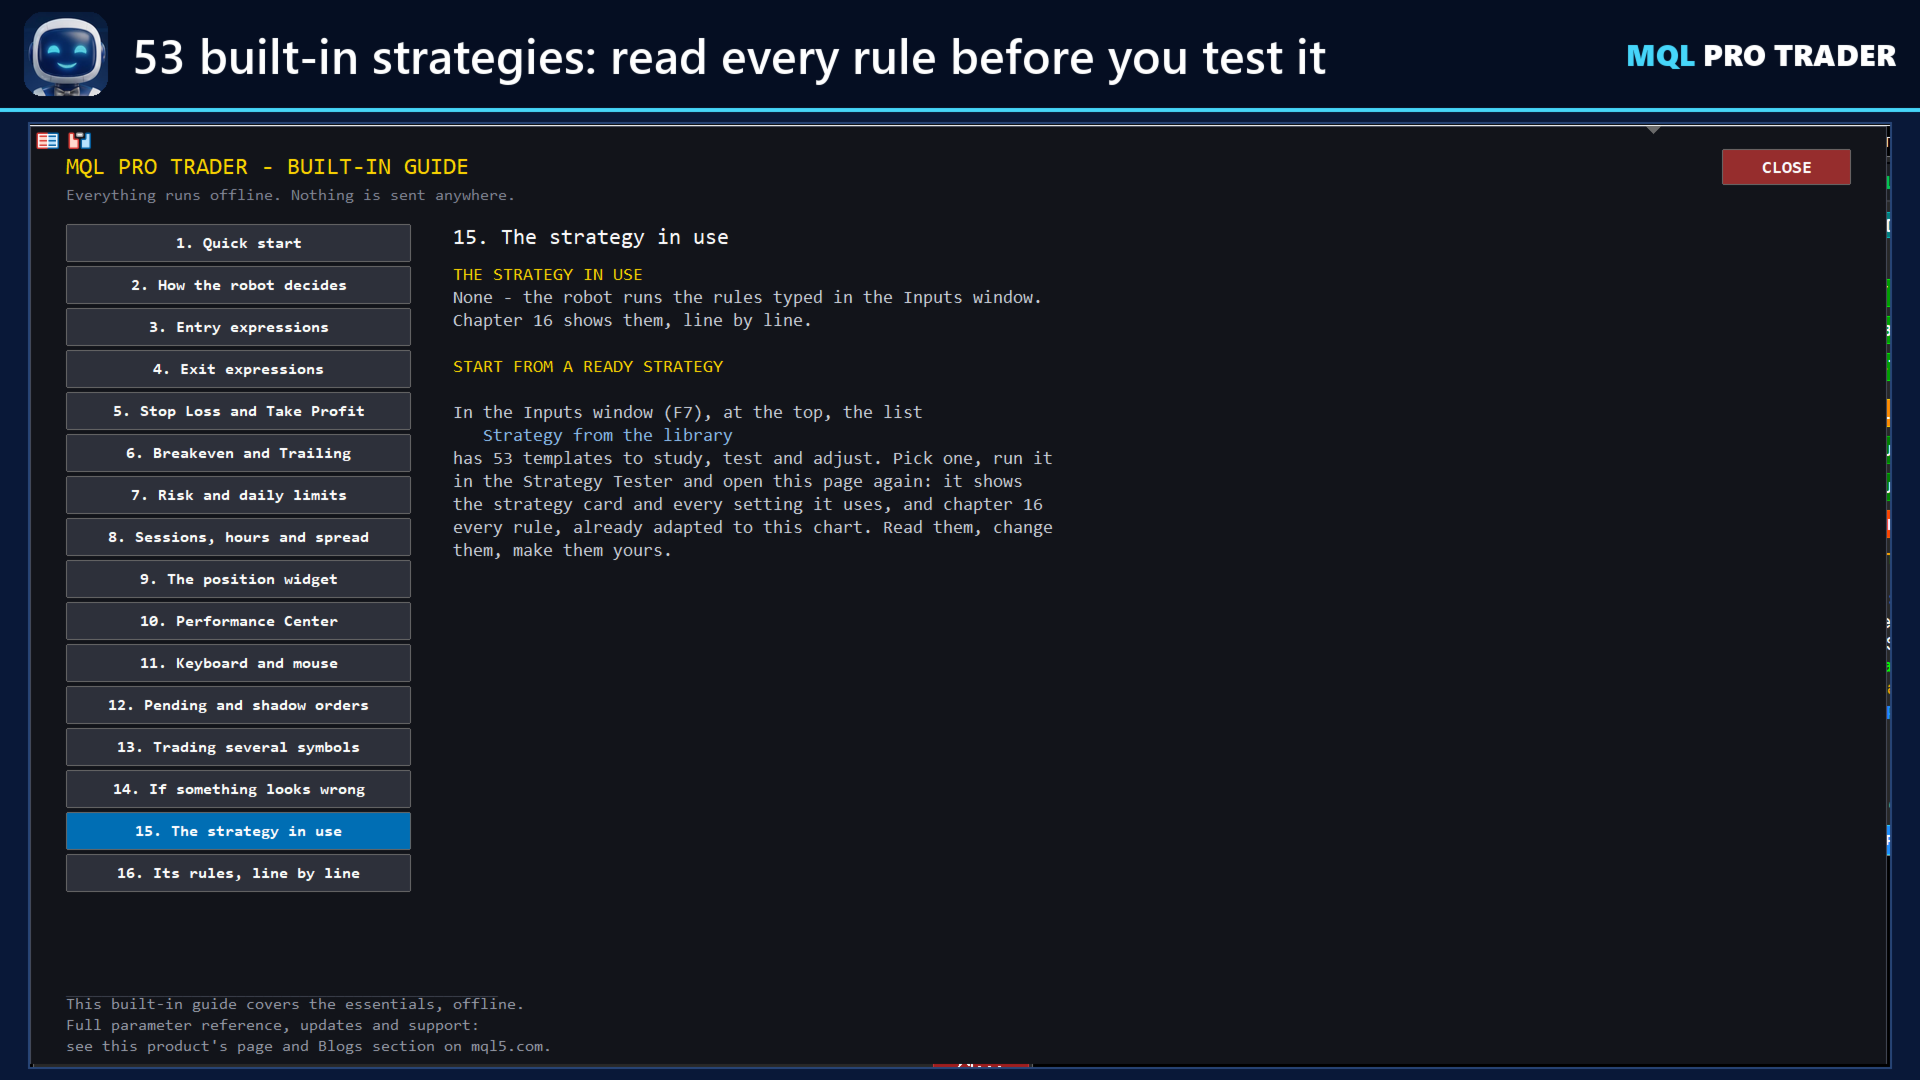
53 complete strategies are built in — price action, indicators, sessions, complete systems, money
management, multi-symbol and Brazilian exchange setups — each written in the same rule language, so
you can read every line of it — on the panel (INFO > STRATEGY) and in the Blogs section, all 53 rule by
rule. Pick one in "Strategy from the library" and run it in the Strategy
Tester: the Journal prints the strategy card, every rule it switched on, and how it was adapted to
your symbol.
Before applying a strategy, the tool measures your chart and your broker — the typical candle range,
the spread, the minimum stop distance, the lot step — and gives a verdict: FITS, WARN or DOES NOT
FIT, with the reason. A strategy that does not fit is not applied.
They are templates to study, test and adjust, not recommendations: any result, profit or loss,
belongs to whoever trades them. The robot saves each strategy, already adapted to your chart, as a
file you can load in the Inputs and change your way.
On a live account a strategy starts in OBSERVE mode: it marks on the chart where it would enter and
sends no order, until you switch on "LIVE account: the strategy may send orders". While it runs, the
robot's exits and stop management touch only the positions the strategy opened, never the ones you
opened by hand, and the session hours follow your broker's clock.
**IT TELLS YOU WHY IT DID NOT TRADE**
At the end of every test, and once a day on a live chart, the Journal explains every candle: where
it stopped on the way to an order (hours, limits, filters, the rule itself) and, for each rule,
which condition held it back most. On a live chart the alerts panel also shows a card when the robot
is on and did not enter today.
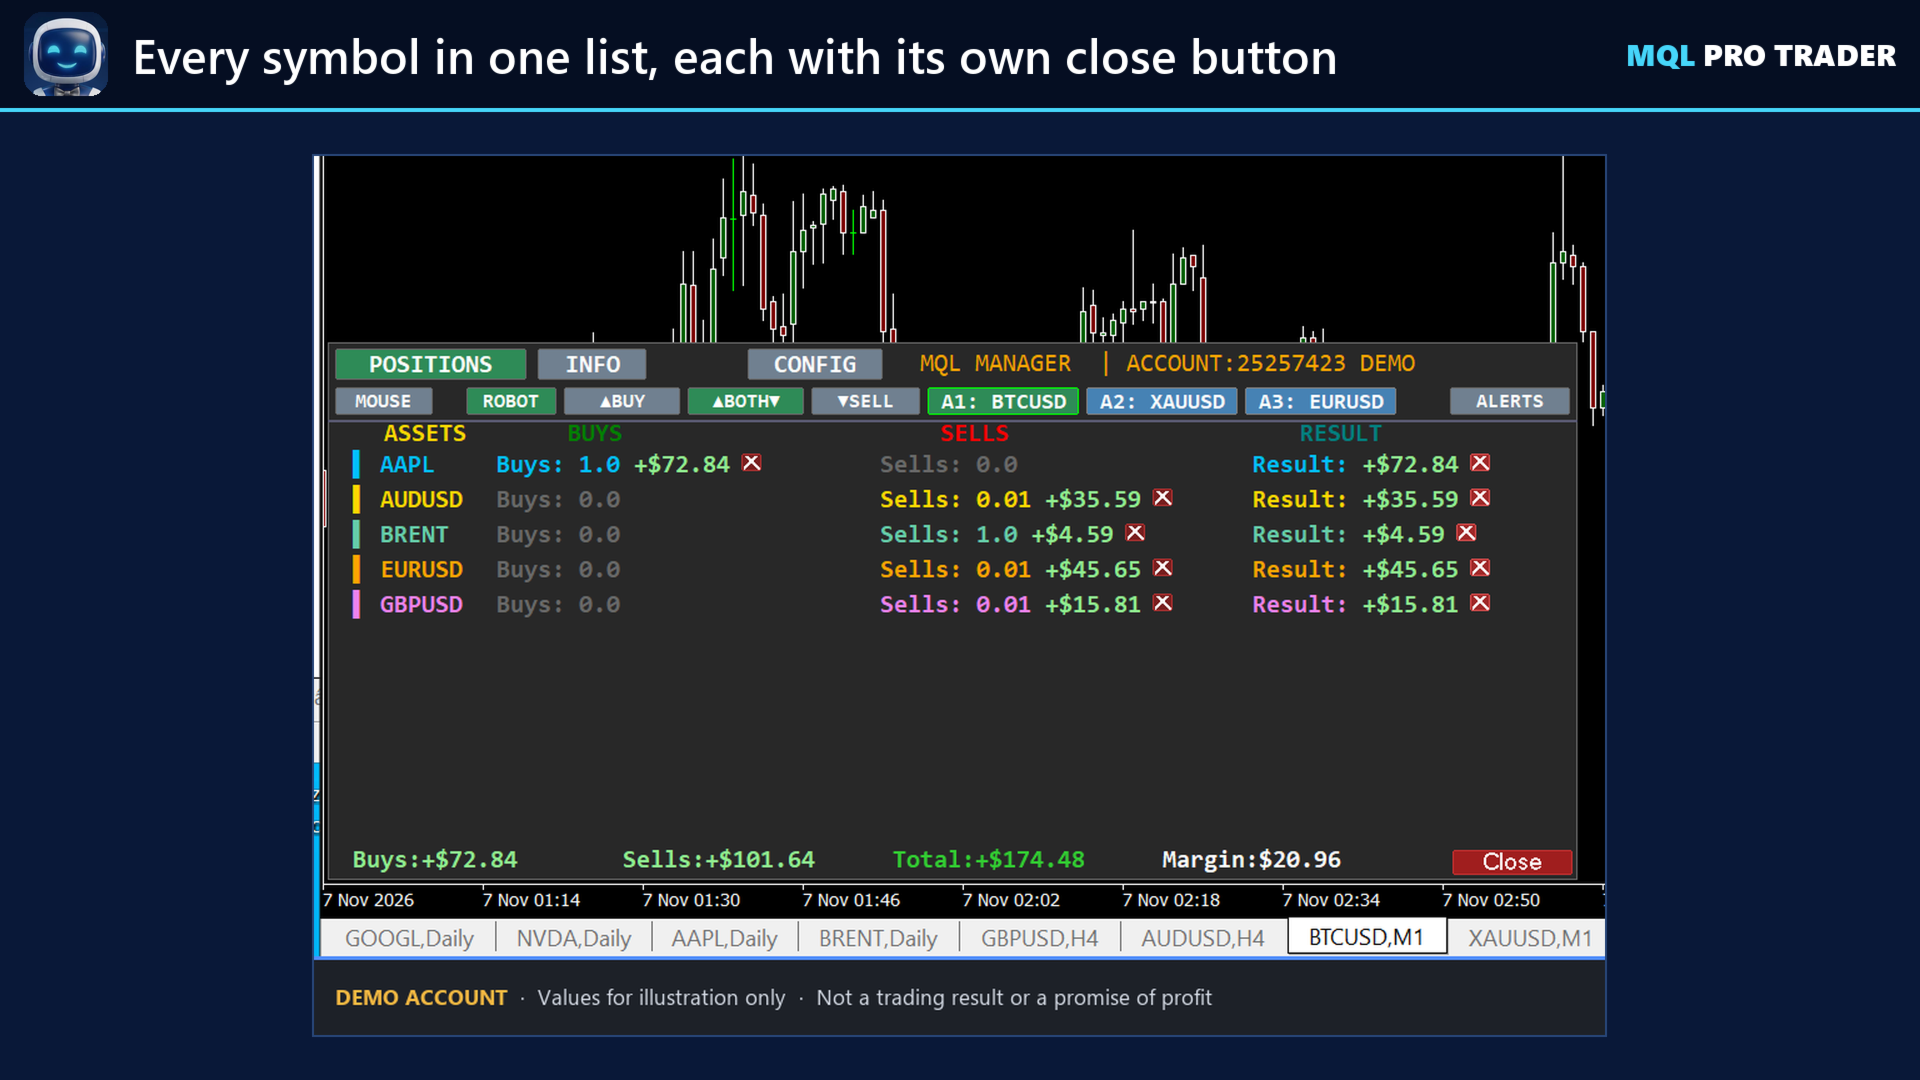
**TRADE UP TO THREE SYMBOLS FROM ONE CHART**
A1 is the chart symbol; A2 and A3 are yours to choose. One copy of the tool, three markets, without
opening three charts.
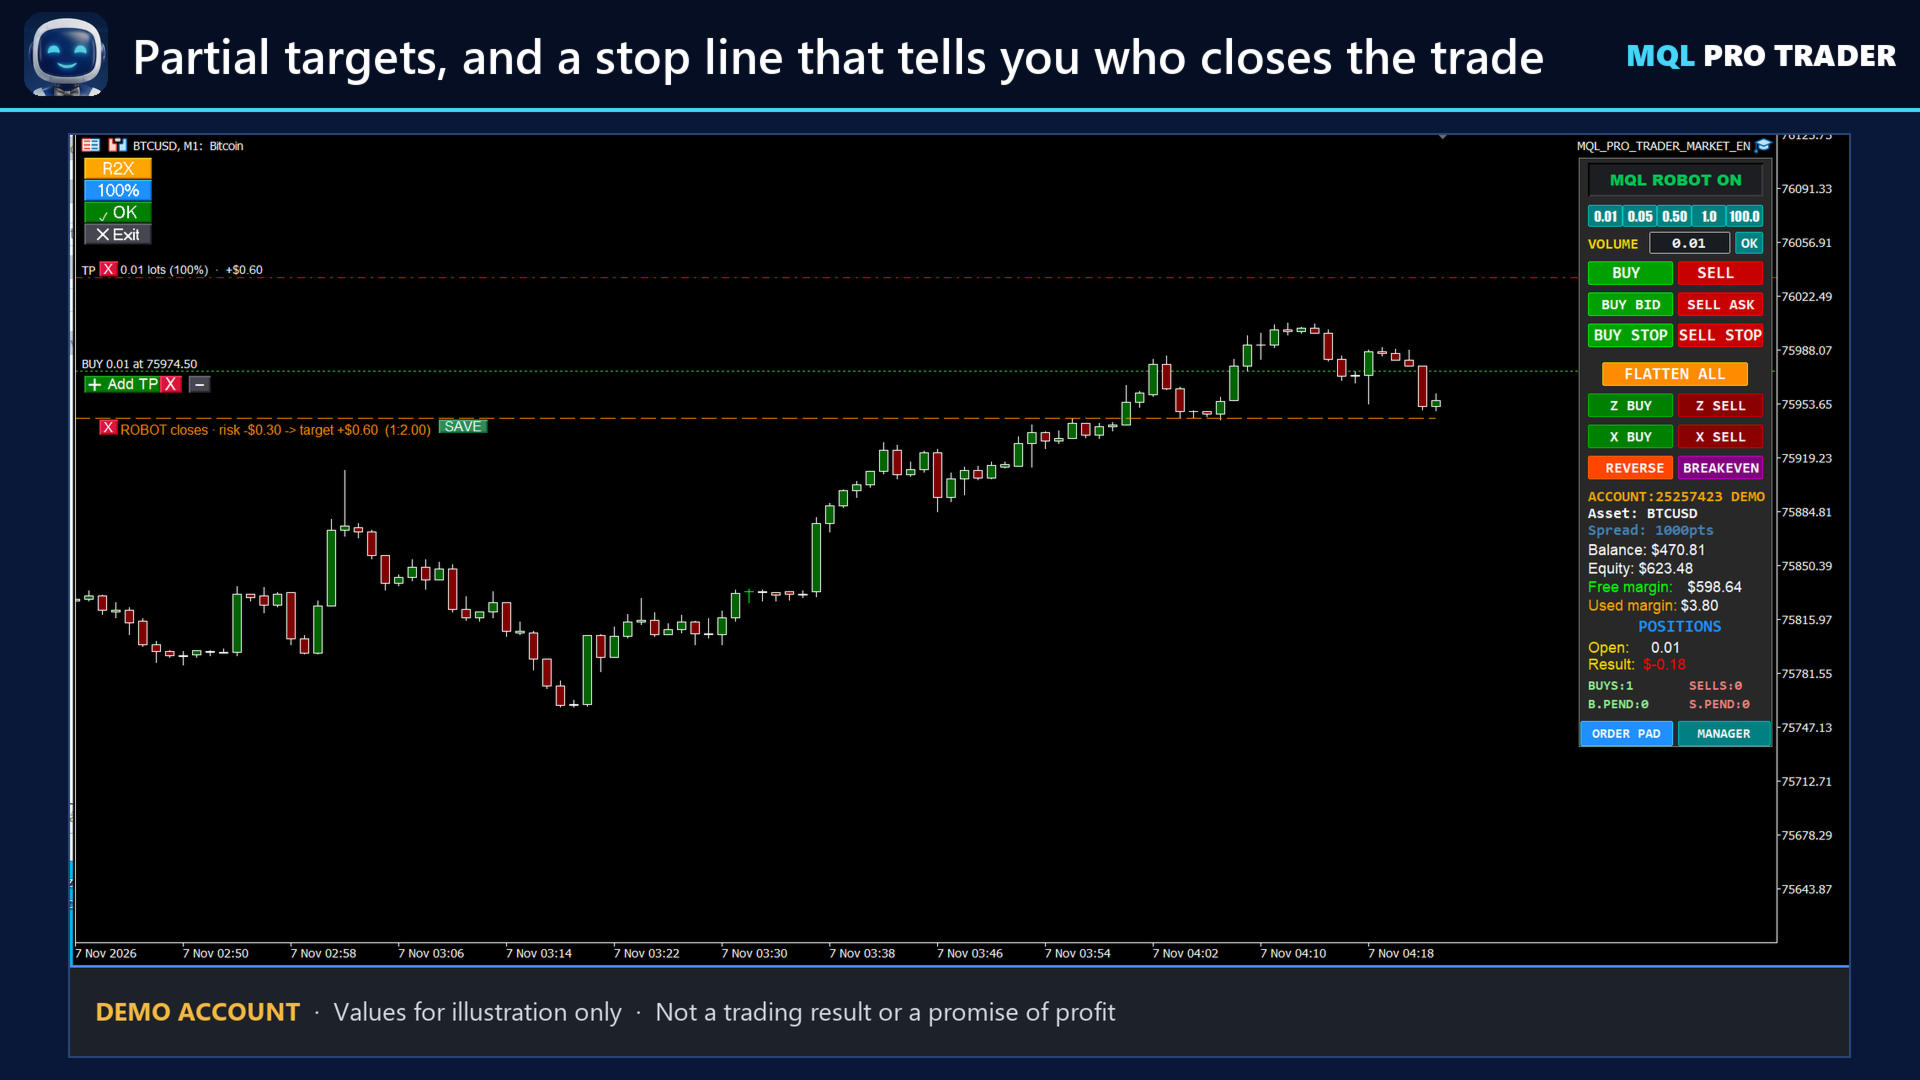
**MANAGE THE POSITION ON THE CHART**
Every open position gets a small widget next to its entry: add partial targets with a volume
percentage, close the position, or hide its labels. The close button asks twice — the first click
arms it, the second executes.
A single target that closes 100% is saved as the broker's take profit, so it holds even with the
terminal closed. With several partial targets the tool executes them itself while the terminal is
running.
A stop line is drawn for every position. Its label answers one question: if price reaches here, WHO
closes the trade — the broker, the robot, or nobody — and shows the risk, or the profit already
locked once the stop passes the entry. Drag the line to try a new level; click SAVE to send it to
the broker. A stop you saved can only be tightened by breakeven or trailing, never loosened.
**BUILT-IN PERFORMANCE CENTER**
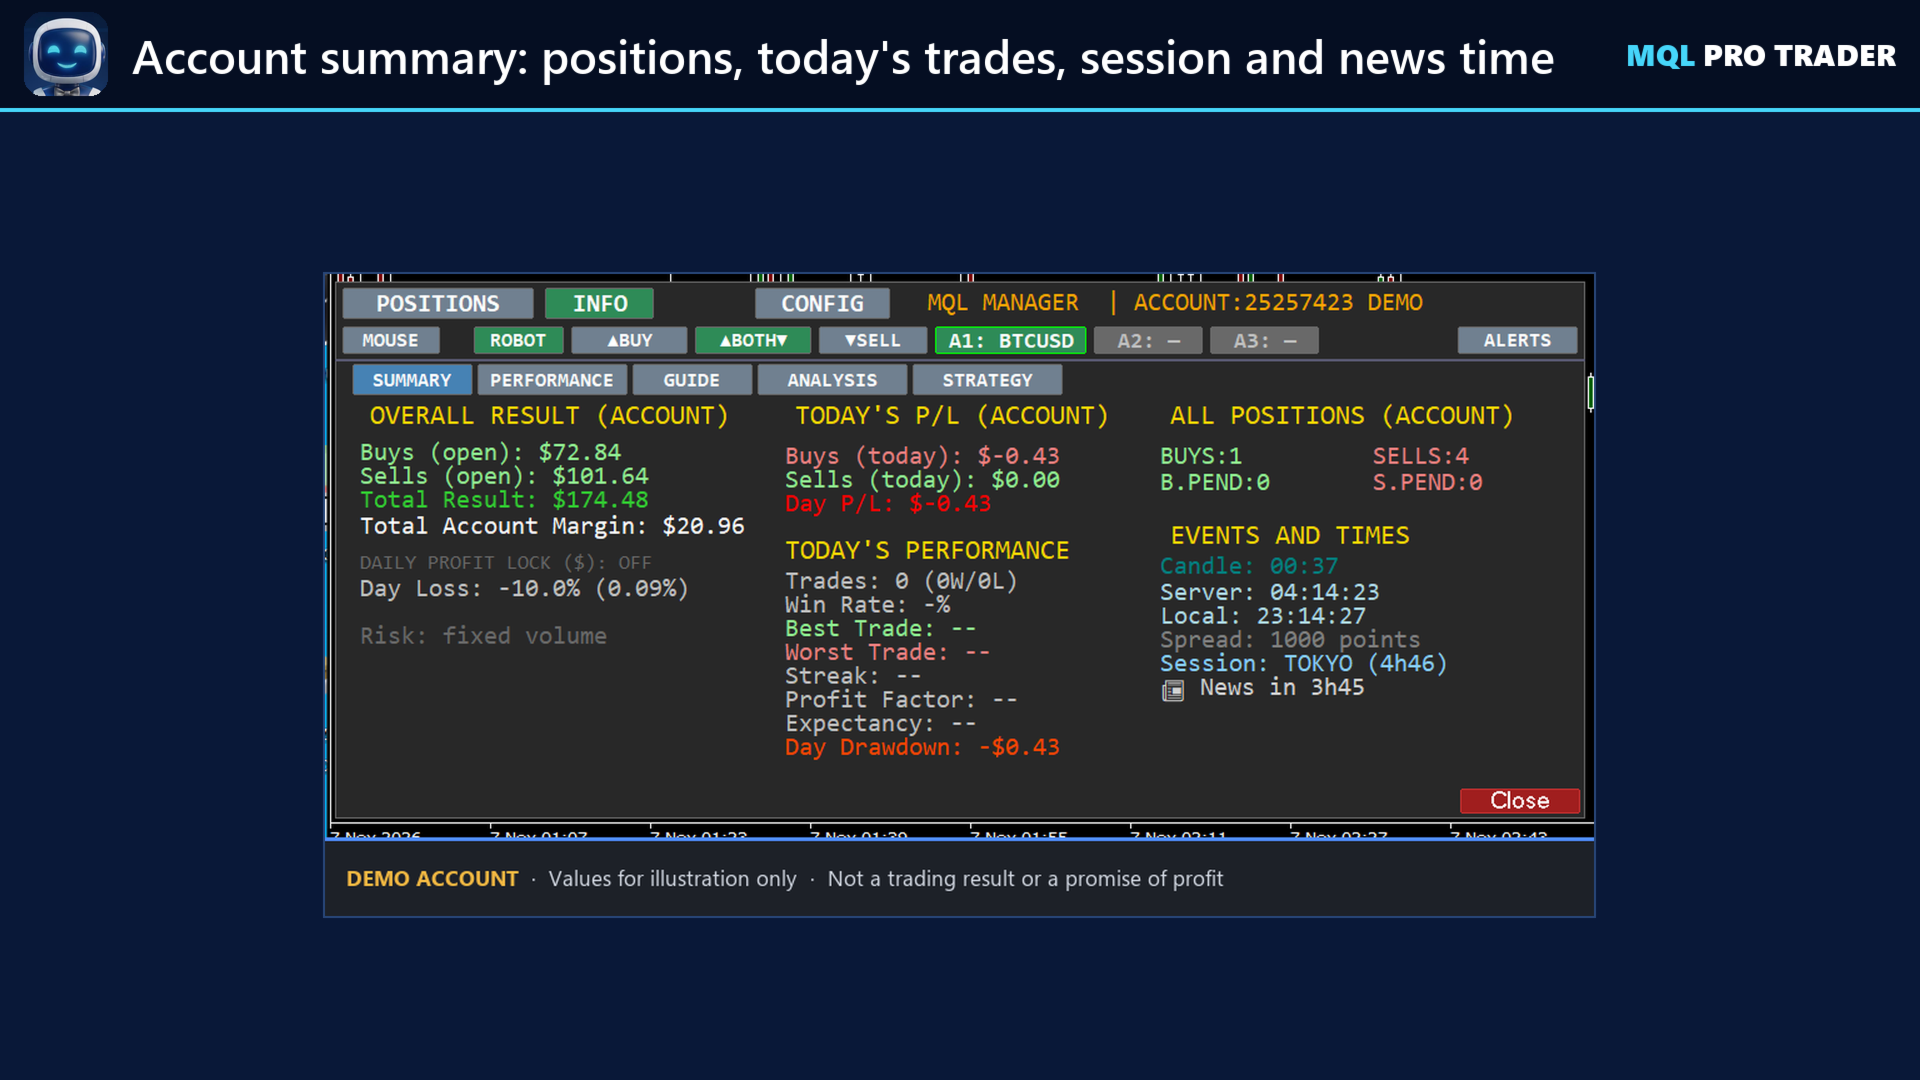
A tab inside the panel turns your closed deals into the numbers that actually describe a strategy:
net result, win rate, profit factor, expectancy, maximum drawdown with recovery factor, and payoff,
plus average win and loss, best and worst trade, and costs. Filter by today, this month, or the whole
account. Swap and commission are already subtracted.
**SYMBOL ANALYSIS**
A deterministic market reading built from the chart itself: Dow structure, break of structure, swing
position, volume against its average, absorption and climax. It returns a direction, a confidence
value and — most importantly — the list of reasons behind it, so you can disagree with it.
Your own rules can read it too: the direction and the confidence are values you can use in an entry
or exit expression. It is recalculated on every new candle, and a reading that has already triggered
an entry is not reused for another entry on the same candle.
It is not a black box and it is not artificial intelligence: it is a set of rules with weights you
can read in the manual. The same chart always produces the same reading, and it works in the Strategy
Tester.
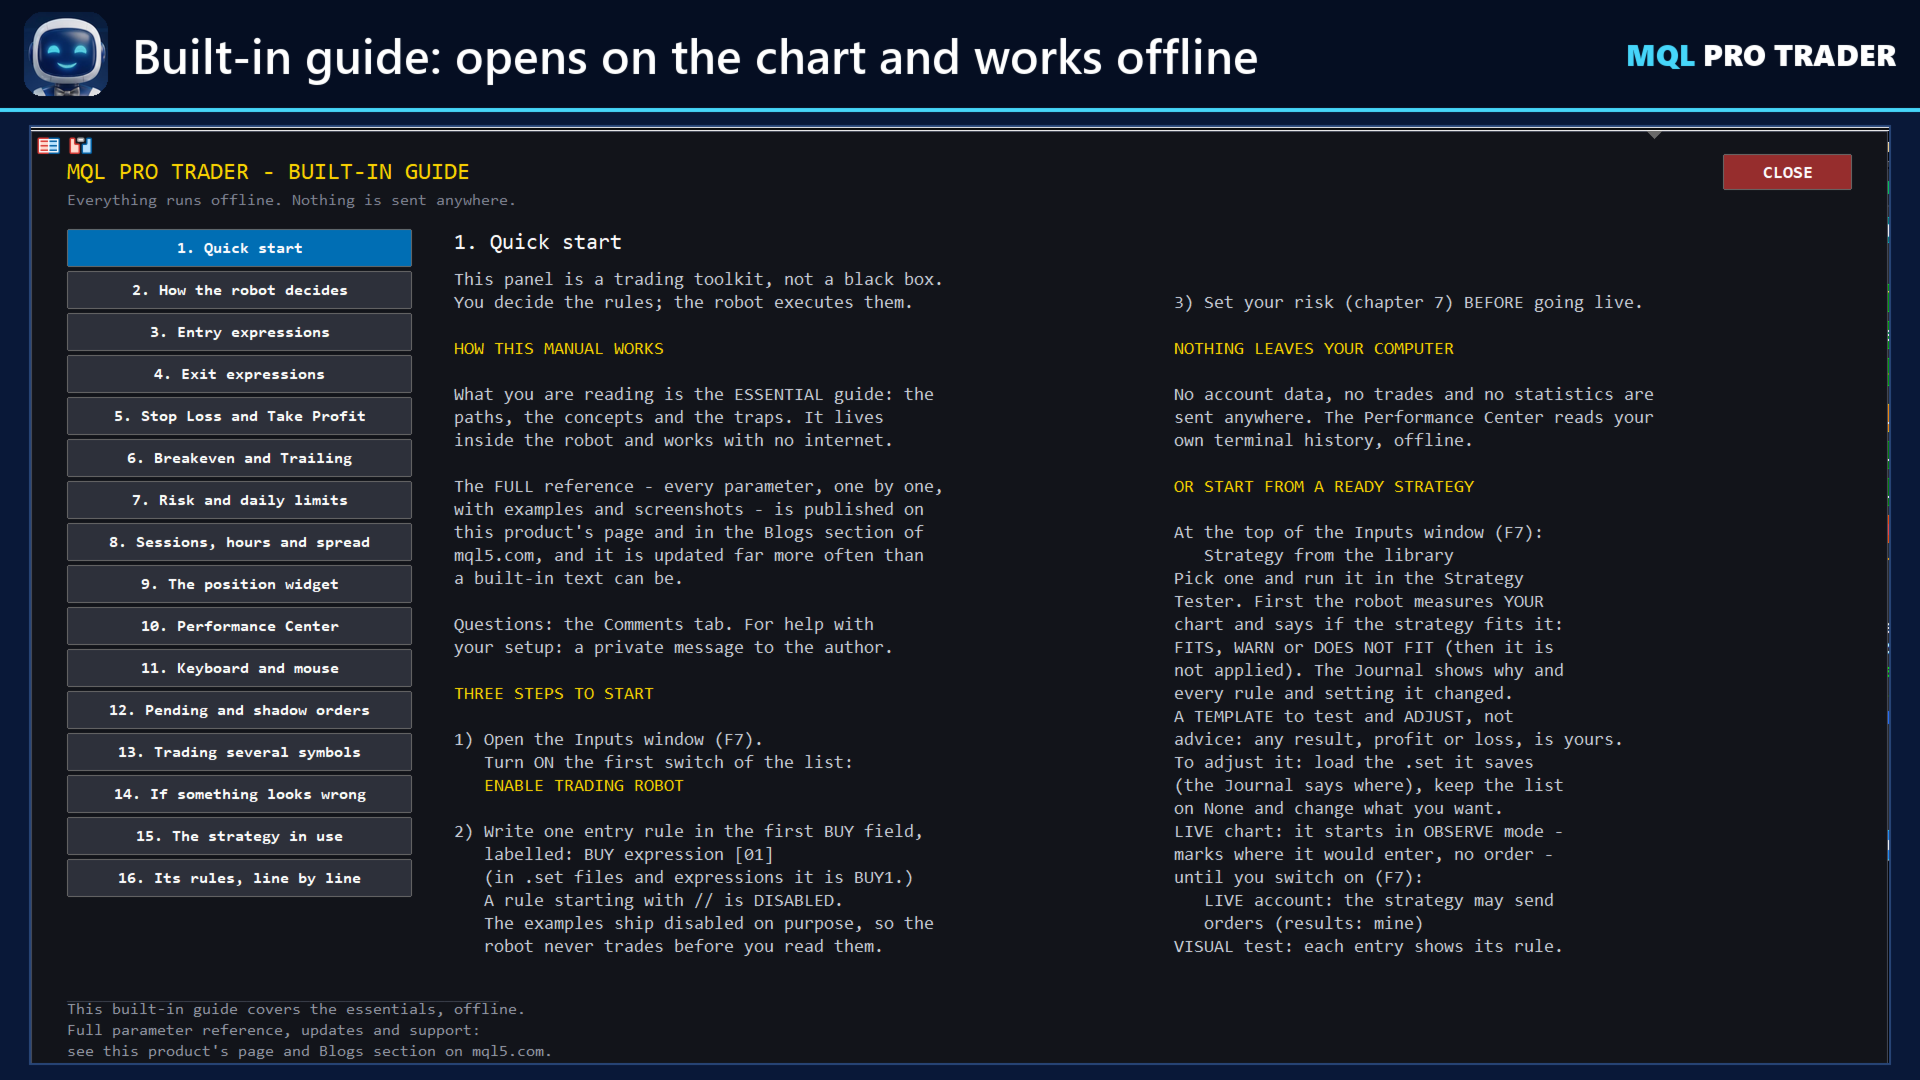
**BUILT-IN GUIDE**
Press the GUIDE tab and the documentation opens on the chart, offline: quick start, how the rules
work, stops and targets, risk, sessions, the position widget, shortcuts, and what to check when
something looks wrong.
**RISK CONTROLS**
Position sizing by fixed lots or by percentage of balance; daily loss and profit limits; drawdown
protection; and a cap on total OPEN risk — because risk per trade sizes each entry as if it were
alone, and several open positions add up. A position without a stop is not counted as zero: its
risk is estimated with the same ruler the stop line uses.
Stops by ATR, by percentage of price or by candle extremes apply to every entry, and on a second or
third symbol they are measured on that symbol. On exchange (netting) accounts, an added order keeps
the stop of the merged position anchored to its average price.
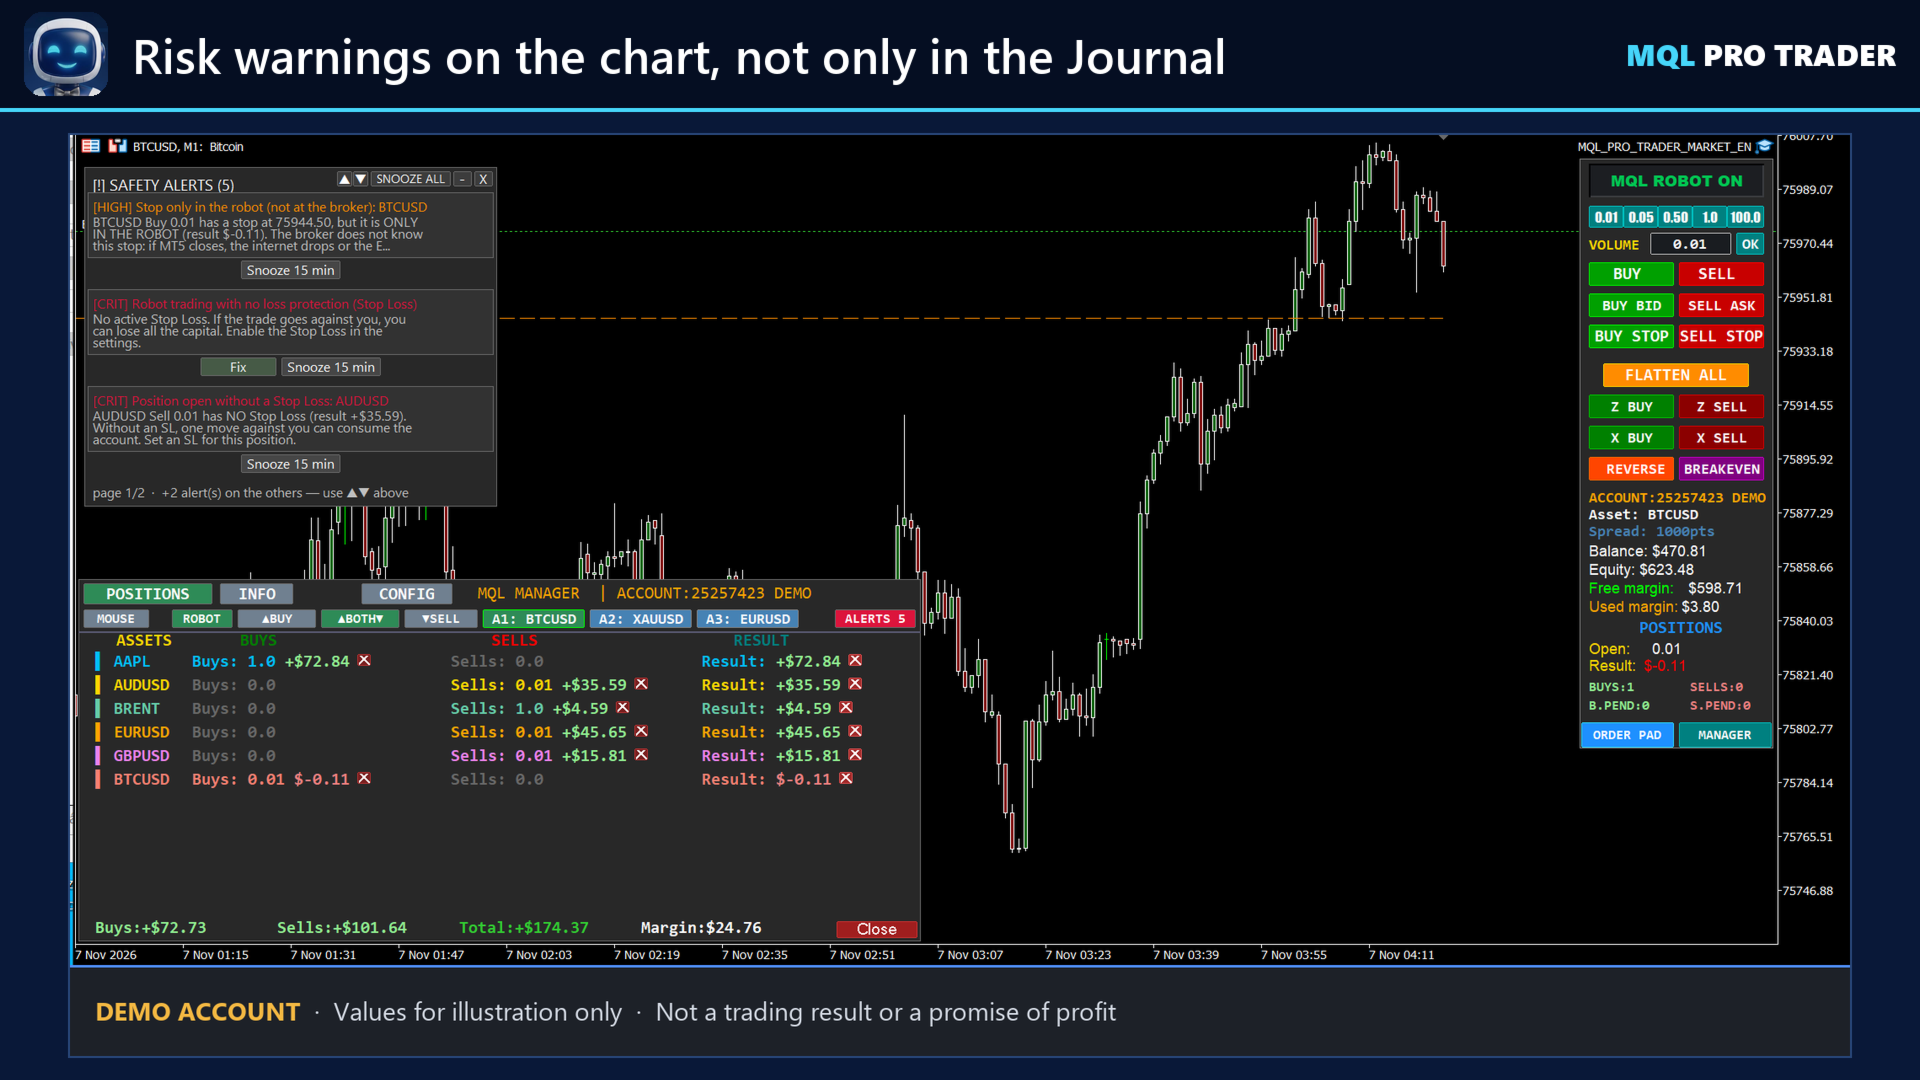
Warnings appear on the chart, not only in the Journal: open exposure approaching the cap, an entry
refused by the cap, the daily loss limit near or reached, a manual button that found nothing to do.
Before an order or a stop change reaches the broker, the tool checks what the broker would refuse:
free margin, the trading session of the symbol, and the broker's minimum stop distance. When one of
them fails, nothing is sent and the reason is written in the Journal, once every few minutes.
**KEYBOARD, WITH A SAFETY RULE**
Every action that opens or closes a position also has a keyboard shortcut, and every one of them
needs two keys: A+C arms a buy stop, Shift+C buys at market, Z+C closes all buys, X+C cancels
pending buys. A lone letter never moves money. Holding a key down does not repeat the order, and a
modifier key that was never released expires by itself after two seconds.
**SESSION AND SPREAD FILTERS**
Trading hours, market sessions, spread ceiling, and the MetaTrader economic calendar. No external
news feed is used.
---
**TRYING THE DEMO IN THE STRATEGY TESTER**
The demo runs in the Strategy Tester, where the panel buttons do not respond — so everything is set
in the Inputs tab. With the default inputs nothing is chosen, so in the Strategy Tester the tool runs
one library strategy as a demonstration: the Journal names it and shows its card. This happens only
in the Strategy Tester — on a live chart, demo or real account, the tool sends no order until you
choose a strategy or write a rule. To try another one, choose it in "Strategy from the library" (the
first field of the Inputs tab) and start the test again. In visual mode, each entry shows on the chart
the rule that fired it. At the end, the Journal explains why each candle did or did not lead to a trade.
**ABOUT THE SCREENSHOTS**
The screenshots were taken on a demo account. The values in them show how the panel displays positions and statistics;
they are not trading results and not a promise of profit.
**REQUIREMENTS**
MetaTrader 5. Works on any symbol and any timeframe. Hedging and netting accounts.
**SUPPORT**
General questions are welcome in the Comments tab of this product page. For help with your own
account, symbol or settings, send a private message to the author (click the author's name on this
page). You can write in English or in your own language.
To get a complete answer in the first reply, include:
1. The line that starts with [SUPPORT]. On a live chart it is in the Experts tab of the Toolbox; in
the Strategy Tester, in the Journal tab. It describes your symbol, account type and settings, and
contains no account number or balance.
2. What you did and what you expected to see, with the time.
3. The lines of the Experts tab from that moment.
4. A screenshot of the chart, if it helps.
For "why didn't it trade?", add the lines that start with [WHY]. Detailed guides are published in
the Blogs section.