
Strategy Ledger
- Утилиты
-
Abdullah Uygar Tuna
 IT-специалист, специализирующийся на алгоритмической торговле, количественном анализе и разработке практичных инструментов для MetaTrader 5.
 - Версия: 8.51
- Обновлено: 24 сентября 2026
Strategy Ledger — панель анализа счёта для MetaTrader 5, работающая только на чтение. Она разделяет результаты счёта по советникам, стратегиям и символам.
Подробное руководство с описанием каждой функции:
https://www.mql5.com/en/blogs/post/774132
MetaTrader показывает один баланс на весь счёт. Когда несколько советников торгуют вместе, этот баланс не показывает вклад каждого. Strategy Ledger читает историю счёта, восстанавливает закрытые позиции, относит их к стратегиям и выводит результаты в одной панели.
Продукт не открывает, не изменяет и не закрывает ордера. Он не содержит торговой стратегии, не создаёт индикаторов и не читает цены графика.
Основные функции
- Результаты по советнику, отдельной стратегии или символу.
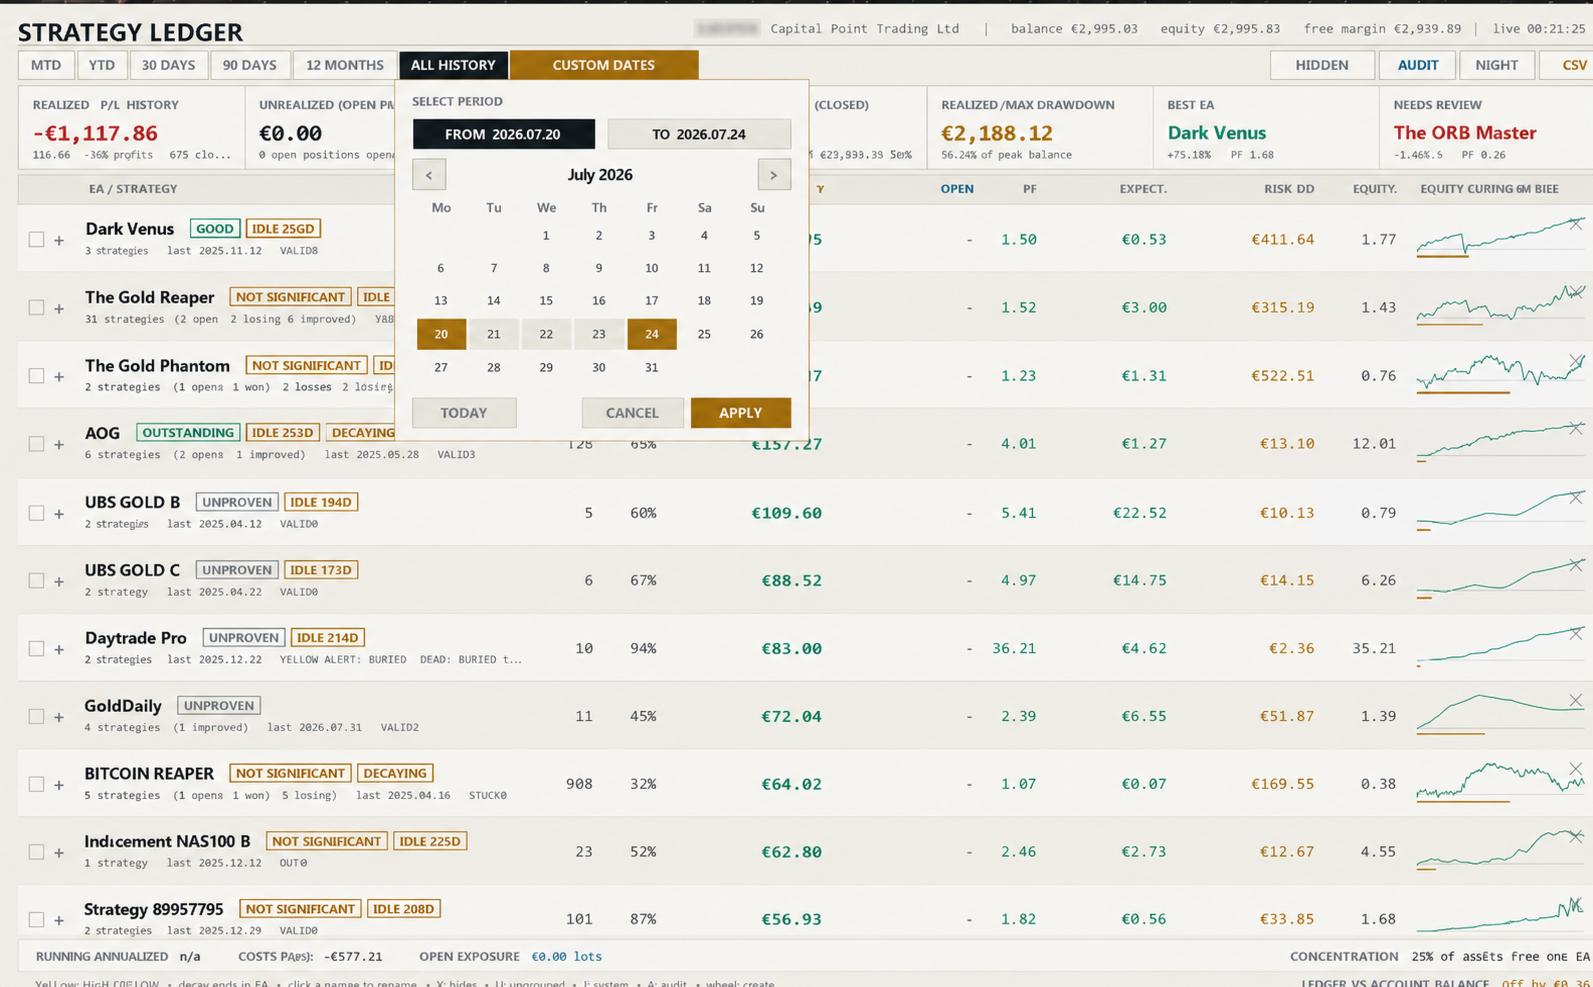
- Готовые периоды от сегодняшнего дня до всей истории и произвольный диапазон дат.
- Реализованные и плавающие результаты, открытая экспозиция, статистика сделок, просадка и кривые эквити.
- Комиссия, своп, доля издержек и оценка проскальзывания на входе и выходе.
- Оценки, письменные выводы и статусные метки по фиксированным правилам.
- Сетапы: позиции, открытые или закрытые вместе, считаются одним решением.
- Отслеживание просадки эквити в реальном времени для счёта и каждой строки.
- Интерактивное именование, группировка, перемещение, скрытие, восстановление, раскрытие и сортировка.
- Подробные экспорты показателей и аудита в формате CSV.
Если у вас больше, чем несколько стратегий
Всё перечисленное выше — бесплатная версия, и она такой и останется: она продолжает получать исправления и работу над точностью. Strategy Ledger Pro добавляет инструменты, которые начинают иметь значение, когда строк на счёте больше, чем помещается на экране:
- Корреляция — какие советники, стратегии или символы движутся вместе в одни и те же дни, чтобы шесть «здоровых» строк не оказались одной ставкой под шестью именами.
- История оценок — оценка каждой строки по месяцам, восстановленная из вашей собственной истории сделок.
- Идентичность — решайте, какие магические номера считать одной стратегией, возвращайте любой комментарий в отдельную строку и смотрите объёмы каждого магика с результатом по каждому объёму.
- Сессии и почасовая тепловая карта — фильтруйте панель по Азии, Лондону или Нью-Йорку и смотрите, в какие часы каждая стратегия действительно зарабатывает.
- Лимиты проп-фирм — дневной убыток, максимальная просадка и цель по прибыли с остатком до каждого лимита.
- Отчёт об исполнении — как брокер исполняет ваши ордера: стоимость проскальзывания, бывает ли исполнение в вашу пользу так же часто, как против вас, скорость исполнения, комиссия на лот и своп на лот-день.
- Режим Magic, пункты, режим фиксированного лота, компактный вид, встроенное руководство и снимки одним кликом.
Как строятся данные счёта
Strategy Ledger считает завершённые позиции, а не отдельные сделки. MetaTrader может открыть или закрыть одну позицию несколькими сделками. Панель группирует их по идентификатору позиции и записывает один трейд, когда объём закрытия совпадает с объёмом открытия. Частичные закрытия остаются частью той же позиции.
Прибыль, комиссия, сборы и своп входят в каждый результат. Депозиты, снятия, кредиты, корректировки, бонусы, платежи, проценты, дивиденды и налоги учитываются в сверке счёта там, где брокер отражает их в истории.
Стратегия обычно определяется магическим номером и очищенным комментарием открывающей сделки. Это поддерживает советников, использующих один магический номер для нескольких внутренних стратегий. Сделки, скопированные с сигнала MQL5, держатся вместе как одна стратегия. Ручные и мобильные сделки с магическим номером ноль также могут быть включены.
Не каждая позиция — отдельное решение. Советник, открывающий четыре позиции по одному сигналу, или сетка, закрывающая корзину разом, приняли одно решение, и счёт их как четырёх или сорока завышает уверенность в цифрах. Поэтому позиции одного магического номера и символа, открытые в течение короткого окна или закрытые вместе как лестница, считаются одним сетапом. Деньги всегда считают позиции; статистическая значимость, минимальная выборка и оценка используют сетапы.
Нижняя строка сравнивает восстановленный реализованный результат и балансовые операции с балансом и кредитом, которые сообщает MetaTrader. Любое расхождение отображается. Сделки разворота при неттинге могут сделать границы трейдов неопределёнными, поэтому такие строки помечаются Unverified и не оцениваются.
Режимы, периоды и организация
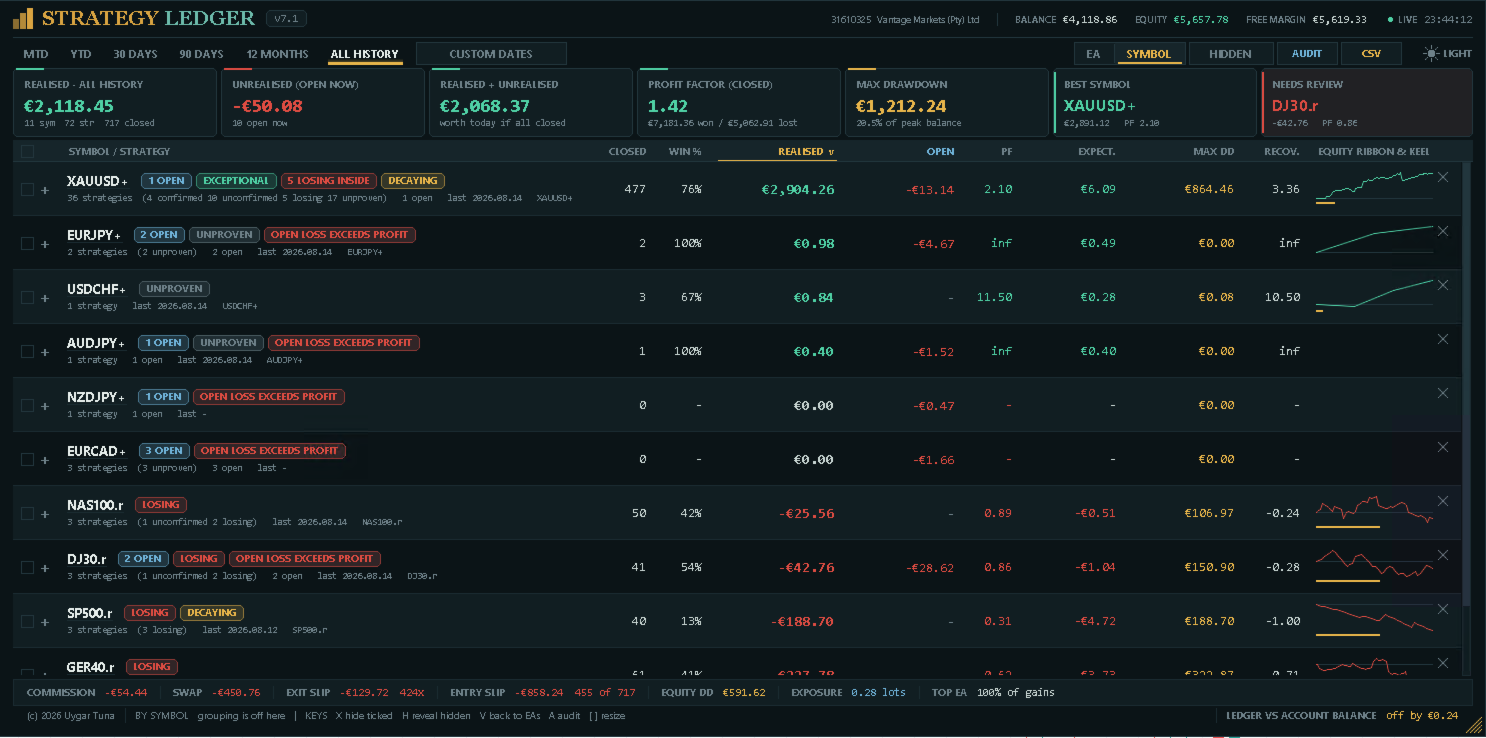
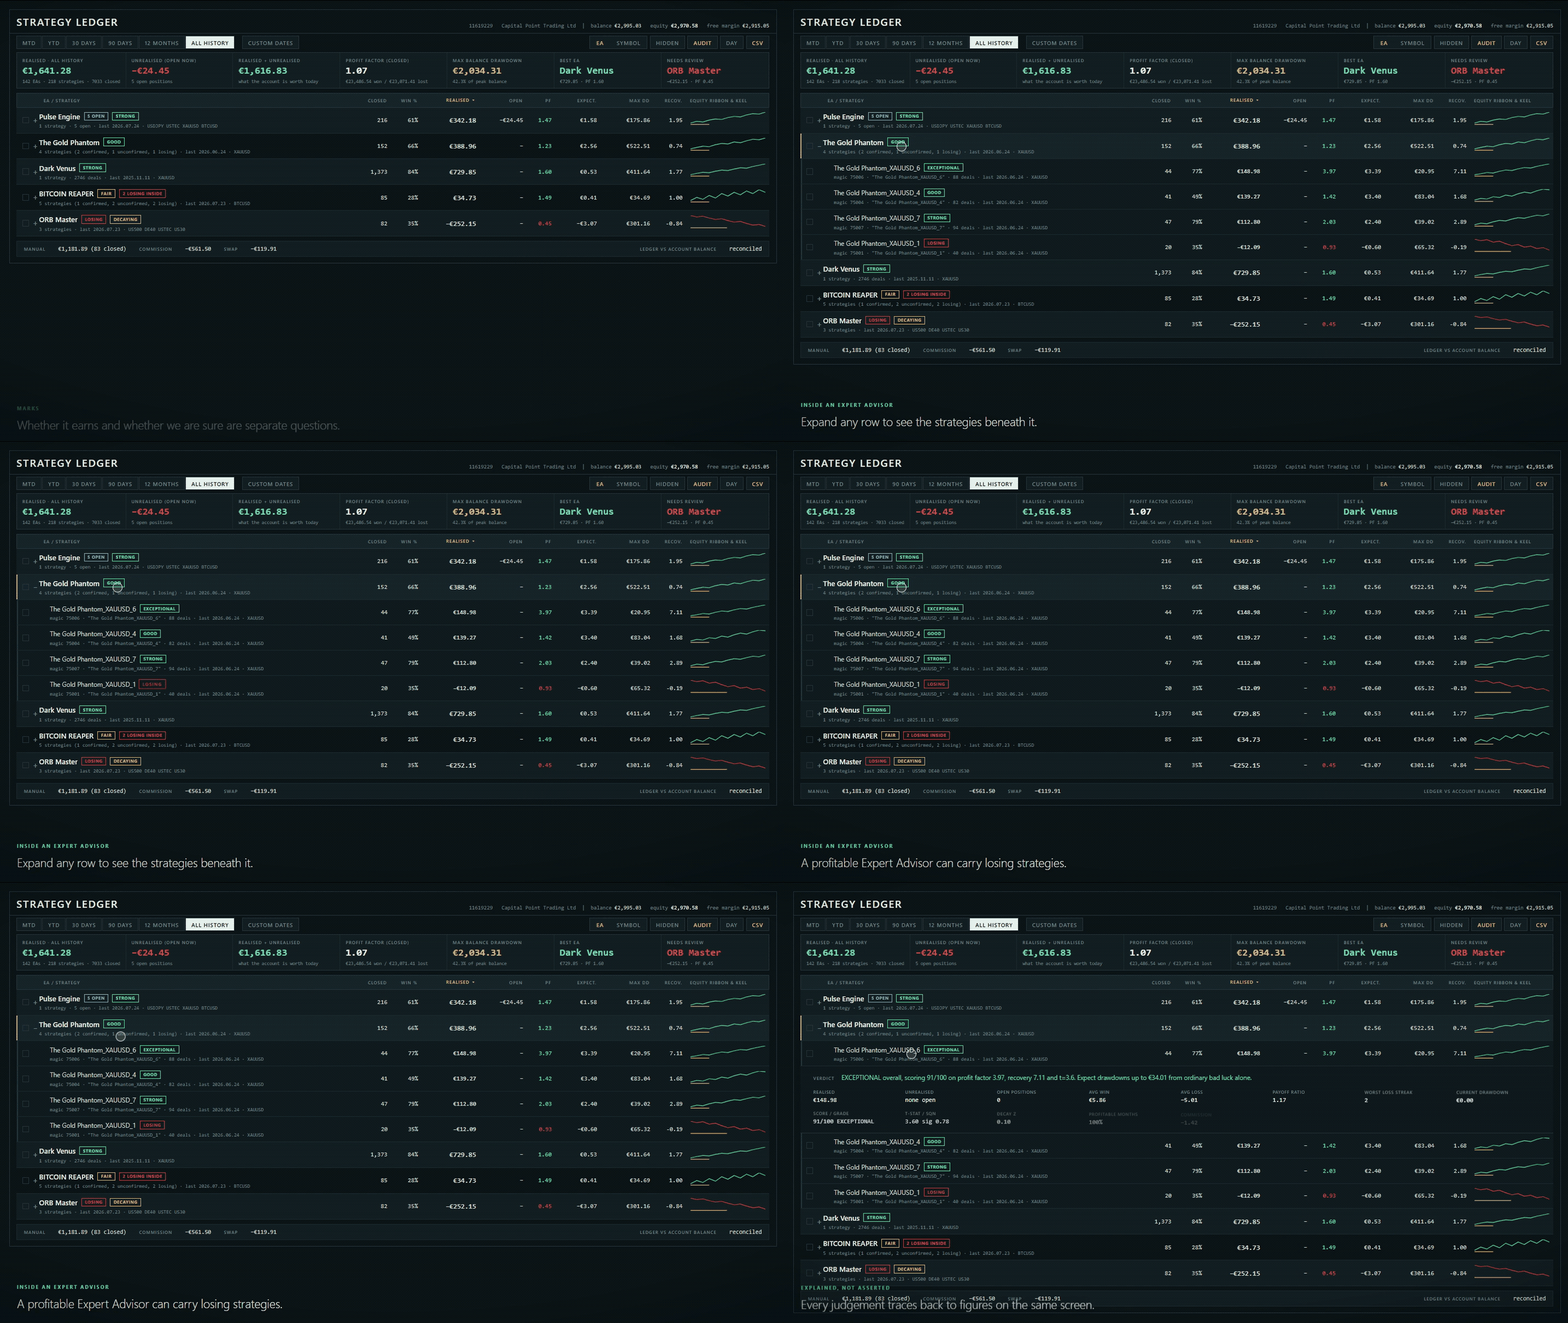
Режим советников группирует стратегии под назначенным советником. Режим символов группирует те же данные по инструменту. Несколько строк советников могут оставаться раскрытыми одновременно.
Доступные периоды: сегодня, месяц, год, 7 дней, 30 дней, 90 дней, 12 месяцев, вся история и произвольный диапазон дат. Позиция относится к периоду по времени закрытия или открытия.
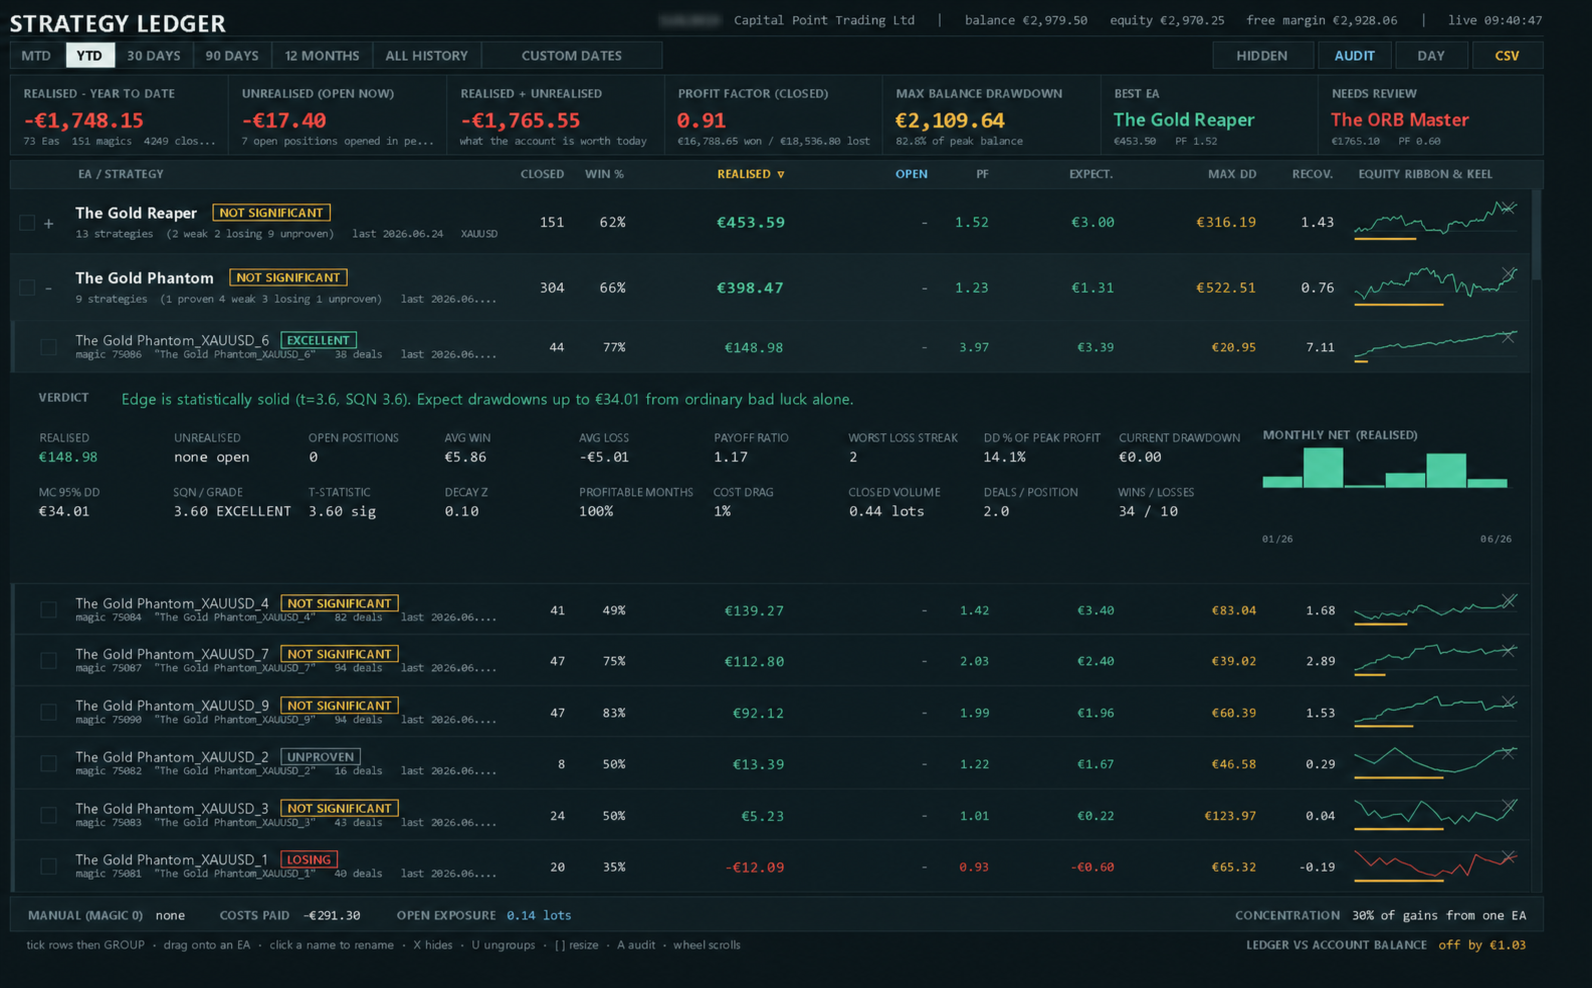
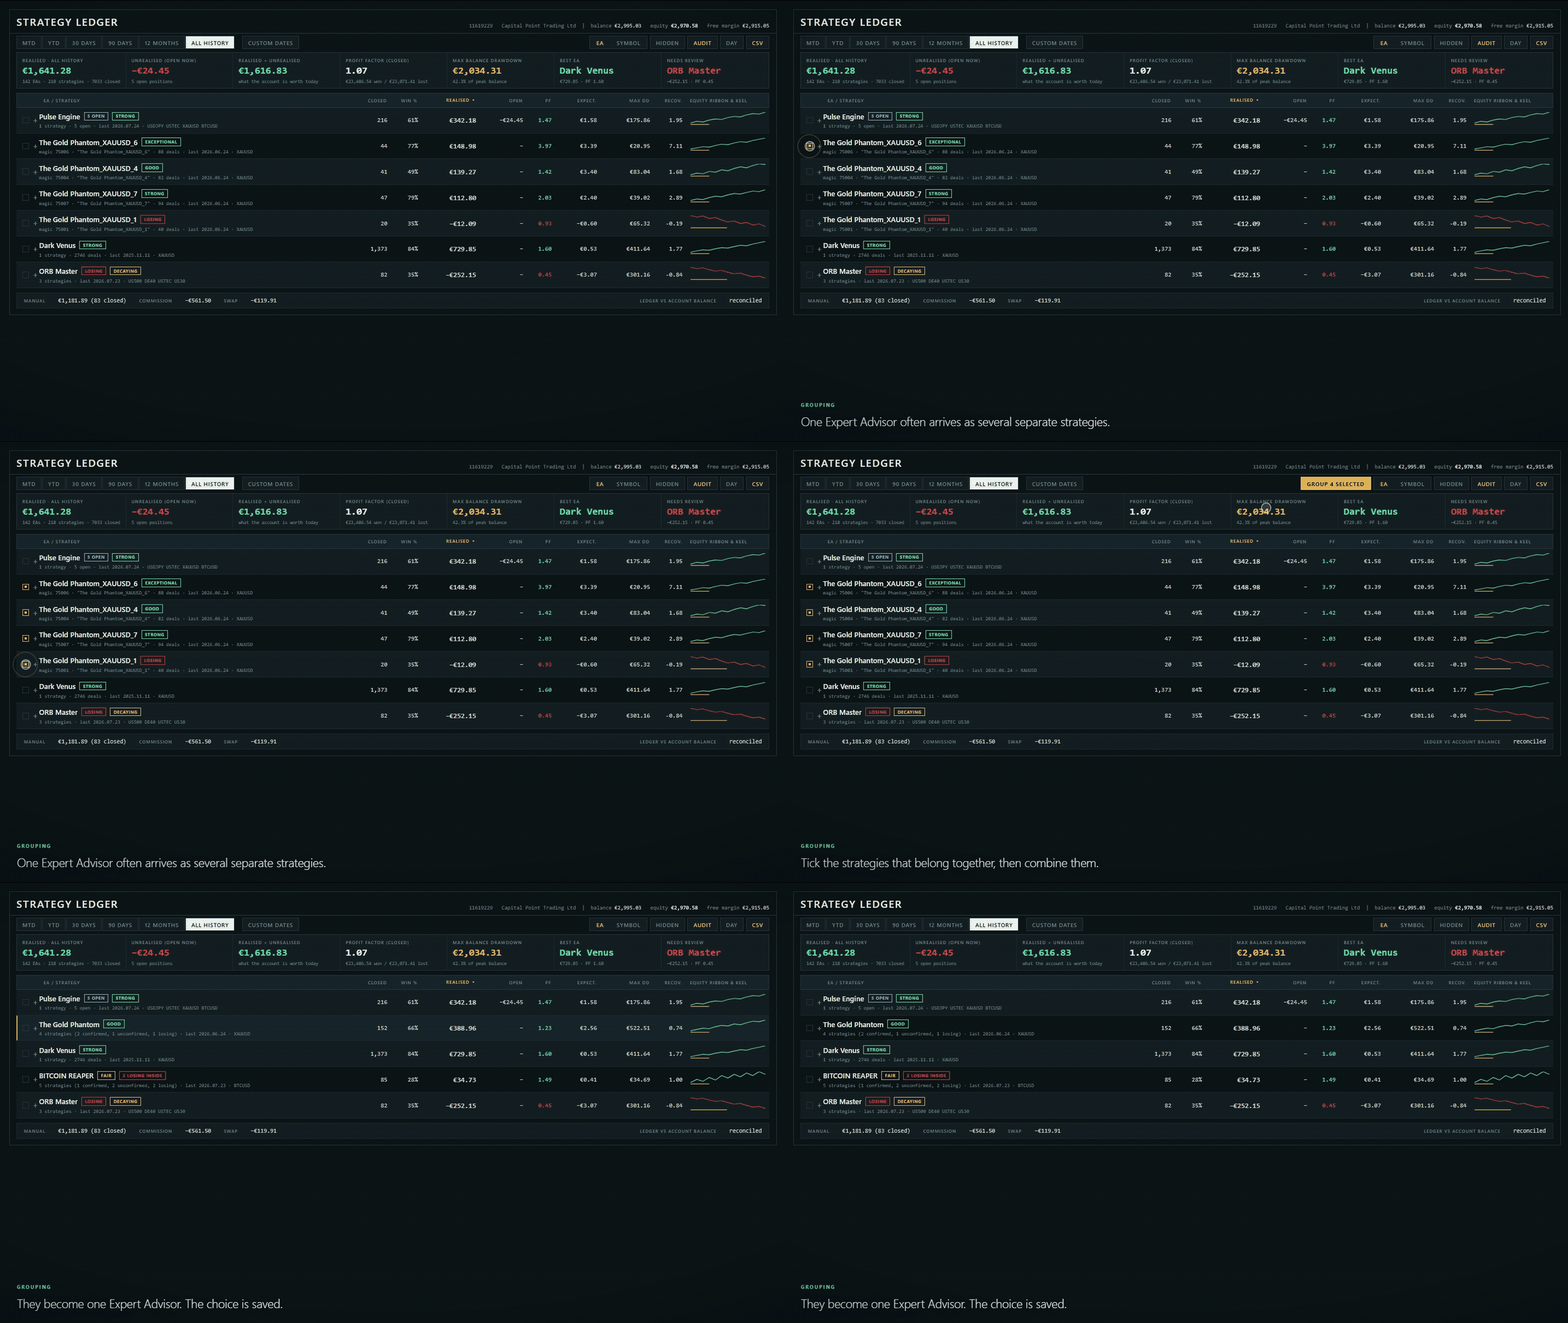
Имена берутся из комментариев сделок или задаются вручную. Стратегии можно переименовывать, группировать из выделения, перетаскивать к другому советнику, объединять или разделять. Одинаковые комментарии можно объединять между магическими номерами, со списком исключений. Когда строки сгруппированы вручную, все участвующие строки закрепляются за этой группой, поэтому группировка переживает последующие улучшения правила автоматического именования.
Строки можно скрывать по одной или выделением и восстанавливать позже. Скрытые строки хранятся отдельно для режимов советников и символов. Они исключены из видимых итогов и из отфильтрованной кривой баланса. Колонки сортируются по имени, результату, профит-фактору, закрытым позициям, просадке или матожиданию.
Панель и детали стратегии
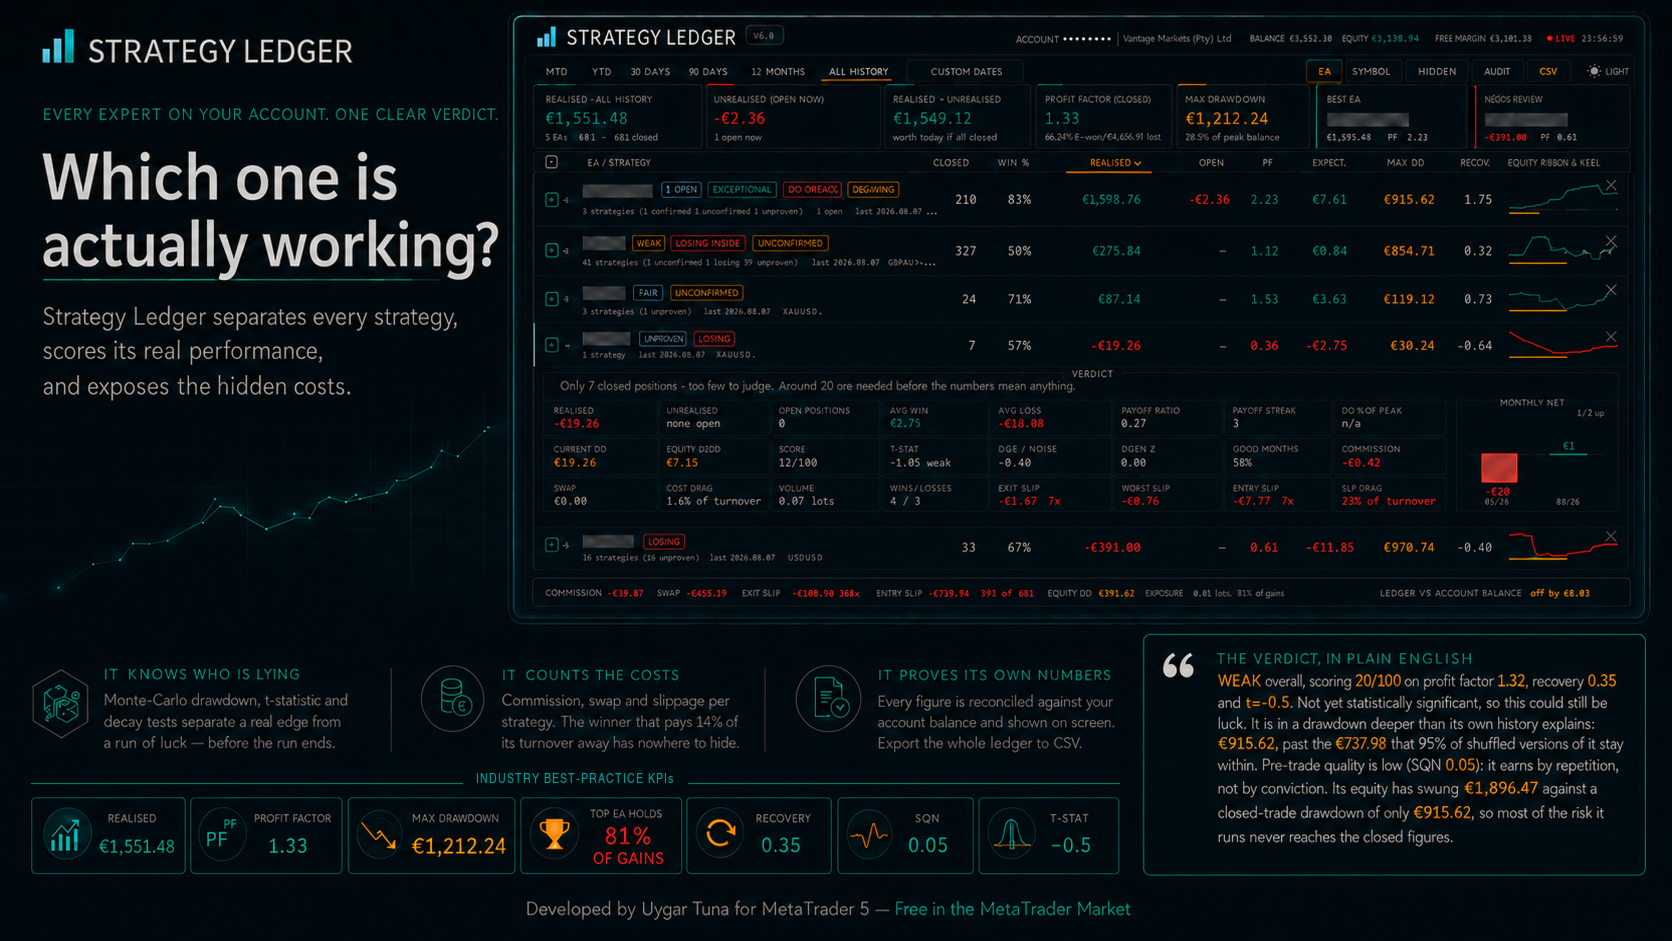
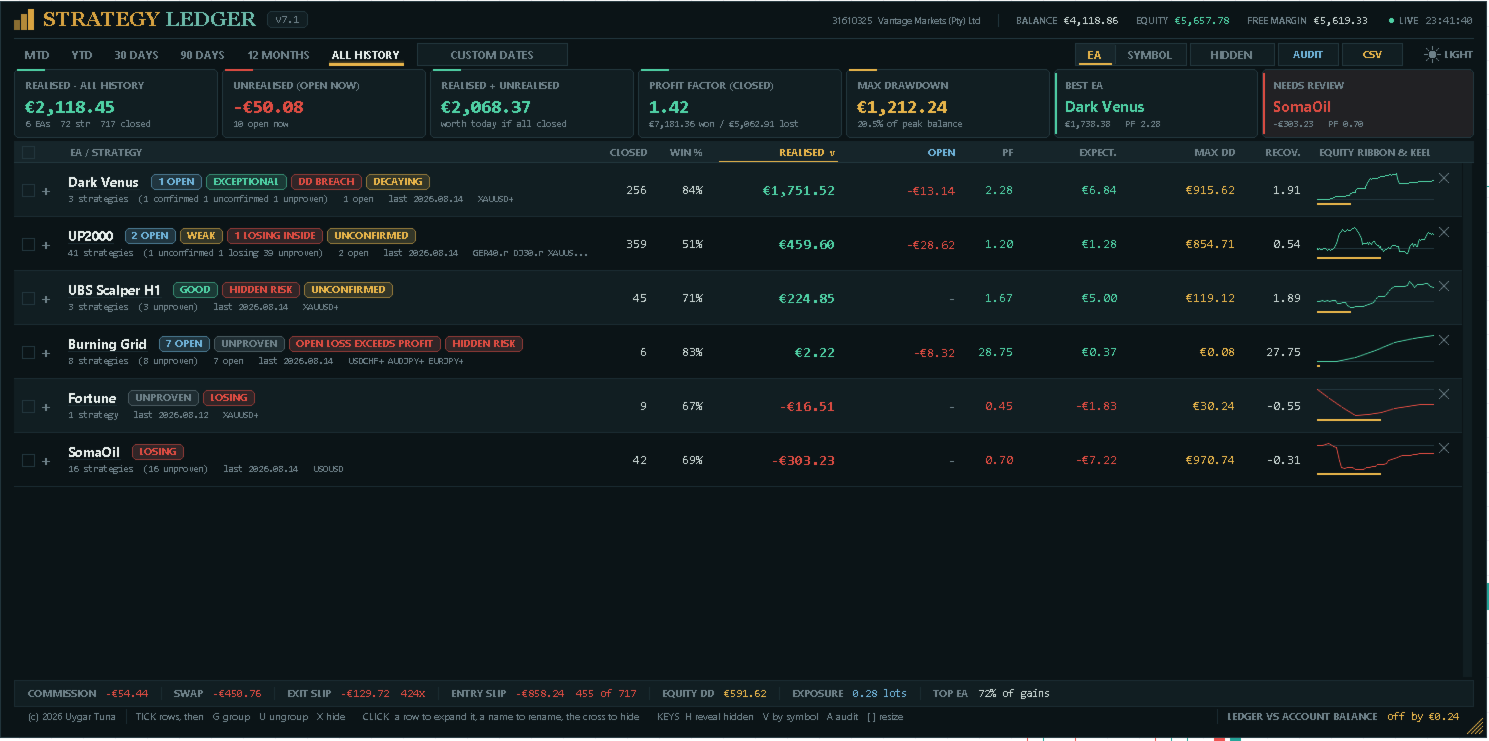
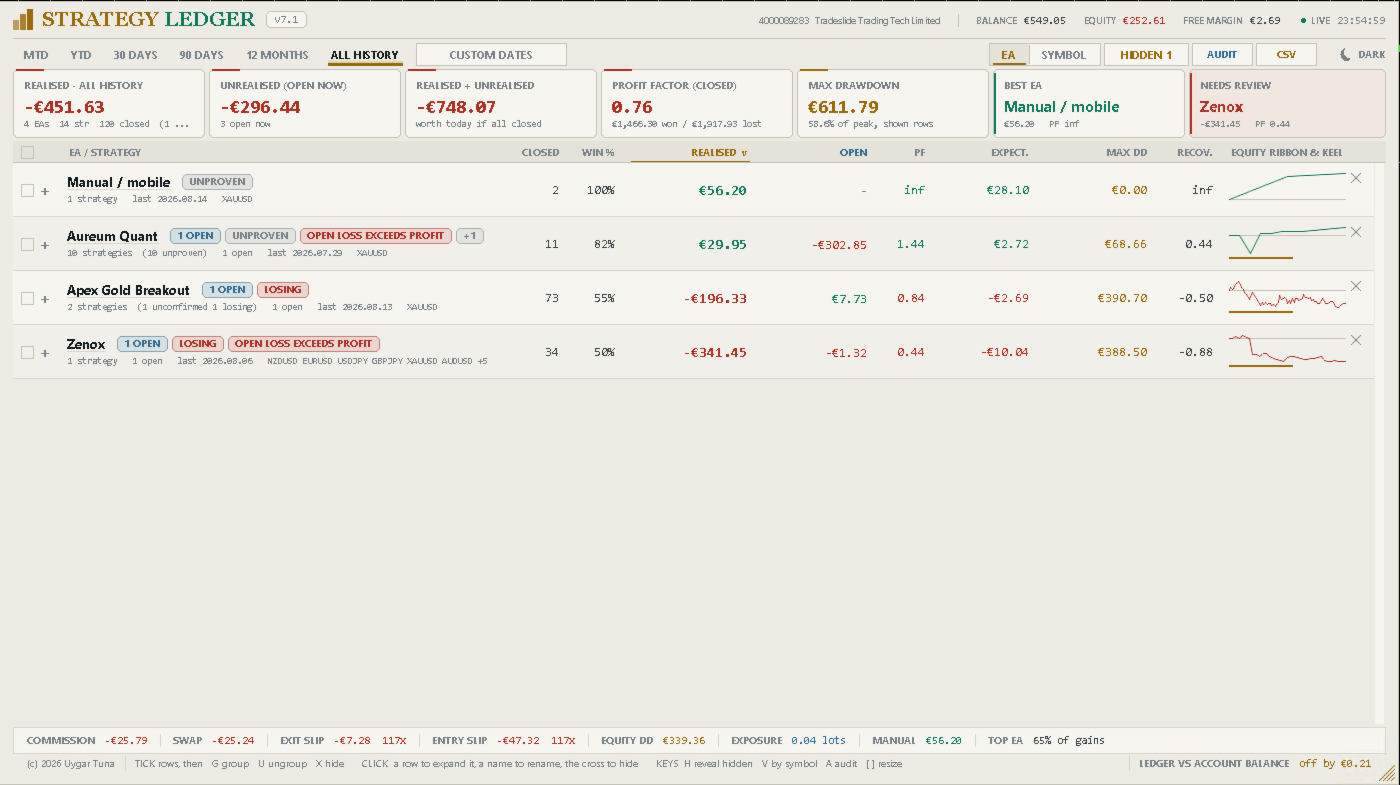
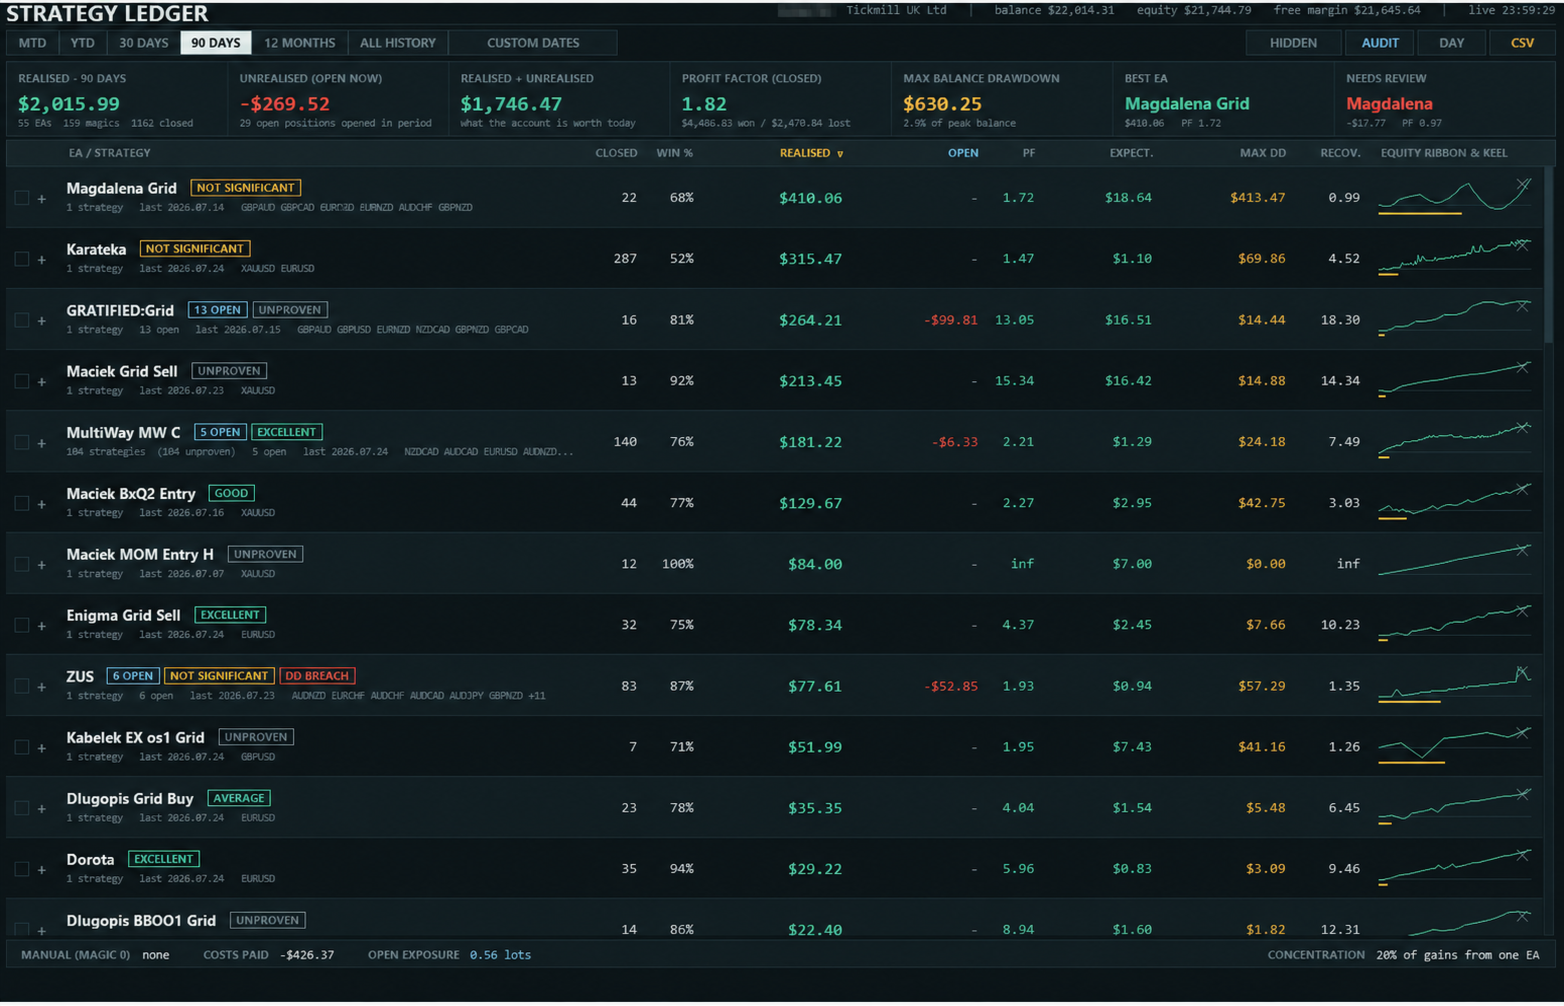
Заголовок показывает счёт, брокера, баланс, эквити, свободную маржу, серверное время и состояние потока данных. Сводка показывает реализованный результат, текущий плавающий результат, их сумму, профит-фактор закрытых позиций, максимальную просадку баланса, сильнейшую строку по текущей стоимости и строку, выбранную правилами панели для проверки.
Таблица показывает закрытые позиции, долю выигрышей, реализованный результат, плавающий результат, профит-фактор, матожидание, максимальную просадку закрытых позиций, фактор восстановления и компактную кривую эквити с путём просадки. При скрытых строках эти цифры описывают отображаемую выборку.
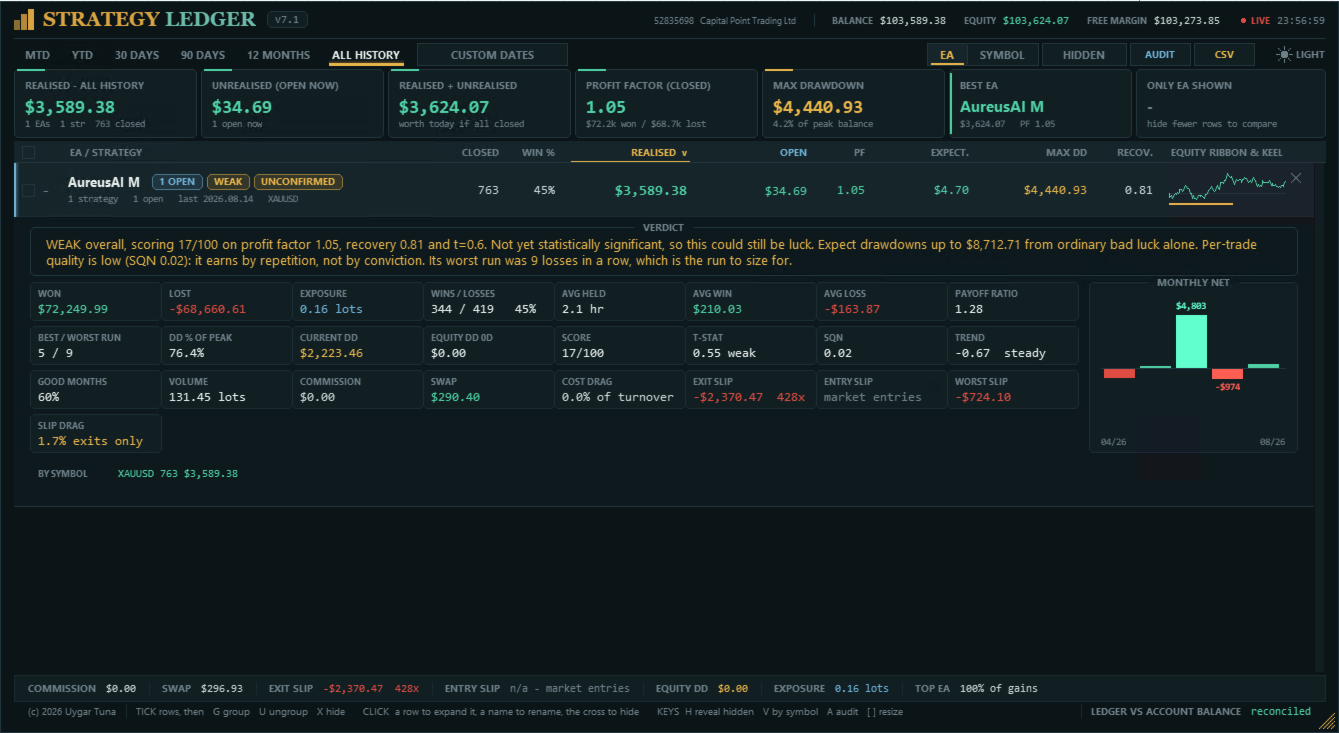
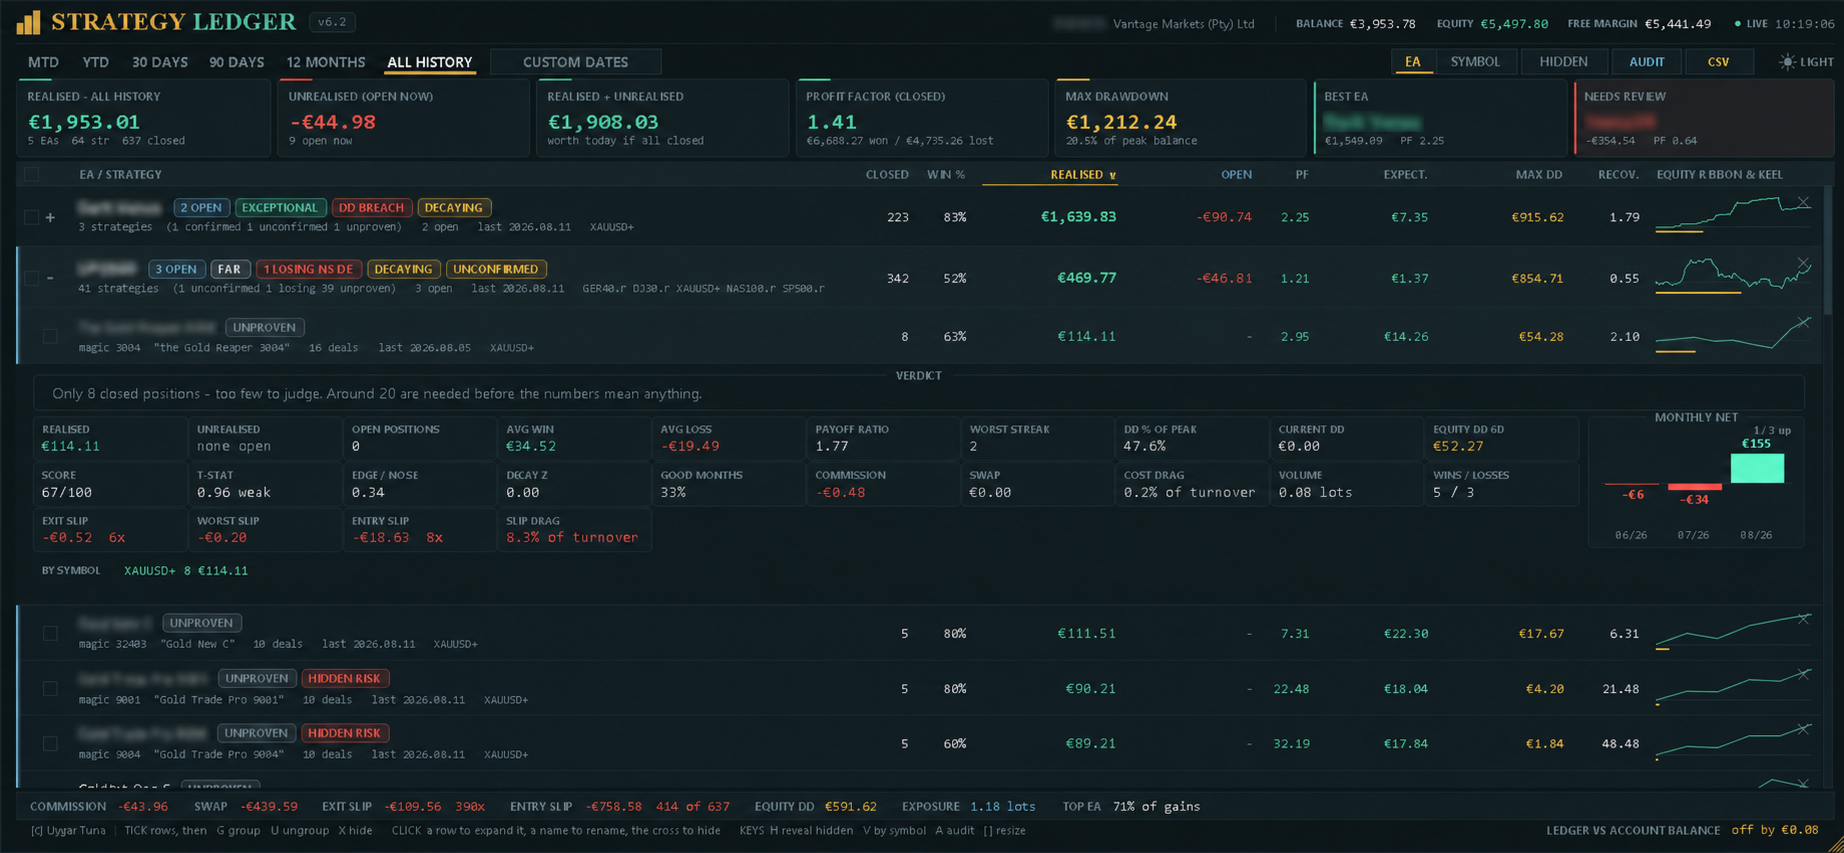
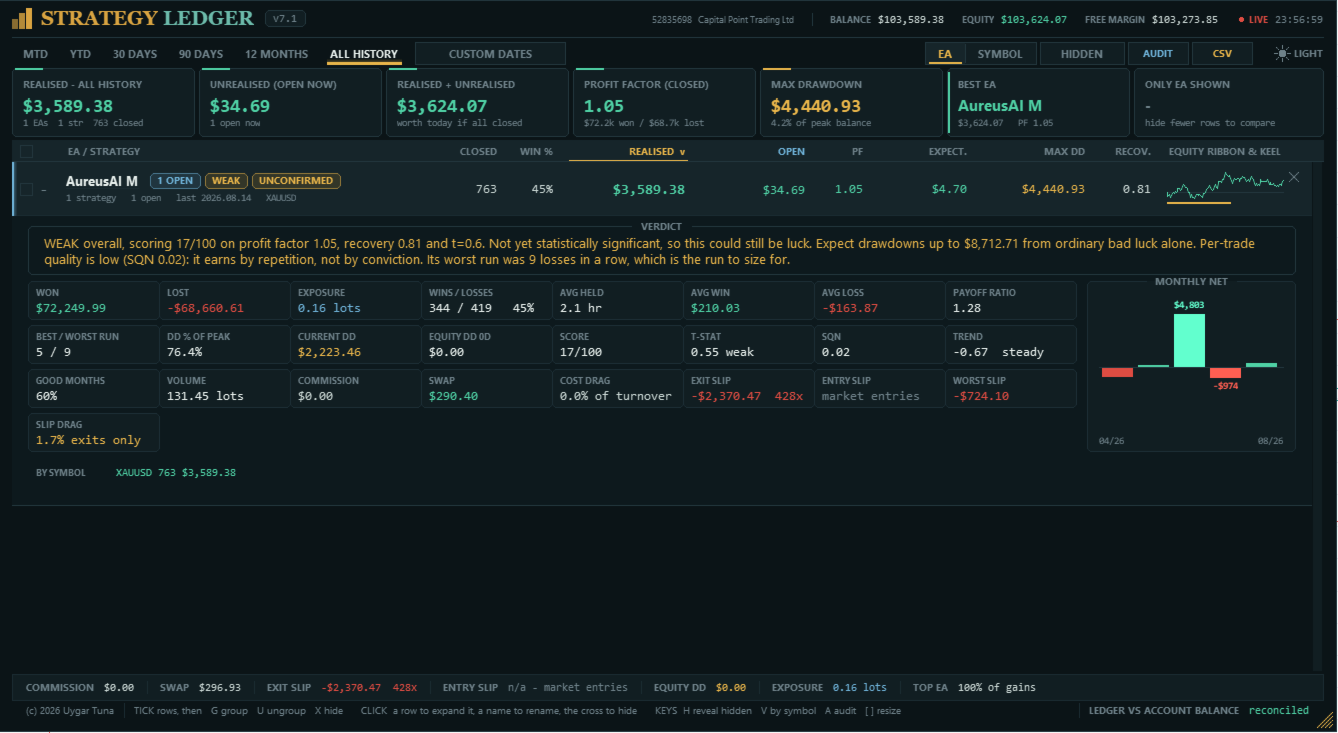
Раскрытая деталь содержит общий выигрыш и проигрыш, открытую экспозицию, выигрыши и проигрыши, сетапы, среднее время удержания, средний выигрыш и проигрыш, соотношение выплат, лучшие и худшие серии, процент просадки, текущую просадку, объём и долю прибыльных месяцев.
Также показываются балл, статистическая значимость, System Quality Number, тренд последних результатов, оценка просадки по Монте-Карло, просадка эквити в реальном времени, комиссия, своп, доля издержек, проскальзывание на входе и выходе, худшее измеренное проскальзывание и его доля. Включены месячный график чистого результата и разбивка по символам.
Оценки и метки риска
Балл объединяет статистическую значимость, профит-фактор и фактор восстановления. Каждая составляющая ограничивается перед усреднением. Плавающий убыток может ограничить балл, потому что статистика закрытых позиций не включает этот открытый убыток.
Минимальная выборка по умолчанию — 20 сетапов. Строки ниже неё помечаются Unproven. Остальные оценки — от Losing до Exceptional согласно баллу и настроенному порогу убыточности. Оценки описывают записанные данные счёта; это не торговые сигналы и не прогнозы.
Статусные метки обозначают открытые позиции, отсутствие закрытых сделок, бездействие, убыточный результат, открытый убыток, открытый убыток больше учтённой прибыли, ослабление последних результатов, недостаточное статистическое подтверждение, просадку выше оценки по перемешанной истории, убыточные стратегии внутри прибыльного советника и просадку эквити существенно выше просадки закрытых позиций. Раскрытие строки показывает применимые метки и письменное объяснение.
Просадка, издержки и проскальзывание
Просадка по закрытым позициям не показывает полного движения позиций, пока они открыты. Strategy Ledger может замерять эквити раз в секунду и сохранять наибольшее наблюдаемое падение от предыдущего максимума для счёта, каждого советника и каждой стратегии. Отслеживание начинается при первом включении; дата начала отображается. Запись следует за жизнью строки, а не за вкладкой периода или состоянием скрытия: изменение того, что на экране, не записывает просадку.
Когда отслеживание выключено, панель деталей может показать оценку просадки 95-го процентиля, полученную перемешиванием закрытых результатов. Эта оценка и все оценки описывают только исторические данные.
Комиссия и своп показываются раздельно, и каждый включает сумму, уже начисленную по открытым позициям. Доля издержек показывается в процентах от валового оборота, когда есть нужные данные.
Проскальзывание на выходе оценивается там, где ордер выхода содержит запрошенную цену, включая стоп-лосс, тейк-профит и выходы по отложенным ордерам. Проскальзывание на входе оценивается для отложенных ордеров с запрошенной ценой входа. У рыночных ордеров нет цены для сравнения, поэтому панель сообщает «недоступно» или частичное покрытие. Значения переводятся в валюту счёта по текущей стоимости тика и сопровождаются числом измеренных событий.
Экспорты
Экспорт показателей записывает отображаемые группы и стратегии, включая результаты, статистику, издержки, проскальзывание, оценки и письменные выводы. Автоматический экспорт может выполняться после каждого обновления.
Экспорт аудита перечисляет восстановленные закрытые позиции, открытые позиции, статус периода и скрытия и независимые проверки позиций против сделок. Он предназначен для расследования недостающей истории или расхождений в расчётах.
Оформление и сохранённые настройки
Панель поддерживает тёмную и светлую темы, прокрутку колесом мыши, произвольную ширину и высоту таблицы, автоматическую подгонку к графику, масштабирование экрана, ручное масштабирование текста и необязательные живые часы. Колонки убираются постепенно, когда панель становится слишком узкой, а изменение размера за уголок проходит плавно при любом размере.
Имена, группы, скрытые строки, раскрытые строки, сортировка, период, режим, тема и размер панели могут запоминаться. Состояние и история эквити хранятся отдельно для каждого счёта и сервера. Старые файлы имён и раскладки копируются при наличии. Старая история эквити принимается только при включённой соответствующей настройке.
Входные параметры управляют именованием и группировкой, ручными сделками, окном сетапа, основой периода, начальным периодом, сортировкой, темой, положением и размером панели, подгонкой к графику, живыми часами, сохранённой раскладкой, статистическими выводами, минимальной выборкой, числом прогонов Монте-Карло, отслеживанием эквити, порогами статусов, автоэкспортом, размером текста, диагностическим журналом и необязательным принятием старой истории эквити.
Установка и ограничения
- Во вкладке «История» MetaTrader выберите «Вся история».
- Прикрепите Strategy Ledger к отдельному графику. Символ и таймфрейм любые.
- После первого сканирования проверьте строку сверки.
Полные результаты требуют полной истории счёта. Отсутствующие записи брокера, необычные структуры сделок и развороты при неттинге могут вызывать расхождения или непроверенные строки.
Значения проскальзывания — оценки. Пересчёт использует текущую стоимость тика символа, а не его стоимость на момент исполнения. Проскальзывание нельзя измерить, если ордер не указал запрошенную цену.
Если советник пишет разный комментарий в каждой сделке, комментарии могут создавать отдельные строки стратегий. Типичные номера и ссылки на ордера удаляются автоматически, а оставшиеся строки можно сгруппировать вручную. Strategy Ledger Pro дополнительно позволяет объявить весь магический номер одной стратегией.
Вопросы и сообщения о проблемах можно отправлять через комментарии к продукту или личные сообщения MQL5. При сообщении о расхождении в расчётах приложите экспорт аудита.















































Great professional tool and great developer! Gonna buy the pro version for sure