Envelopes targets

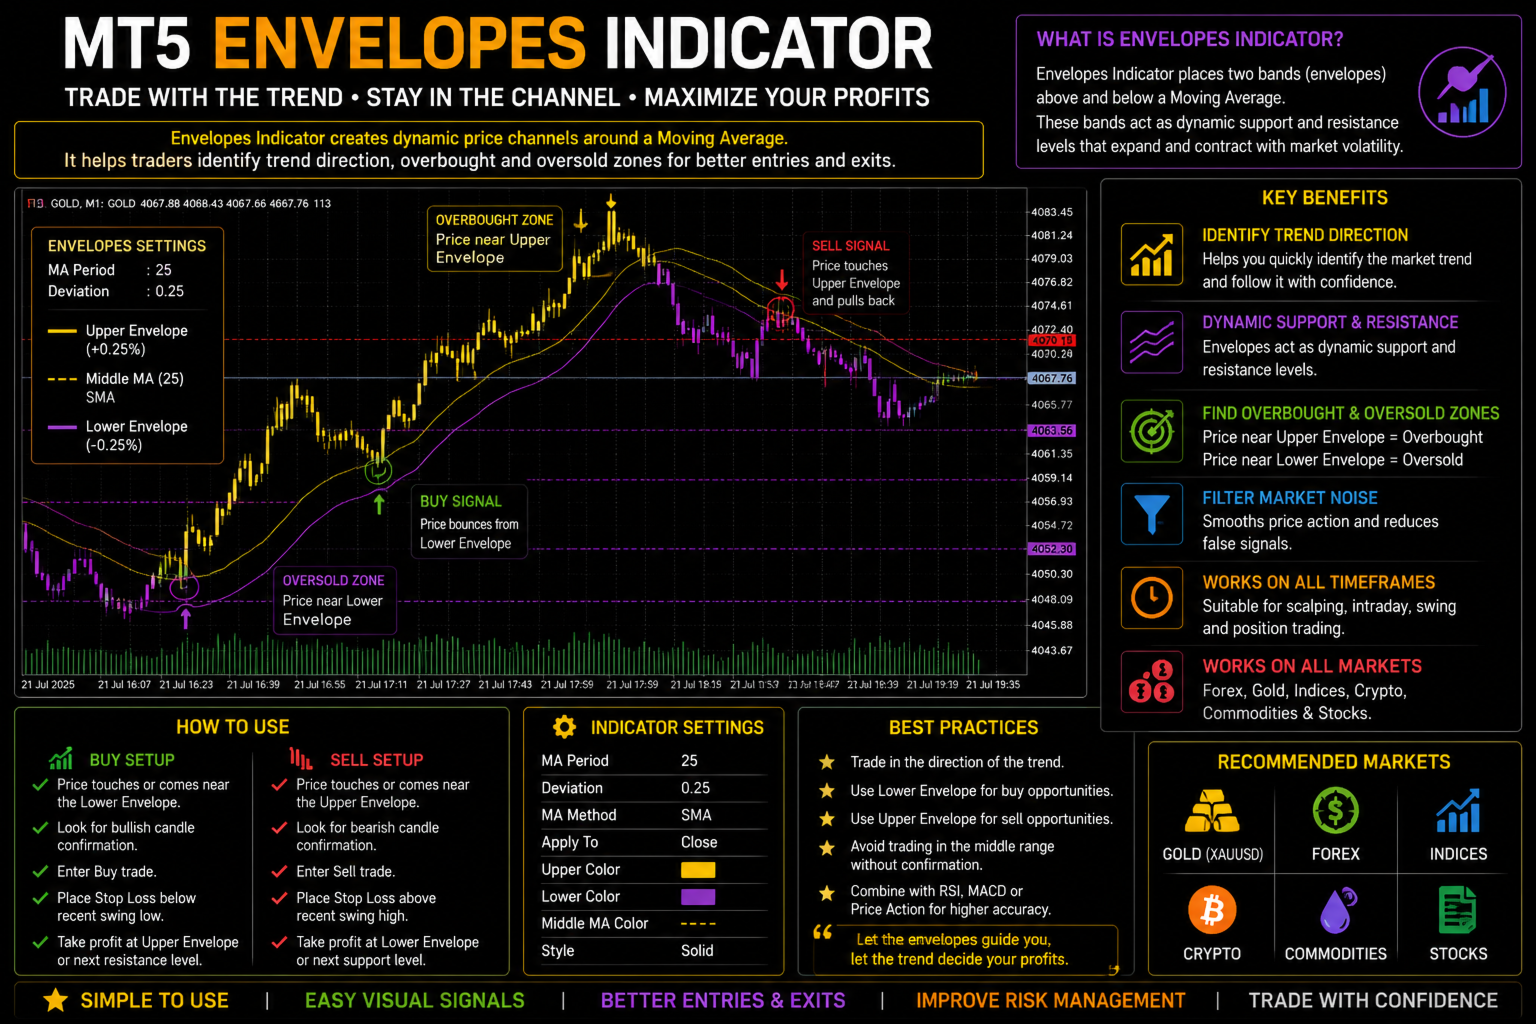
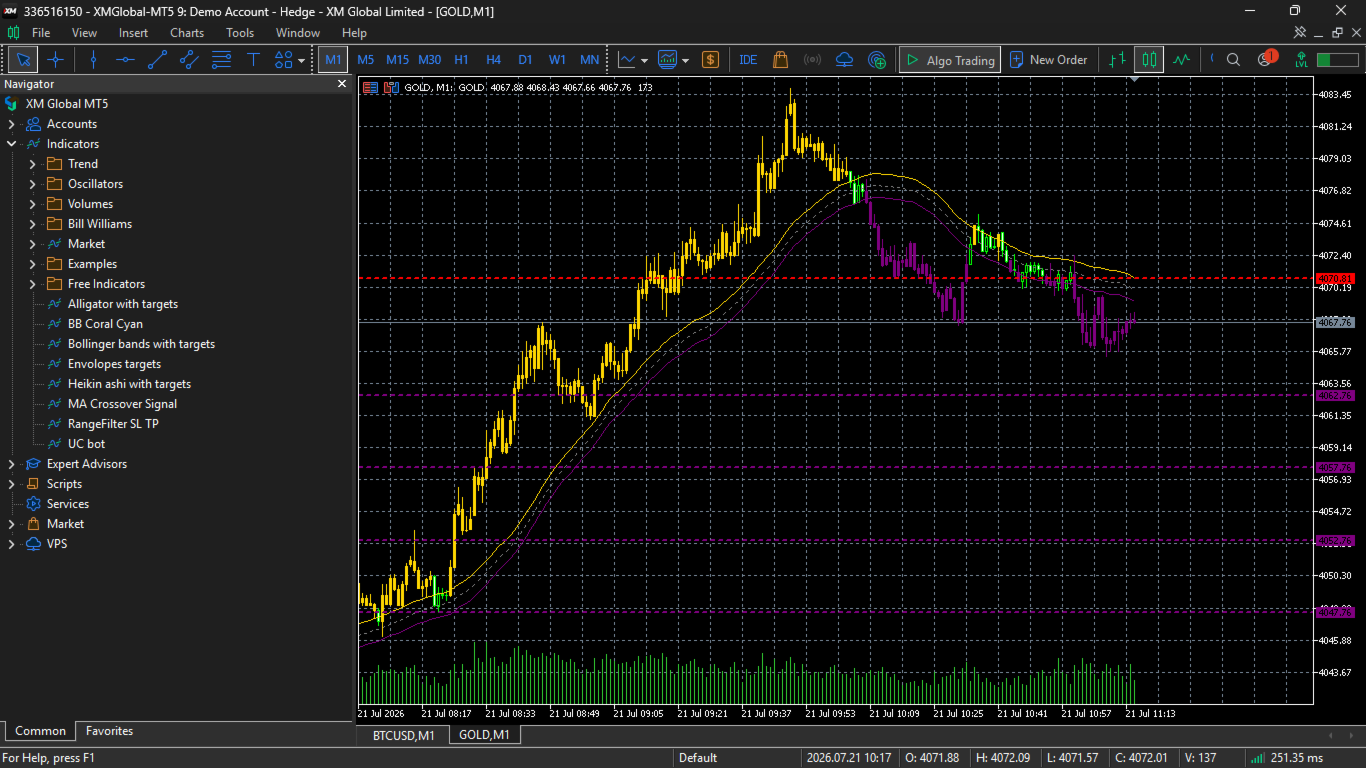
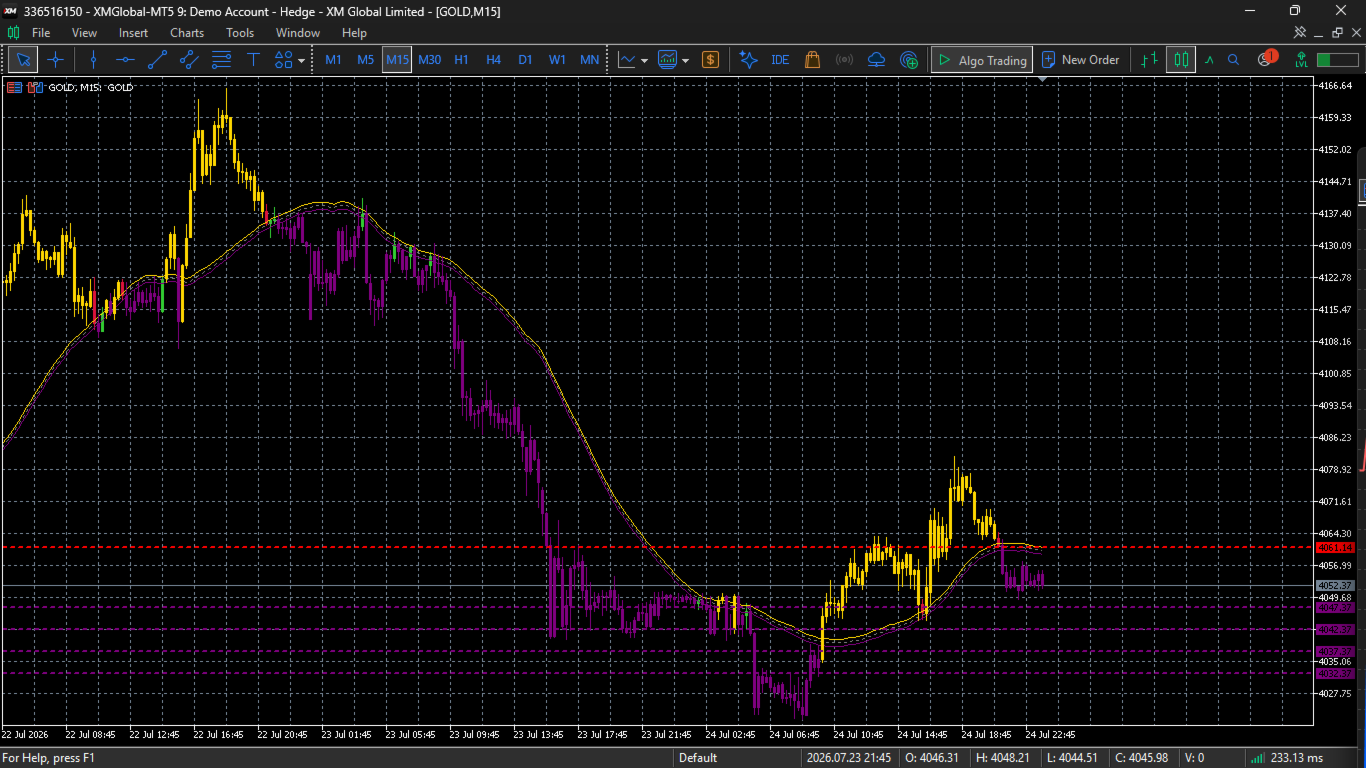
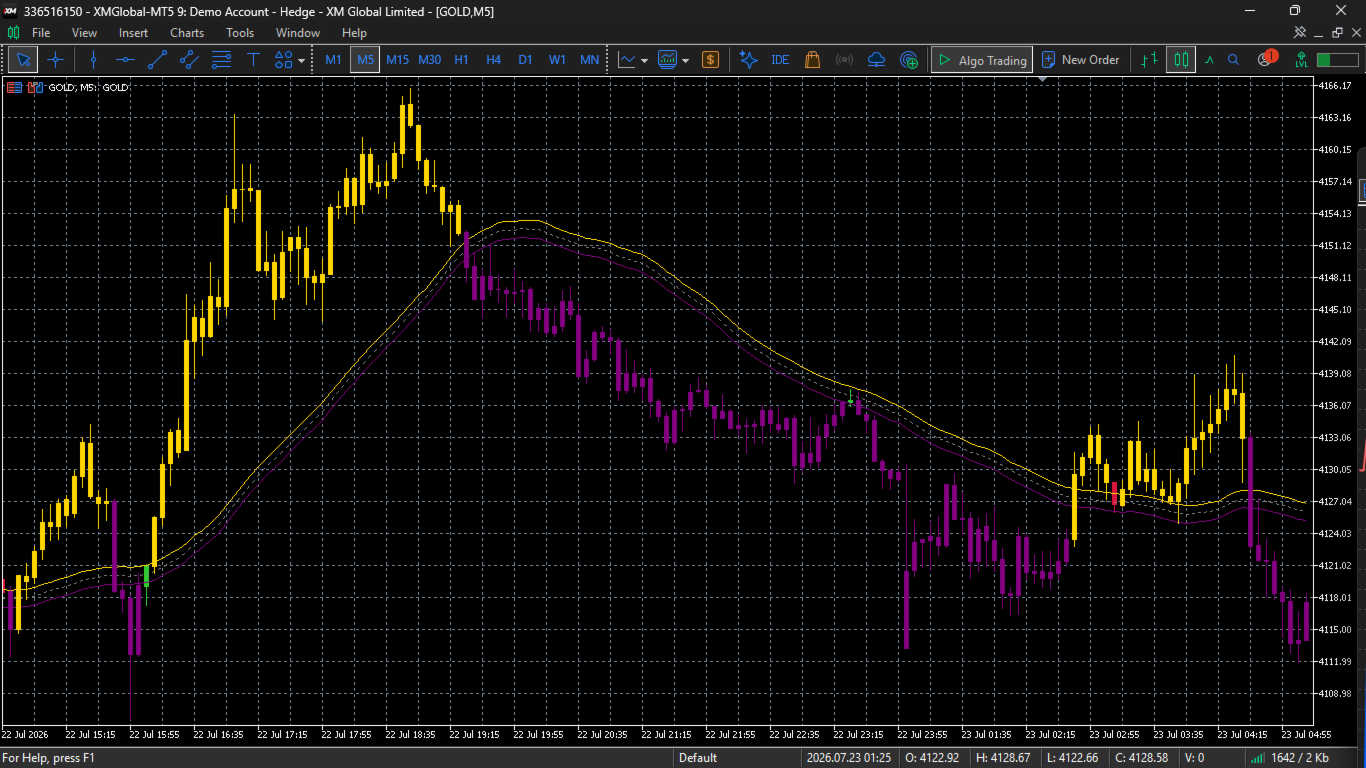
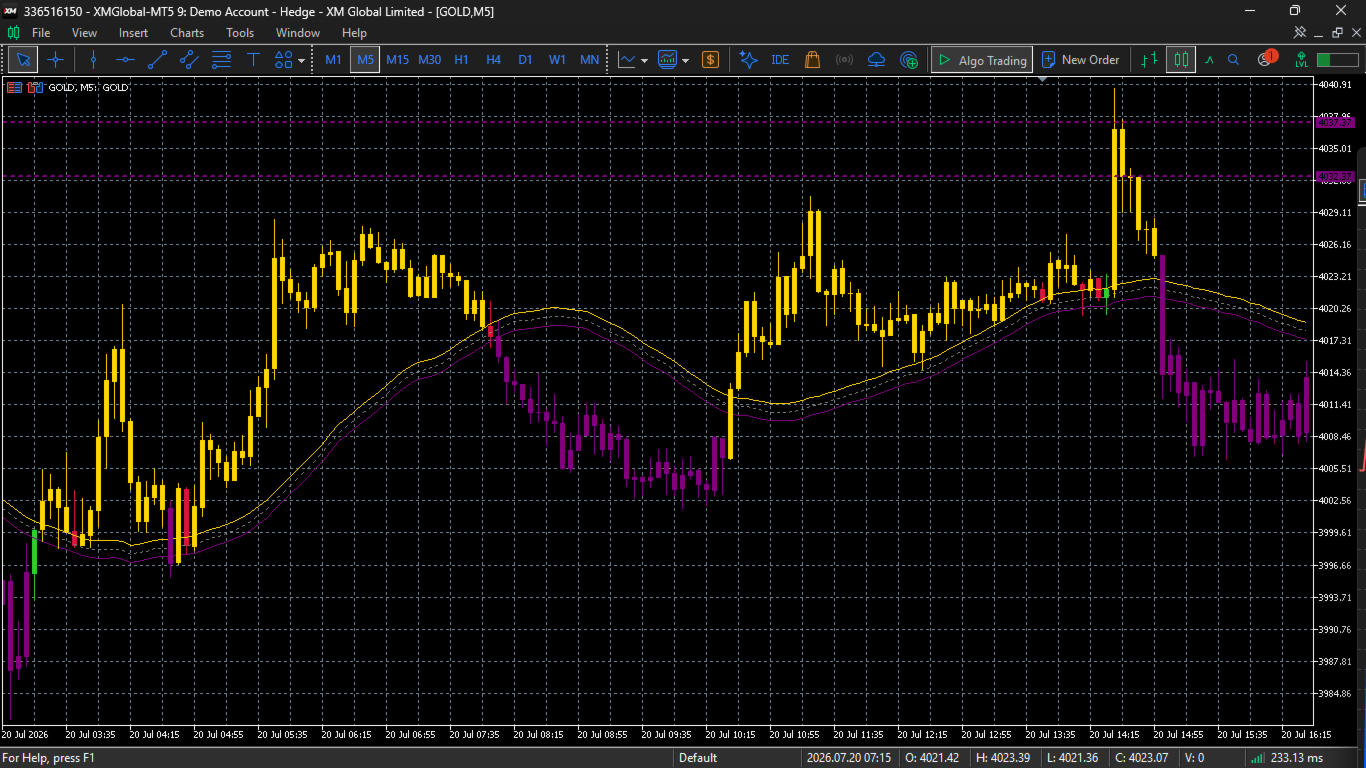
Envelopes Indicator is a powerful trend-following technical analysis tool designed to help traders identify potential buy and sell opportunities. It consists of two bands plotted above and below a moving average. These bands create a trading channel that highlights when price is moving too far away from its average value.

The Envelopes Indicator is suitable for trading Forex, Gold (XAUUSD), indices, cryptocurrencies, and other financial markets. It can be used by beginners who want a simple visual trading method as well as experienced traders looking to improve entry and exit accuracy.

Why Use the Envelopes Indicator?

The market constantly moves between periods of expansion and contraction. The Envelopes Indicator helps traders recognize these price extremes. When price reaches the lower envelope during an uptrend, it may indicate a buying opportunity. When price reaches the upper envelope during a downtrend, it may indicate a selling opportunity.

Key Benefits

* Clearly identifies potential buy and sell zones.
* Helps traders follow the overall market trend.
* Reduces emotional trading by providing objective signals.
* Works on multiple timeframes, from M1 to Monthly charts.
* Suitable for Forex pairs, Gold, indices, and cryptocurrencies.
* Helps define logical Stop Loss and Take Profit levels.
* Simple to understand and easy to use for both new and professional traders.

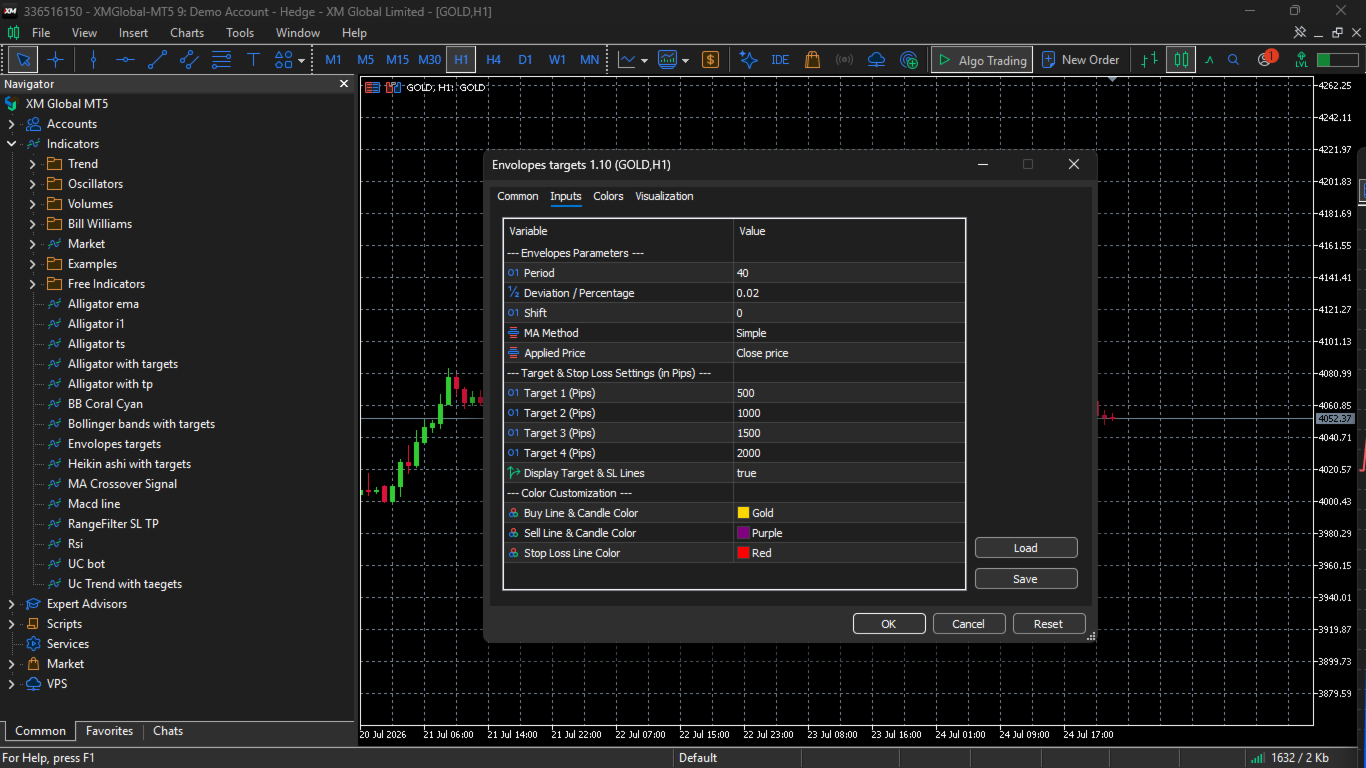
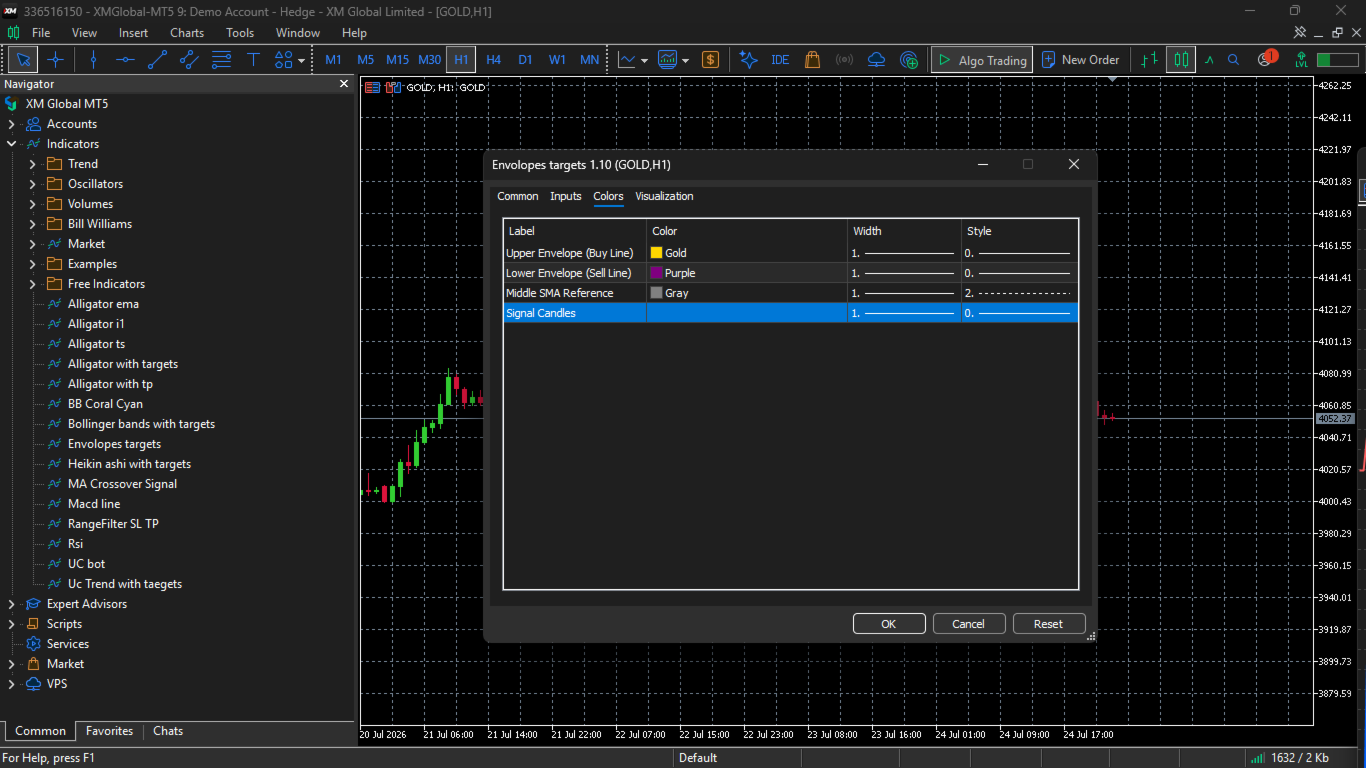
In the following pages, you will learn how to configure the Envelopes Indicator, identify high-probability trading opportunities, place Stop Loss correctly, and manage trades using four profit targets for consistent and disciplined trading.
Другие продукты этого автора
The Core Strategy (Signal Logic) The system filters the market trend using a color-coded Moving Average and enters trades based on specific candle closes to ensure optimal risk-to-reward entries.  Bullish (Buy) Signal: The Moving Average Bearish (Sell) Signal: The Moving Average line turns Red (indicating an institutional downtrend), and a Red candle closes line turns Green (indicating an institutional uptrend), and a Red candle Trade & Risk Managementle closes. Managing the trade after entry i
In simple words, a Super Trade (or Supertrend) indicator is like a color-coded GPS for your trading chart. It takes away the guesswork by doing three basic things:  Tells you the direction: If the line turns green, the market is going up (look to buy). If it turns red, the market is going down (look to sell).  Gives you an entry signal: The exact moment the line switches colors, it tells you it's time to jump into a trade.  Acts as a safety net: It shows you exactly where to place your emergenc
In Japanese, Heikin means "average" and Ashi means "bar" or "foot". Instead of showing raw market prices like standard candlesticks, Heikin Ashi modifies the Open, High, Low, and Close (OHLC) using averages from both the current and the previous candle. This smoothing process eliminates "market noise"—those erratic, small spikes that frequently scare traders out of a solid trend. How to read it at a glance:  Strong Uptrend: A long sequence of green (or blue) candles with no lower wicks.  Strong
Professional Trend-Following Indicator for MetaTrader 5 Dual Moving Average Crossover Pro MT5 Indicator is a powerful and reliable trading indicator designed to identify high-probability Buy and Sell opportunities using the crossover of two Moving Averages. The indicator provides clear visual signals with color-coded moving averages and candles, along with an automatic Stop Loss line and multiple Take Profit targets to help traders execute disciplined trades. Designed for Gold (XAUUSD), Forex
Range Filter Pro MT5 Indicator is a professional trend-filtering indicator developed for MetaTrader 5. It uses a smart Range Filter algorithm to eliminate market noise and identify high-probability Buy and Sell opportunities. By filtering out minor price fluctuations, the indicator helps traders focus on strong market trends and avoid unnecessary entries during sideways conditions. With color-coded trend lines, matching candle colors, an automatic Stop Loss line, and five predefined Take Prof
Bollinger Bands Indicator The Bollinger Bands indicator is one of the most popular technical analysis tools available in MetaTrader 5 (MT5). Developed by John Bollinger, it helps traders identify market volatility, potential trend reversals, and possible entry and exit points. The indicator consists of three lines: the Middle Band (a moving average), the Upper Band, and the Lower Band. As market volatility increases, the bands widen, and when volatility decreases, the bands contract. Benefits
Фильтр:
Нет отзывов
Ответ на отзыв