Ставь лайки и следи за новостями
Поставь на него ссылку - пусть другие тоже оценят
Оцени его работу в терминале MetaTrader 5

DSS Bressert - дважды сглаженный стохастик (Double Smoothed Stochastic Indicator by Walter Bressert) - индикатор для MetaTrader 4

- Просмотров:
- 14527
- Рейтинг:
- Опубликован:
- Обновлен:
-
 Вы упускаете торговые возможности:
- Бесплатные приложения для трейдинга
- 8 000+ сигналов для копирования
- Экономические новости для анализа финансовых рынков
Регистрация ВходВы принимаете политику сайта и условия использования
Если у вас нет учетной записи, зарегистрируйтесь -
 Нужен робот или индикатор на основе этого кода? Закажите его на бирже фрилансеров
Перейти на биржу
Нужен робот или индикатор на основе этого кода? Закажите его на бирже фрилансеров
Перейти на биржу
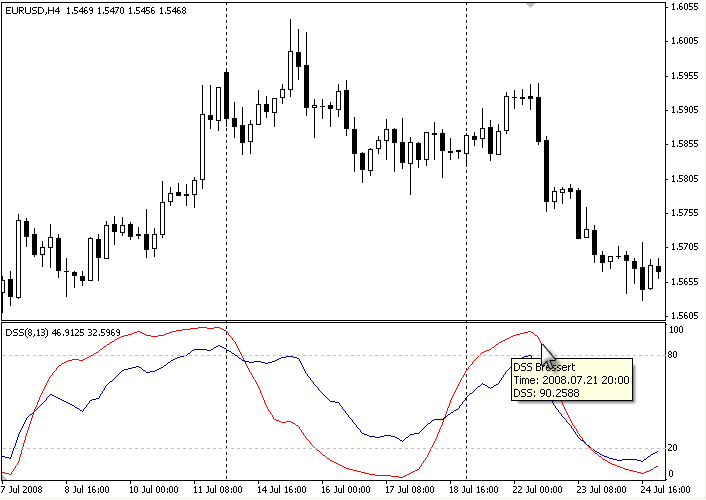
Очень похож на стохастик по алгоритму расчета. Значение выше 80 означает перекупленность, значение ниже 20 означает перепроданность.
Формула расчета взята с сайта http://www.tradesignalonline.com/Lexicon/Default.aspx?name=DSS%3A+Double+Smoothed+Stochastics+(Bressert)
Description
One after the other, William Blau and Walter
Bressert each presented a version of the Double Smoothed Stochastics.
Two exponentially smoothed MAs are used to even out the input values
(H, L and C), in a similar way to the well-known stochastic formula.
Calculation
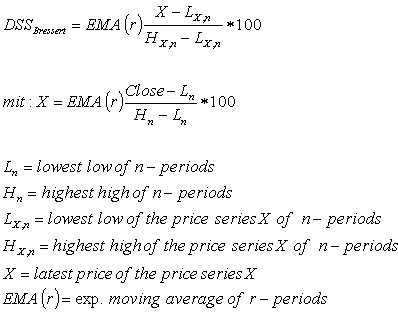
Calculation of the DSS indicator according to Bressert is similar to stochastics.
1.)
The numerator: first the difference between the current close and the
period low is formed. The denominator: here the difference between the
period high minus the period low is calculated. Now the quotient of
numerator and denominator is calculated, exponentially smoothed and
then multiplied by 100.
2.) The method is analogous to 1.) with the distinction that now the prices of the newly calculated price series of 1.) is used.
Parameters
The
adjustable period length can be chosen from 2 to 500. The most common
settings will have a period length ranging from 5 to 30. In addition,
the indicator can be smoothed in the interval from 1 to 50. Meaningful
smoothing values lie in the short-term range.
Interpretation
The
application of the DSS is comparable with that of the stochastic
method. Accordingly, values above 70 or 80 must be regarded as
overbought and values below 20 or 30 as oversold. A rise of the DSS
above its center line should be viewed as bullish, and a fall of the
DSS below its center line as bearish.

