Join our fan page

DSS Bressert - double smoothed stochastic (Double Smoothed Stochastic Indicator by Walter Bressert) - indicator for MetaTrader 4

Use the links below to download the latest builds:
- Views:
- 58409
- Rating:
- Published:
- Updated:
-
 You are missing trading opportunities:
- Free trading apps
- Over 8,000 signals for copying
- Economic news for exploring financial markets
Registration Log inYou agree to website policy and terms of use
If you do not have an account, please register -
 Need a robot or indicator based on this code? Order it on Freelance
Go to Freelance
Need a robot or indicator based on this code? Order it on Freelance
Go to Freelance
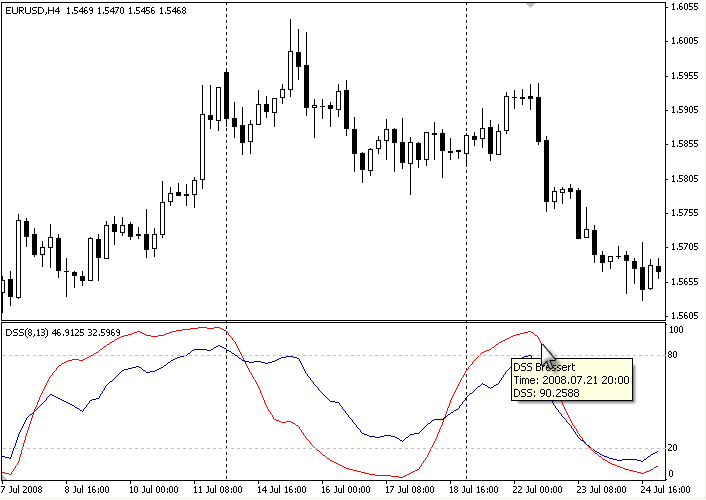
Its calculation algorithm is very similar to that of stochastic indicator. The value above 80 signifies the overbuying, the value below 20 signifies the overselling.
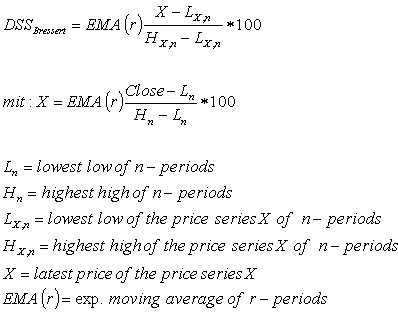
The formula for the calculation is taken from the website http://www.tradesignalonline.com/Lexicon/Default.aspx?name=DSS%3A+Double+Smoothed+Stochastics+(Bressert)
Description
One after the other, William Blau and Walter
Bressert each presented a version of the Double Smoothed Stochastics.
Two exponentially smoothed MAs are used to even out the input values
(H, L and C), in a similar way to the well-known stochastic formula.
Calculation
Calculation of the DSS indicator according to Bressert is similar to stochastics.
1.)
The numerator: first the difference between the current close and the
period low is formed. The denominator: here the difference between the
period high minus the period low is calculated. Now the quotient of
numerator and denominator is calculated, exponentially smoothed and
then multiplied by 100.
2.) The method is analogous to 1.) with the distinction that now the prices of the newly calculated price series of 1.) is used.
Parameters
The
adjustable period length can be chosen from 2 to 500. The most common
settings will have a period length ranging from 5 to 30. In addition,
the indicator can be smoothed in the interval from 1 to 50. Meaningful
smoothing values lie in the short-term range.
Interpretation
The
application of the DSS is comparable with that of the stochastic
method. Accordingly, values above 70 or 80 must be regarded as
overbought and values below 20 or 30 as oversold. A rise of the DSS
above its center line should be viewed as bullish, and a fall of the
DSS below its center line as bearish.
Translated from Russian by MetaQuotes Ltd.
Original code: https://www.mql5.com/ru/code/8310
MA_Gideon2
Indicator MA_Gideon2.
 File Operations without Limitations
Well, the functions of file operations are used in the system library of kernel32.dll. It is this library that we import into the EA. The code is attached.
 Altarius_RSI&Stoh
I've tested the EA on EUR/USD M15, it uses stochastic and RSI.
SymbolList
The script swaps out all the symbols available in the Market Watch window into a csv file.