Moving Avej intersection

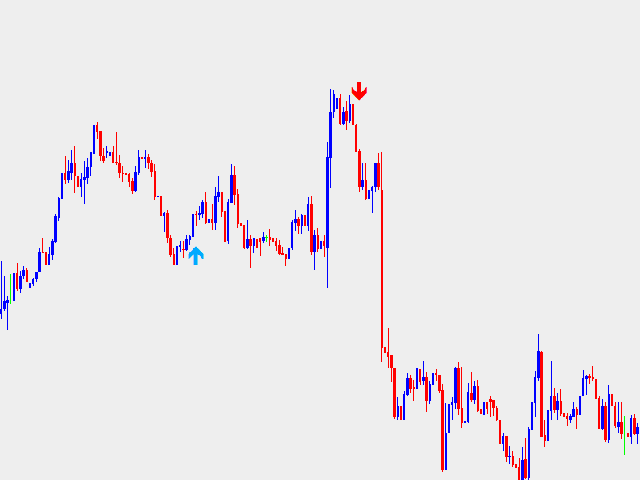
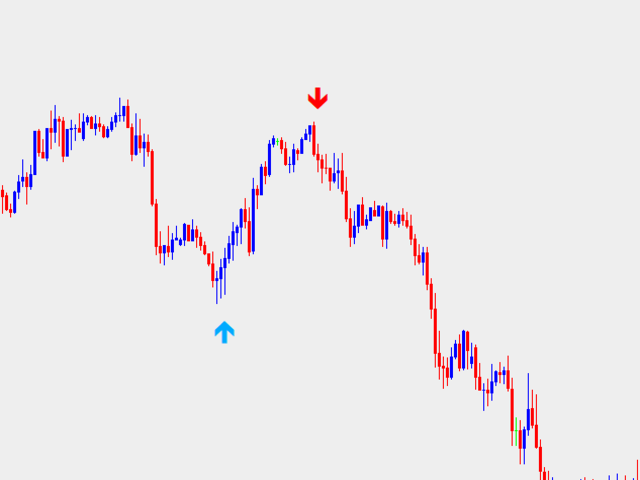
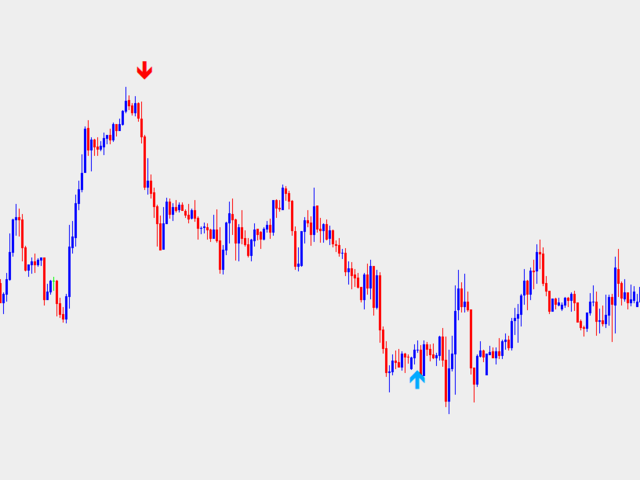
Referência aos sinais de compra / venda de ações ascendentes e descendentes.

O sinal de indicador gera sinais e alertas de compra / venda de ações ascendentes e descendentes para sinalizar reverseões ou Continuação das vertências.

Como o nome egere، esse sinal gera lucros seguindo a sin dominante e é mais eficaz seguindo o princípio de montar na onda. تعرف على الدليل الأساسي الذي يجب أن يكون مفيدًا.

O uso de bons sinais é evidenciado por alertas، tornando o sinal preciso quando um bom sinal é identificado.

Esse indicador é usado em gráficos de 5 e 15 minutos para التجار que desejam seguir a tência dominante، e em gráficos de 30 minutos، 1 hora e 4 horas para trading mais expientes.

O uso do indicador، no entanto، reber boa aplicação seguindo o princípio de montar na onda.

مثال: 5 دقائق 15 دقيقة للمتداولين الذين يبحثون عن التجار من خلال 30 دقيقة ، 1 ساعة e 4 تجارب للمتداولين.

كومو أوسار:

Ative o alerta (دفع البريد الإلكتروني / notificações). Receba o sinal، verifique a monitoração e evite áreas de resistência / suporte ou áreas de oferta / demanda، defina o interalo móvel (como suporte / resistência dinâmica) paraerminar se é uma configuração ou não. Depois ، siga a negociação.


Produtos recomendados
Daily Candle Predictor é um indicador que prevê o preço de fechamento de uma vela. O indicador destina-se principalmente ao uso em gráficos D1. Este indicador é adequado tanto para negociação forex tradicional quanto para negociação de opções binárias. O indicador pode ser usado como um sistema de negociação autônomo ou pode atuar como um complemento ao seu sistema de negociação existente. Este indicador analisa a vela atual, calculando certos fatores de força dentro do próprio corpo da vela, be
OtmScalpHedge
Otmane Achandir
OtmScalp EA V1 - Robô de Scalping com IA para EUR, Ouro e BTC OtmScalp EA V1 - O Robô de Scalping com Inteligência Artificial para EUR, Ouro e BTC Oferta por tempo limitado: Apenas $499 (Preço original: $1200 - Aumento de preço em breve!) Por que escolher o OtmScalp EA V1? Lucros diários consistentes - Desenvolvido para scalping agressivo porém controlado 3 versões especializadas - Otimizado para pares EUR, ouro (XAU/USD) e bitcoin (BTC/USD) Operação 100% automática - Funciona 24/5 sem intervenç
The Infinity Expert Advisor is a scalper. When the resistance and support levels are broken, trades are opened in the direction of the price movement. Open positions are managed by several algorithms based on the current market situation (fixed stop loss and take profit, trailing stop, holding positions in case of trend indication, etc.). Requirements for the broker The EA is sensitive to spread, slippages and execution quality. It is strongly recommended not to use the EA for currencies with s
EARLY REMINDER: The Starting price is 65 price will rise soon up to 365$ and then 750$ after first 10 copies of sales. Grab this offer now! Introduction Hello, traders! Welcome to the demonstration of the Forex Beast Indicator , a comprehensive tool designed to assist aspiring traders in navigating the complexities of the forex market. This indicator incorporates seven essential components to provide a well-rounded trading experience: Moving Averages Colored Zones Support and Resistance Levels
O indicador Crypto_Forex "Auto FIBO Pro" é uma ótima ferramenta auxiliar na negociação! - O indicador calcula e coloca automaticamente no gráfico os níveis de Fibonacci e as linhas de tendência locais (cor vermelha). - Os níveis de Fibonacci indicam áreas-chave onde o preço pode reverter. - Os níveis mais importantes são 23,6%, 38,2%, 50% e 61,8%. - Pode utilizá-lo para scalping de reversão ou para negociação de grelha de zona. - Existem muitas oportunidades para melhorar o seu sistema atual u
Super Reversal Pattern
Parfait Mujinga Ndalika
Super Reversal Pattern Indicator Unlock the power of advanced pattern recognition with our Super Reversal Pattern Indicator. Designed for traders seeking precision and reliability, this indicator identifies one of the most effective reversal patterns in technical analysis, offering a significant edge in your trading strategy. Key Features: Non-Repainting Accuracy: Enjoy the confidence of non-repainting technology. Once a Super Reversal Pattern is detected, it remains static, providing consiste
VR Cub
Vladimir Pastushak
VR Cub é um indicador para obter pontos de entrada de alta qualidade. O indicador foi desenvolvido para facilitar cálculos matemáticos e simplificar a busca por pontos de entrada em uma posição. A estratégia de negociação para a qual o indicador foi escrito tem provado a sua eficácia há muitos anos. A simplicidade da estratégia de negociação é a sua grande vantagem, o que permite que até mesmo os comerciantes novatos negociem com sucesso com ela. VR Cub calcula os pontos de abertura de posição e
Noize Absorption Index MT4
Ekaterina Saltykova
5 (1)
Noize Absorption Index - is the manual trading system that measures the difference of pressure between bears forces and bulls forces. Green line - is a noize free index that showing curent situation. Zero value of index shows totally choppy/flat market.Values above zero level shows how powerfull bullish wave is and values below zero measures bearish forces.Up arrow appears on bearish market when it's ready to reverse, dn arrow appears on weak bullish market, as a result of reverse expectation. S
Volume Compair
Thiago Pereira Pinho
Indicador Profissional de Delta Cumulativo e Mediana de Volume Acompanhe a pressão real de compra/venda com esta poderosa ferramenta de análise de volume. O Volume Compare Indicator combina o Delta Cumulativo e as Medianas de Volume para ajudar você a identificar a atividade institucional, desequilíbrios e potenciais reversões. Principais Recursos: Histograma de Delta Cumulativo – Visualiza o volume líquido de compra vs. venda em tempo real. Medianas de Volume de Compra/Venda – Linhas hor
Wave Trend MT4
Diego Arribas Lopez
MT5 Version   Wave Trend MT4 Wave Trend is an oscillator, which helps identifing in a extremely accurate manner market reversals. The Oscillator being obove the overbought level and a cross down of the fast into the slow MA usually indicates a good SELL signal. If the oscillators is below the oversold level and the fast MA crosses over the slower MA usually highlights a good BUY signal. The Wave Trend indicator can be also used when divergences appear against the price, indicating the current mo
O indicador SMC Venom Model BPR é uma ferramenta profissional para os traders que trabalham com o conceito Smart Money (SMC). Identifica automaticamente dois padrões principais no gráfico de preços: FVG   (Fair Value Gap) é uma combinação de três velas, em que existe um gap entre a primeira e a terceira velas. Forma uma zona entre níveis onde não há suporte de volume, o que geralmente leva a uma correção de preço. BPR   (Balanced Price Range) é uma combinação de dois padrões FVG que formam uma “
Trend Bilio - an arrow indicator without redrawing shows potential market entry points in the form of arrows of the corresponding color: upward red arrows suggest opening a buy, green down arrows - selling. The entrance is supposed to be at the next bar after the pointer. The arrow indicator Trend Bilio visually "unloads" the price chart and saves time for analysis: no signal - no deal, if an opposite signal appears, then the current deal should be closed. It is Trend Bilio that is considered
O indicador cria cotações atuais, que podem ser comparadas com as históricas e, com base nisso, fazer uma previsão do movimento dos preços. O indicador possui um campo de texto para navegação rápida até a data desejada. Opções: Símbolo - seleção do símbolo que o indicador exibirá; SymbolPeriod - seleção do período do qual o indicador coletará dados; IndicatorColor - cor do indicador; HorisontalShift - deslocamento das cotações desenhadas pelo indicador pelo número especificado de barras; I
Binary Options Support Resistance Indicator This indicator is designed for binary options trading and effectively shows retracements from support and resistance levels. Signals appear on the current candle. A red arrow pointing downwards indicates a potential selling opportunity, while a blue arrow pointing upwards suggests buying opportunities. All that needs adjustment is the color of the signal arrows. It is recommended to use it on the M1-M5 timeframes as signals are frequent on these timef
Smart Funded Hft
Barbaros Bulent Kortarla
4.82 (65)
!! POR FAVOR, ATUALIZE PARA A ÚLTIMA VERSÃO 2.05 PARA UM DESEMPENHO AINDA MAIS RÁPIDO!! SMART FUNDED HFT ACABOU DE PASSAR NO DESAFIO DE 100K DA KORTANA FX NA ABERTURA DO MERCADO EM 29.01.2024, APESAR DA BAIXA VOLATILIDADE POR FAVOR, VERIFIQUE A SEÇÃO DE CAPTURAS DE TELA, COLOQUEI A PROVA LÁ IMPORTANTE NÃO PERCA O DESCONTO EXCLUSIVO DE 40% DA KORTANA FX PARA PAGAMENTOS EM CRIPTOMOEDAS ATÉ 29.01.2024.  Liberte o seu potencial de trading com o Smart Funded HFT EA!   SEM NECESSIDADE DE VPS / SEM ARQ
Royal Dutch Skunk
Sayan Vandenhout
ROYAL DUTCH SKUNK USES THE TREND WAVE INDICATOR AND IT CAN IDENTIFY THE BEGINNING AND THE END OF A NEW WAVE TREND MOVEMENT. AS AN OSCILLATOR, THE INDICATOR IDENTIFIES THE OVERBOUGHT AND OVERSOLD ZONES. IT WORKS GREAT TO CATCH THE SHORT TERM PRICE REVERSALS AND USES A MARTINGALE STRATEGY TO CLOSE ALL TRADES IN PROFIT. USE DEFAULT SETTINGS ON H1 OR HIGHER TIME FRAME ON ANY PAIR FOR MORE ACCURATE TRADES WHY THIS EA : Smart entries calculated by 6 great strategies The EA can be run on even a $20000
Trend PA
Mikhail Nazarenko
5 (3)
The Trend PA indicator uses   Price Action   and its own filtering algorithm to determine the trend. This approach helps to accurately determine entry points and the current trend on any timeframe. The indicator uses its own algorithm for analyzing price changes and Price Action. Which gives you the advantage of recognizing, without delay, a new nascent trend with fewer false positives. Trend filtering conditions can be selected in the settings individually for your trading style. The indicator
Alpha Trend sign has been a very popular trading tool in our company for a long time. It can verify our trading system and clearly indicate trading signals, and the signals will not drift. Main functions: Based on the market display of active areas, indicators can be used to intuitively determine whether the current market trend belongs to a trend market or a volatile market. And enter the market according to the indicator arrows, with green arrows indicating buy and red arrows indicating se
The Super Arrow Indicator provides non-repainting buy and sell signals with exceptional accuracy. Key Features No repainting – confirmed signals remain fixed Clear visual arrows: green for buy, red for sell Real-time alerts via pop-up, sound, and optional email Clean chart view with no unnecessary clutter Works on all markets: Forex, gold, oil, indices, crypto Adjustable Parameters TimeFrame Default: "current time frame" Function: Sets the time frame for indicator calculation Options: Can be set
Koala Supply Demand
Ashkan Hazegh Nikrou
5 (2)
Apresentando o Indicador de Oferta e Demanda Koala para MetaTrader 4 (Incentivamos você a compartilhar sua avaliação ou feedback — seja positivo ou negativo — para que outros traders possam se beneficiar de sua experiência.) : Bem-vindo ao Indicador de Oferta e Demanda Koala. Este indicador é projetado para identificar zonas contínuas de oferta e demanda. Ele pode ajudar o trader a visualizar o mercado como áreas de zona; você pode ver como o preço respeita algumas zonas poderosas. Este indicad
FREE
A nova versão torna este indicador uma ferramenta completa para estudo, análise e operação de padrões probabilísticos. Suas funções incluem: Monitor de porcentagem de múltiplos ativos no gráfico. Martingales configuráveis. Vinte e um padrões pré-configurados. Um editor de padrões avançado para armazenar até 5 padrões personalizados. Modo Backtest para testar resultados com relatório de perdas. Filtro de tendência. Filtro de hits. Opção de Ciclos de Martingale. Vários tipos de estratégias e alert
Owl smart levels
Sergey Ermolov
4.24 (37)
Versão MT5  |  FAQ O   Indicador Owl Smart Levels   é um sistema de negociação completo dentro de um indicador que inclui ferramentas populares de análise de mercado, como   fractais avançados de Bill Williams , Valable ZigZag que constrói a   estrutura de onda correta   do mercado e   níveis de Fibonacci que marcam os níveis exatos de entrada no mercado e lugares para obter lucros. Descrição detalhada da estratégia Instruções para trabalhar com o indicador Consultor de negociação Owl Helper Ch
Night ghost
Dmitriy Kashevich
Night Ghost - Indicador de seta para opções binárias. Este é um assistente confiável para você no futuro! - Sem redesenho no gráfico -Funciona muito bem em todos os pares de moedas! -Precisão do indicador de até 90% (especialmente à noite) -Não há necessidade de configurar por um longo tempo (Configurar perfeitamente para Opções Binárias) - Sem sinais de atraso - O aparecimento de um sinal na vela atual -Perfeito para o período M1 (não mais!) - Cor de vela amigável aos olhos (vermelho
Happy Scalping Indicator
Leandro Bernardez Camero
Este indicador foi projetado para scalping agressivo e entradas rápidas em opções binárias , gerando sinais em toda vela , para que você saiba exatamente o que está acontecendo o tempo todo. Junte-se ao canal Happy Scalping: MQL5 Não repinta : o sinal da vela atual é gerado em TEMPO REAL , o que significa que pode mudar enquanto a vela ainda está em formação, dependendo se o preço sobe ou desce em relação ao fechamento da vela anterior. Mas uma vez que a vela fecha , a cor do sinal fica comple
Red Hawk EA
Profalgo Limited
4.18 (17)
NEW PROMO: Only a few copies copies available at 349$ Next price: 449$ Make sure to check out our " Ultimate EA combo package " in our   promo blog ! Red Hawk is a "mean reversion" trading system, that trades during the quiet times of the market. It runs on 9 pairs currently: EURUSD, GBPUSD, USDCHF, EURCHF, EURGBP, AUCAD, AUDJPY, EURAUD and USDCAD. Recommended timeframe: M5 Since this kind of strategy works best with low spread and fast execution, I advise using an good ECN broker. IMPORTANT F
Infinity Trend Pro
Yaroslav Varankin
1 (1)
This is a trend indicator without redrawing Developed instead of the binary options strategy (by the color of the Martingale candlestick) Also works well in forex trading When to open trades (binary options) A signal will appear in the place with a candle signaling the current candle It is recommended to open a deal for one candle of the current timeframe M1 and M5 When a blue dot appears, open a deal up When a red dot appears, open a trade down. How to open trades on Forex. When a signal is rec
Forex Gump Trend is a universal indicator for highly effective determination of the trend direction. If you identify the trend correctly, this is 95% of trading success, because you will be able to open trades in the direction of the price movement and benefit from it. The Forex Gump Trend indicator helps traders with a high degree of efficiency to determine the current trend direction, as well as trend reversal points. The direction of the trend is shown by colored lines on the chart, and the
"Dynamic Scalping Oscillator" - um indicador avançado e personalizado para Crypto_Forex - uma ferramenta de negociação eficiente para MT4! - Nova geração de osciladores - veja as imagens para saber como usá-lo. - O Dynamic Scalping Oscillator possui zonas adaptáveis de sobrevenda/sobrecompra. - O oscilador é uma ferramenta auxiliar para encontrar pontos de entrada exatos em áreas dinâmicas de sobrevenda/sobrecompra. - Valores de sobrevenda: abaixo da linha verde, valores de sobrecompra: acima
The indicator allows you to trade binary options. The recommended time frame is М1 and the expiration time is 1,2,3 minutes. The indicator suitable for auto and manual trading. A possible signal is specified as a arrows above/under a candle. You should wait until the candle closes! Arrows are not re-painted Trade sessions: TOKYO section (Half-end) Currency pairs: USD/JPY Working time frame: M1 Expiration time: 1,2,3 minutes. The indicator also shows good results when using the martingale strateg
FREE
Project Oro
Giacomo Donati
Follow us on Instagram: https://www.instagram.com/project_oro_ea Project Oro is a trading algorithm project that I began approximately six years ago. After countless painful and excruciating hours of coding, it is finally ready to be released to the public. The Expert Advisor (EA) is built on a proprietary and unique technique that analyzes the behavior and movement of candlesticks and the price action within the gold market. It searches for short windows of opportunity to strike and exits tr
Os compradores deste produto também adquirem
Meravith
Ivan Stefanov
5 (1)
O indicador analisa o volume de cada ponto e calcula os níveis de exaustão do mercado para esse volume. Ele consiste em três linhas: Linha de exaustão do volume altista Linha de exaustão do volume baixista Linha que indica a tendência do mercado. Esta linha muda de cor para refletir se o mercado é altista ou baixista. Você pode analisar o mercado a partir de qualquer ponto inicial que escolher. Uma vez que uma linha de exaustão de volume seja atingida, identifique um novo ponto de início para o
O indicador " Dynamic Scalper System " foi desenvolvido para o método de scalping, operando dentro de ondas de tendência. Testado nos principais pares de moedas e ouro, é possível a compatibilidade com outros instrumentos de negociação. Fornece sinais para a abertura de posições de curto prazo ao longo da tendência, com suporte adicional para o movimento dos preços. O princípio do indicador: As setas grandes determinam a direção da tendência. Um algoritmo para gerar sinais de scalping sob a fo
OrderFlow Absorption – Indicador Profissional de Delta e Sinais de Absorção para MT4 Desbloqueie o poder da verdadeira análise de fluxo de ordens com o OrderFlow Absorption – o indicador definitivo de histograma de delta e sinais de absorção para MetaTrader 4. Desenvolvido para traders que desejam enxergar o que realmente acontece por trás de cada movimento de preço, esta ferramenta revela pressões ocultas de compra/venda e eventos de absorção que movimentam o mercado. Recursos Visualização do H
BinaryUniversal
Andrey Spiridonov
BinaryUniversal is a signal indicator for binary options and Forex. In its work, the indicator uses a complex algorithm for generating signals. Before forming a signal, the indicator analyzes volatility, candlestick patterns, important support and resistance levels. The indicator has the ability to adjust the accuracy of the signals, which makes it possible to apply this indicator for both aggressive and conservative trading. The indicator is set in the usual way, it works on any time period and
This indicator is a multifunctional technical analysis tool based on the combination of an adaptive exponential moving average and volatility filters calculated through the Average True Range (ATR). It is designed to accurately identify the current price direction, highlight key trend reversal areas, and visualize potential turning zones. The algorithm is built upon the dynamic construction of a trend ribbon using two levels of volatility — outer and inner ranges. The outer boundaries serve as i
O indicador EasyWayTradePanel para MetaTrader4 é um assistente de negociação para negociação manual em qualquer moeda em FOREX , CRYPTOCURRENCY como Bitcoin, Ethereum, Lightcoin,Ripple  e mais. Também é EasyWay para usar para COMMODITY como Gold, Silver, Oil, Gas ...... e CFDs . Quando instalado no gráfico em seu período de tempo e ferramenta de negociação escolhidos, o indicador desenha automaticamente os seguintes indicadores personalizados usados ​​na estratégia de negociação EasyWayTradePan
This is a mini One pair version of Advanced Detector of Trend Reversal and Continuance known as TrueTrendStarM(TTSm25). It is a sensitive and Predictive indicator of Price Trends for Professional traders.  ( ATTENTION BUYERS:-Now the indicator is available for UNLIMITED TIME ONE TIME buy of just $500 ). Avail the Opportunity.    It detects high odds changes in Price Trend direction long before other indicator detects it. I have been working on it since 2019.    This is possible due to fractal
Rtc ML Ai Predictor MT4
Muhammad Faisal Sagala
Rtc ML Ai | Predictor CORE MACHINE LEARNING ENGINE Adaptive ML Market Predictor – Multi-Bar Trend & Candle Forecast What This Indicator Does This indicator is a real-time market prediction engine designed to analyze price behavior and estimate future market tendencies . Unlike conventional indicators, this system does not rely on static parameters or historical curve-fitting , but adapts its internal state dynamically during live market operation. Instead of using static rules, the indicator
FFx Engulfing Setup Alerter gives trade suggestions with Entry, Target 1, Target 2 and StopLoss. Below are the different options available: Entry suggestion - pips to be added over the break for the entry 3 different options to calculate the SL - by pips, by ATR multiplier or at the pattern High/Low 3 different options to calculate the 2 TPs - by pips, by ATR multiplier or at Risk/Reward Offset the dashboard - any place on the chart Remove the suggestion once the price reached the SL line Lines
FFx InsideBar Setup Alerter gives trade suggestions with Entry, Target 1, Target 2 and StopLoss. Below are the different options available: Entry suggestion - pips to be added over the break for the entry Minimum candle size - to avoid too close buy/sell entry suggestions 3 different options to calculate the SL - by pips, by ATR multiplier or at the pattern High/Low 3 different options to calculate the 2 TPs - by pips, by ATR multiplier or at Risk/Reward Offset the dashboard - any place on the c
FFx OutsideBar Setup Alerter gives trade suggestions with Entry, Target 1, Target 2 and StopLoss. Below are the different options available: Entry suggestion - pips to be added over the break for the entry. 3 different options to calculate the SL - by pips, by ATR multiplier or at the pattern High/Low. 3 different options to calculate the 2 TPs - by pips, by ATR multiplier or at Risk/Reward. Offset the dashboard - any place on the chart. Remove the suggestion once the price reached the SL line.
FFx PinBar Setup Alerter gives trade suggestions with Entry, Target 1, Target 2 and StopLoss. Below are the different options available: Entry suggestion - pips to be added over the break for the entry Minimum candle size - to avoid too small candles 3 different options to calculate the SL - by pips, by ATR multiplier or at the pattern High/Low 3 different options to calculate the 2 TPs - by pips, by ATR multiplier or at Risk/Reward Offset the dashboard - any place on the chart Remove the sugges
Automatic, live & interactive picture of all trendlines. Assign push, email and sound alerts to the lines of your choice and be informed about price rollback, breakout, rollback after breakout, number of rollbacks, line expiration by double breakout. Correct, drag or delete the lines and interactively tune the line system. https://youtu.be/EJUo9pYiHFA . Chart examples https: //www.mql5.com/en/users/efficientforex Price Interaction Events All events are effective immediately and only after one
The purpose of this new version of the MT4 standard indicator provided in your platform is to display in a sub-window multiple timeframes of the same indicator with its divergences. See the example shown in the picture below. But the display isn't like a simple MTF indicator. This is the real display of the indicator on its timeframe. Here's the options available in the FFx divergences indicator: Select the timeframes to be displayed (M1 to Monthly) Define the width (number of bars) for each tim
The purpose of this new version of the MT4 standard indicator provided in your platform is to display in a sub-window multiple timeframes of the same indicator with its divergences. See the example shown in the picture below. But the display isn't like a simple MTF indicator. This is the real display of the indicator on its timeframe. Here's the options available in the FFx divergences indicator: Select the timeframes to be displayed (M1 to Monthly). Define the width (number of bars) for each ti
The FFx Dashboard MTF alerter will show you on a single chart all the timeframes (M1 to Monthly) with their own status for the indicator. 2 Alert Options: Single timeframe: each selected timeframe alert separately when a signal occurs Multi timeframes: all selected timeframes must agree for an alert to be triggered Both options have an input to select the timeframes to be used for the alert(s). How to Understand the Status: Green/Red square: histogram above/below 0 line Green square + Red bord
The FFx Dashboard MTF alerter will show you on a single chart all the timeframes (M1 to Monthly) with their own status for the indicator. 2 Alert Options: Single timeframe: each selected timeframe alert separately when a signal occurs Multi timeframes: all selected timeframes must agree for an alert to be triggered Both options have an input to select the timeframes to be used for the alert(s). How to understand the status: Green/Red square: RSI above/below 50 line Green square + Red border: R
The FFx Dashboard MTF alerter will show you on a single chart all the timeframes (M1 to Monthly) with their own status for the indicator. 2 Alert Options: Single timeframe: each selected timeframe alert separately when a signal occurs Multi timeframes: all selected timeframes must agree for an alert to be triggered Both options have an input to select the timeframes to be used for the alert(s). How to understand the status: Green/Red square: Stoch above/below 50 line Green square + Red border:
The FFx Dashboard MTF alerter will show you on a single chart all the timeframes (M1 to Monthly) with their own status for the indicator. 2 Alert Options: Single timeframe: each selected timeframe alert separately when a signal occurs Multi timeframes: all selected timeframes must agree for an alert to be triggered Both options have an input to select the timeframes to be used for the alert(s). How to understand the status: Green/Red square: Price above/below Cloud (Kumo) Green square + Red bo
The FFx Dashboard MTF alerter will show you on a single chart all the timeframes (M1 to Monthly) with their own status for the indicator. 2 Alert Options: Single timeframe: each selected timeframe alert separately when a signal occurs Multi timeframes: all selected timeframes must agree for an alert to be triggered Both options have an input to select the timeframes to be used for the alert(s). How to understand the status: Green/Red square: MA pointing Up/Down Green square + Red border: MA po
The FFx Dashboard MTF alerter will show you on a single chart all the timeframes (M1 to Monthly) with their own status for the indicator. 2 Alert Options: Single timeframe: each selected timeframe alert separately when a signal occurs. Multi timeframes: all selected timeframes must agree for an alert to be triggered. Both options have an input to select the timeframes to be used for the alert(s). How to understand the status: Green square: Price above PSAR Red square: Price below PSAR Options
The FFx Dashboard MTF alerter will show you on a single chart all the timeframes (M1 to Monthly) with their own status for the indicator. 2 Alert Options: Single timeframe: each selected timeframe alert separately when a signal occurs Multi timeframes: all selected timeframes must agree for an alert to be triggered Both options have an input to select the timeframes to be used for the alert(s). How to understand the status: Green/Red square: CCI above/below levels (ie. 100/-100) Grey square: C
The FFx Dashboard MTF alerter will show you on a single chart all the timeframes (M1 to Monthly) with their own status for the indicator. 2 Alert Options: Single timeframe: each selected timeframe alert separately when a signal occurs Multi timeframes: all selected timeframes must agree for an alert to be triggered Both options have an input to select the timeframes to be used for the alert(s). How to understand the status: Green/Red square: ADX above level Grey square: ADX below level Red bor
The FFx Dashboard MTF alerter will show you on a single chart all the timeframes (M1 to Monthly) with their own status. 2 Alert Options: Single timeframe: each selected timeframe alert separately when a signal occurs Multi timeframes: all selected timeframes must agree for an alert to be triggered Both options have an input to select the timeframes to be used for the alert(s). How to understand the status: Green/Red square: bullish/bearish candle Options available in the FFx Dashboard Alerter
The [GRAFF] III manual trading system is based on multiple MetaTrader (MT4) indicators. Together, the entire PACK of GRAFF III indicators makes an advanced trading tool. The system consists of over 20 different custom-built indicators which have been carefully selected and tested in the long term to produce strong and efficient trading signals. The particular indicators are based on different mathematical formulas, so the entire system is calibrated to remove false signals from its own indicator
This indicator allows you to see the strength of the trend on all timeframes. It can be used for all currency pairs. The indicator can be displayed in the form of a column (from left to right): status buy / sell / strong buy / strong sell, strength of the trend in percentage, pips last candle, body candle now, remaining time, and the timeframe of M1 to MN. Information contained below (from left to right): total trend percent, sell percent, buy percent.
FFx Universal Strength Meter PRO is more than a basic strength meter. Instead of limiting the calculation to price, it can be based on any of the 19 integrated strength modes + 9 timeframes. With the FFx USM, you are able to define any period for any combination of timeframes. For example, you can set the dashboard for the last 10 candles for M15-H1-H4… Full flexibility! Very easy to interpret... It gives a great idea about which currency is weak and which is strong, so you can find the best pai
Filtro:
Sem comentários
Responder ao comentário