Support and Resistance Screener Pro MT5
- Indicadores
- STE S.S.COMPANY
- Versão: 13.20
- Atualizado: 13 dezembro 2023
- Ativações: 10
O Support And Resistance Screener está em um indicador de nível para MetaTrader que fornece várias ferramentas dentro de um indicador. As ferramentas disponíveis são:
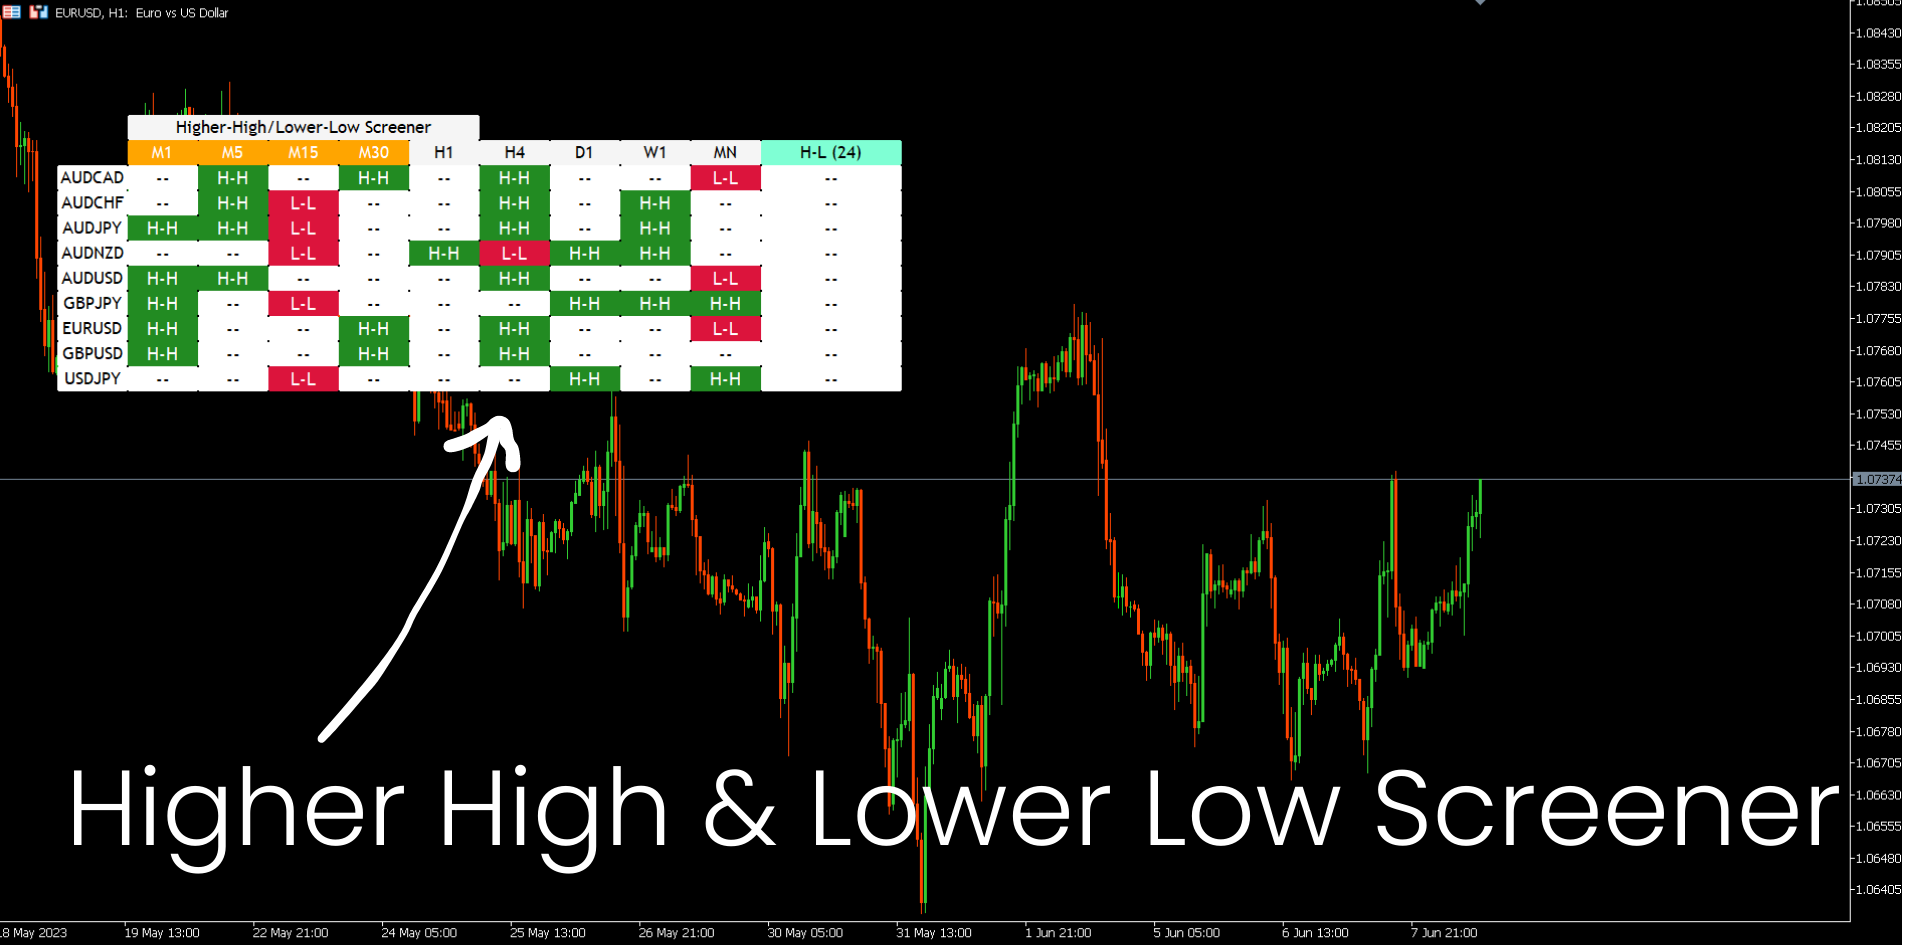
1. Screener de estrutura de mercado.
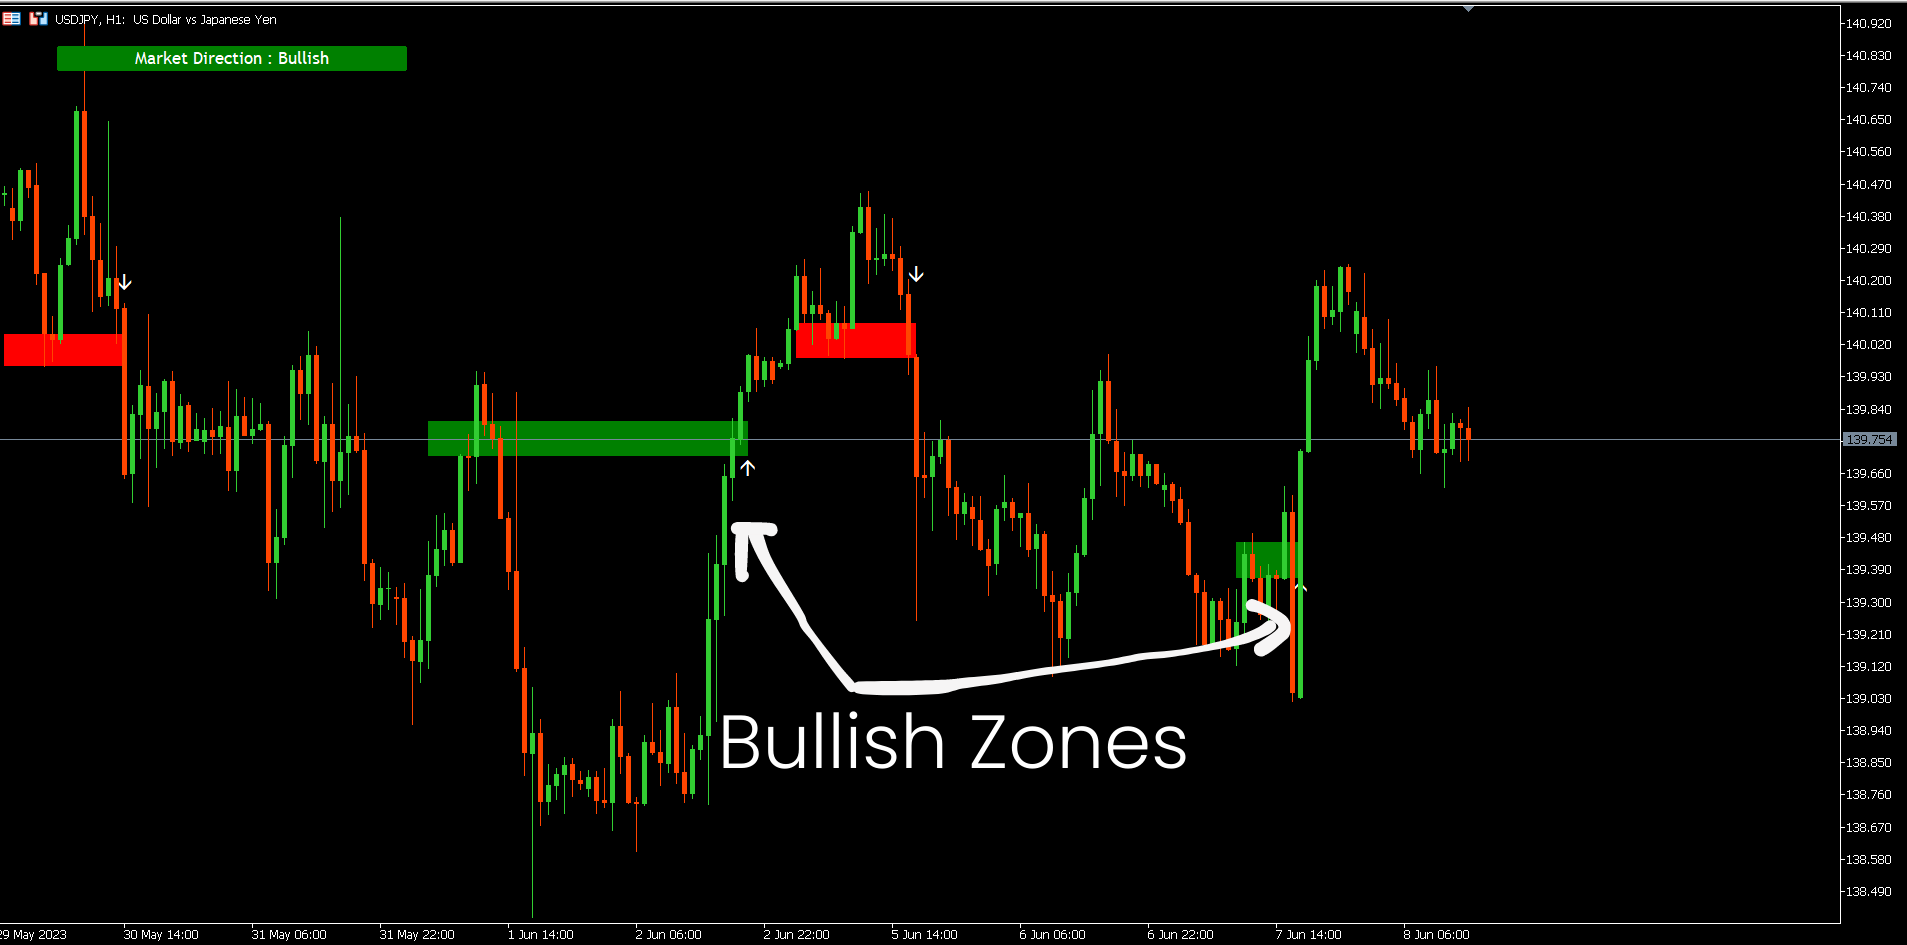
2. Zona de retração de alta.
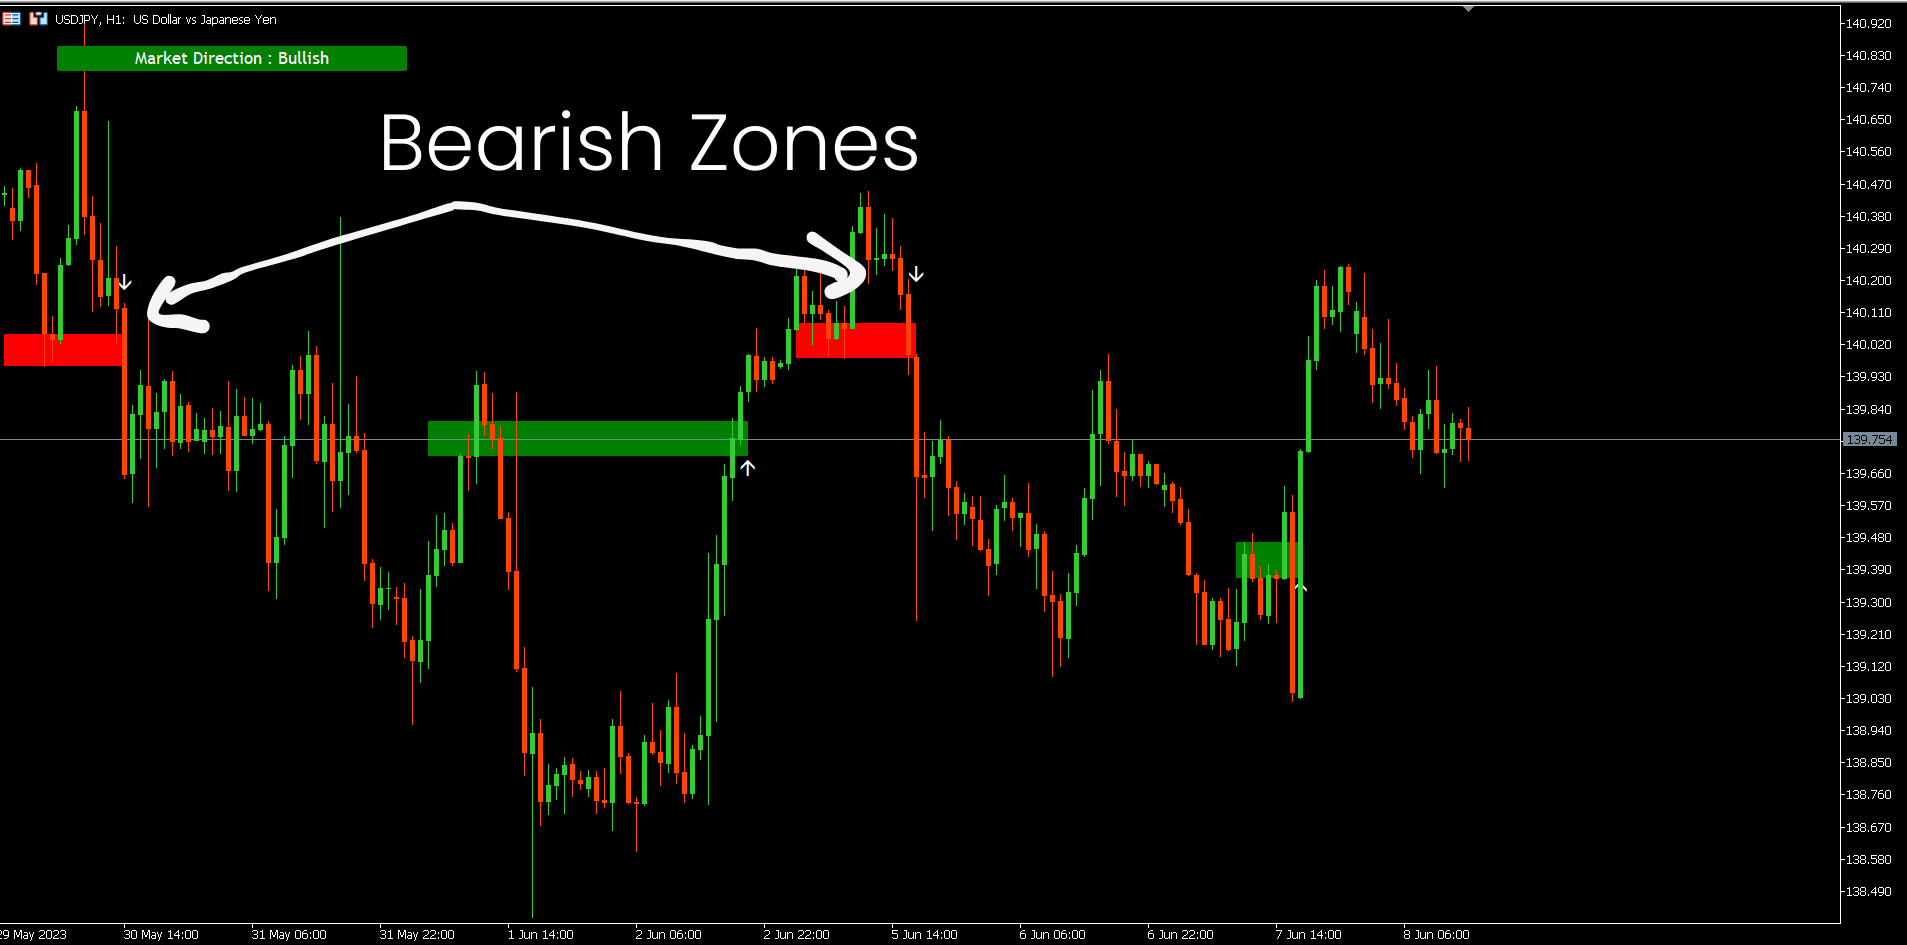
3. Zona de retração de baixa.
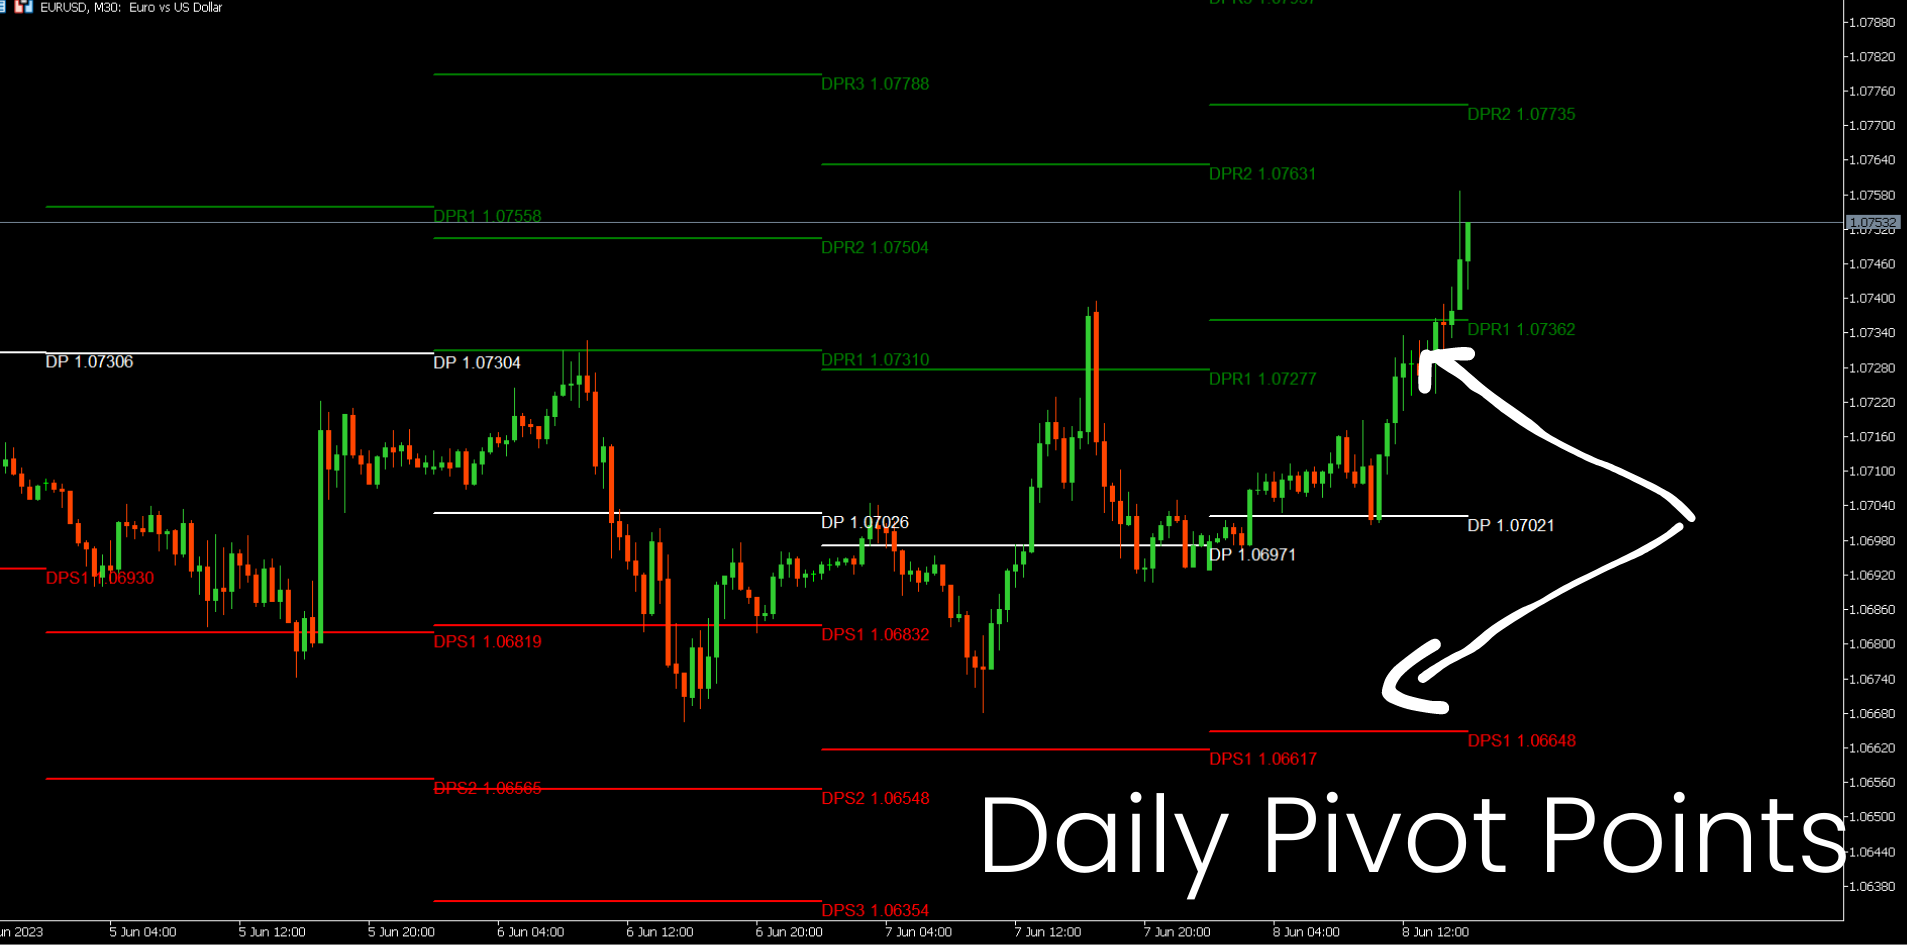
4. Pontos de Pivô Diários
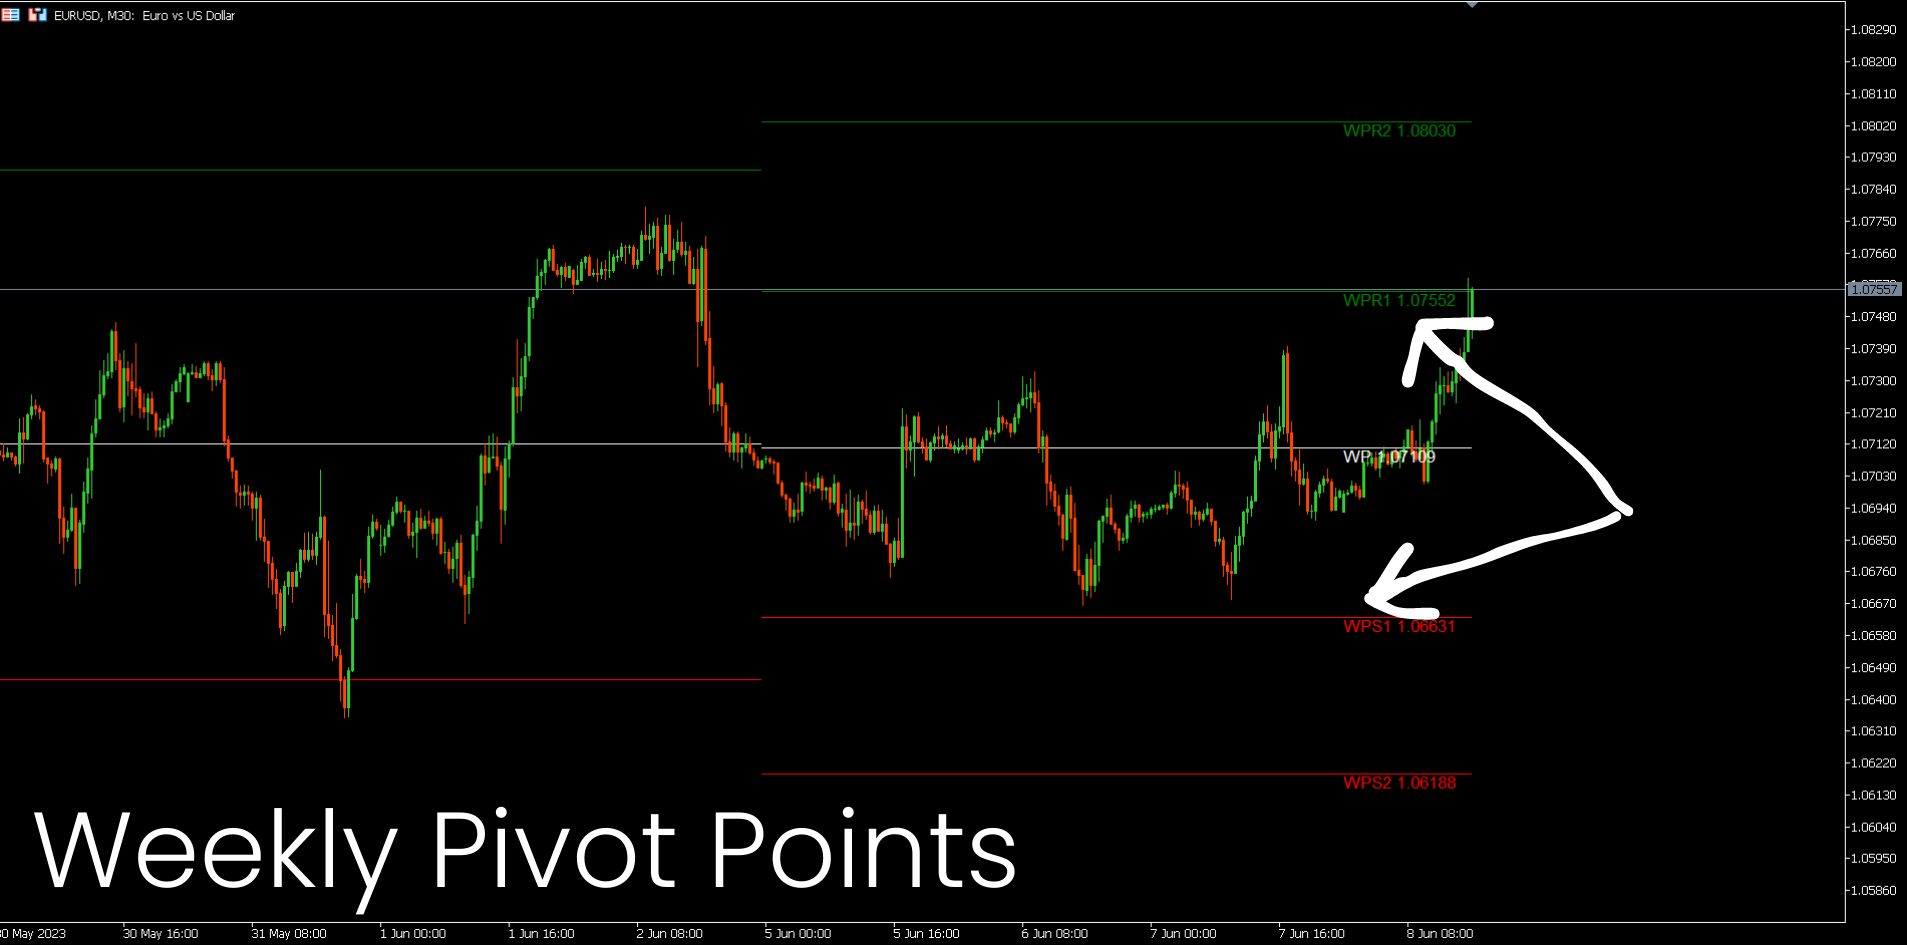
5. Pontos Pivot semanais
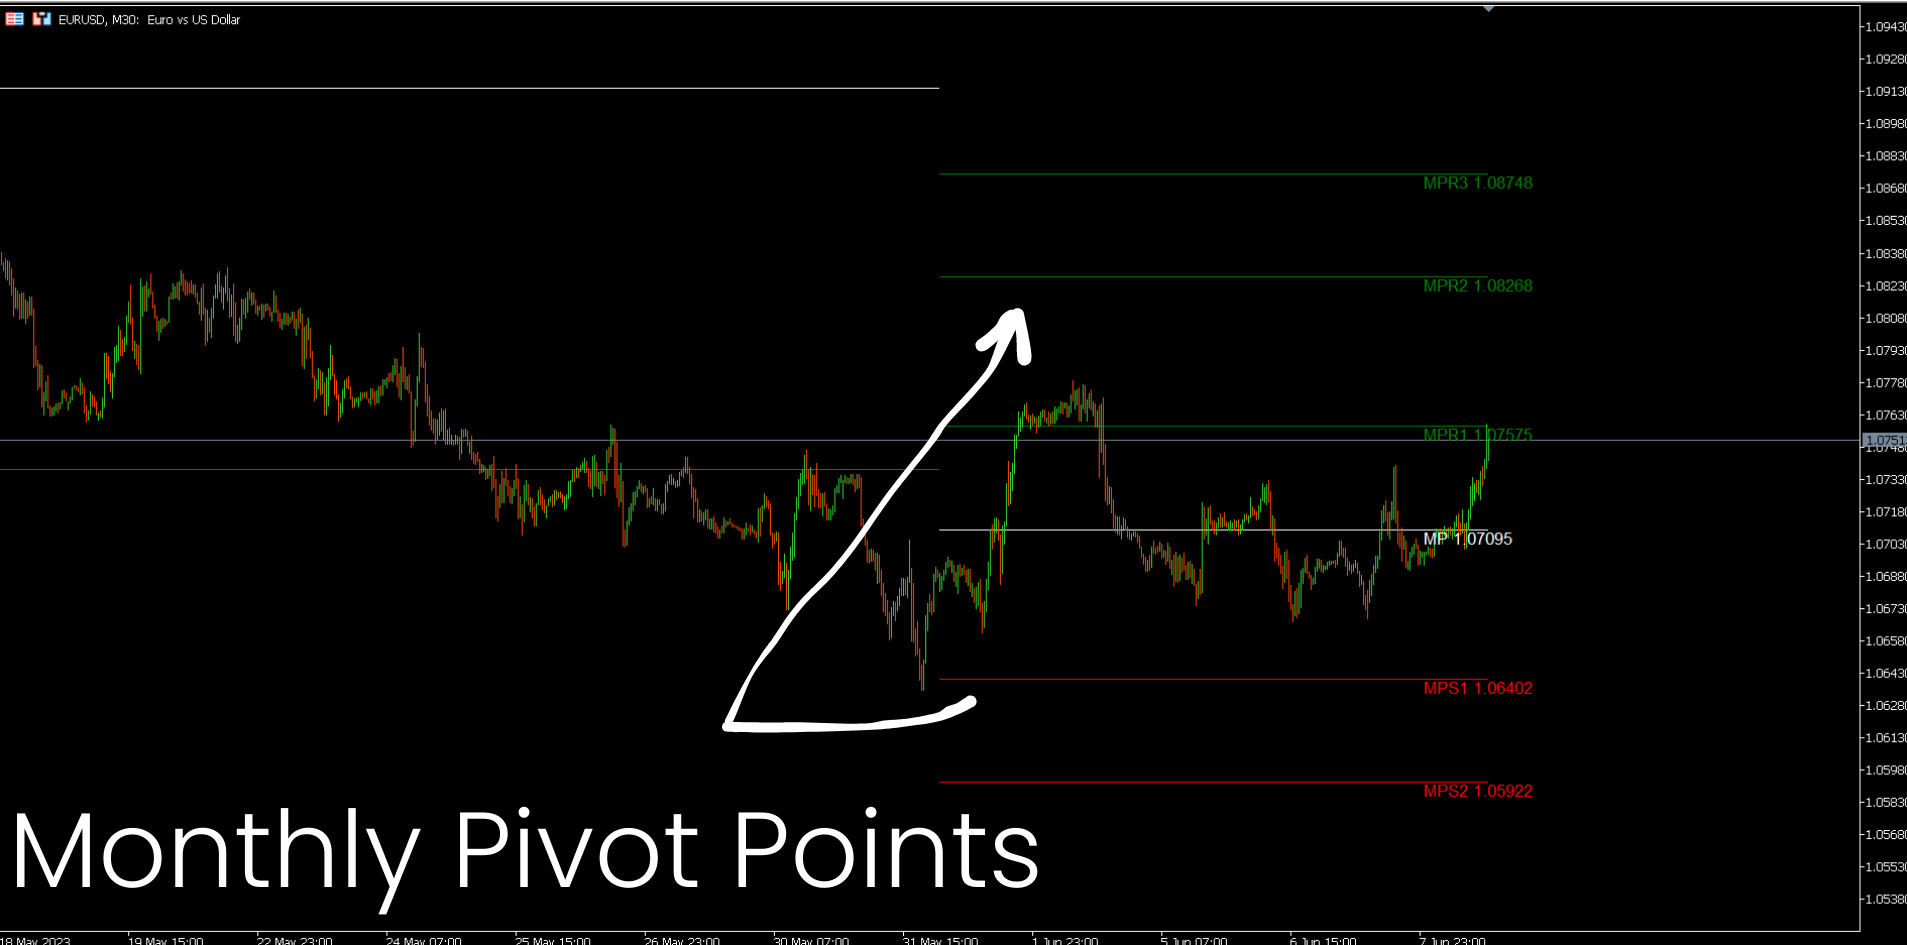
6. Pontos Pivot mensais
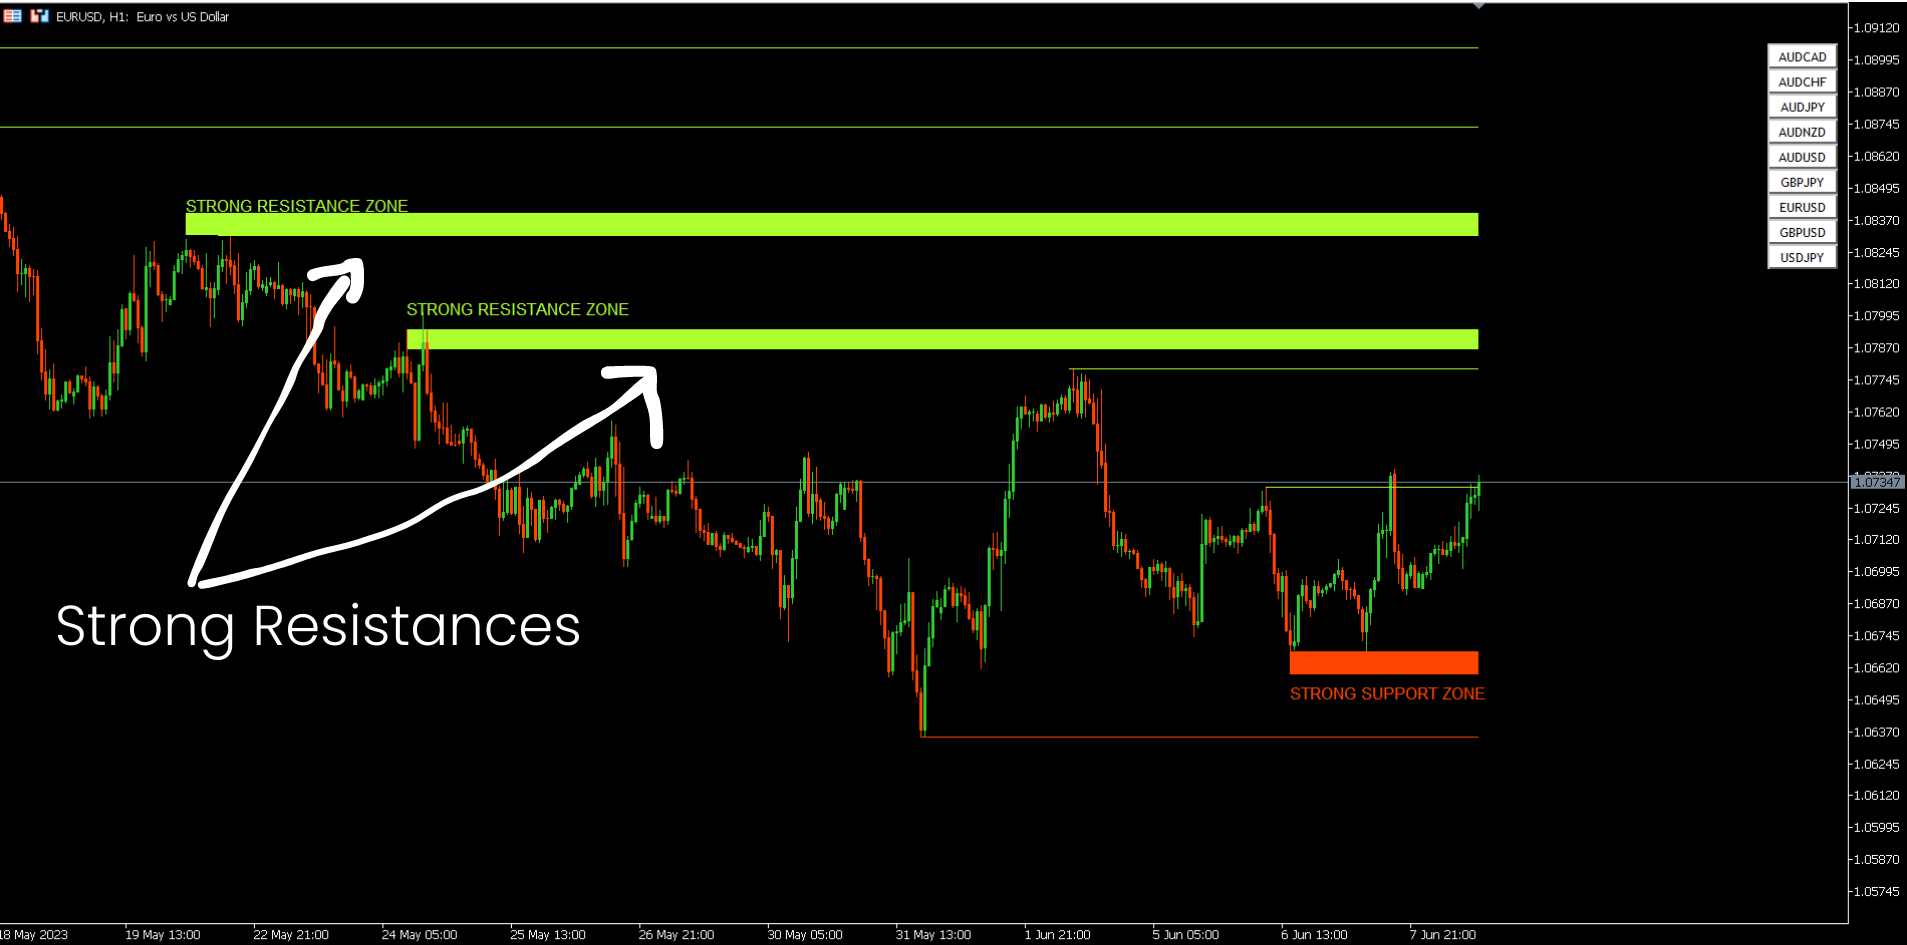
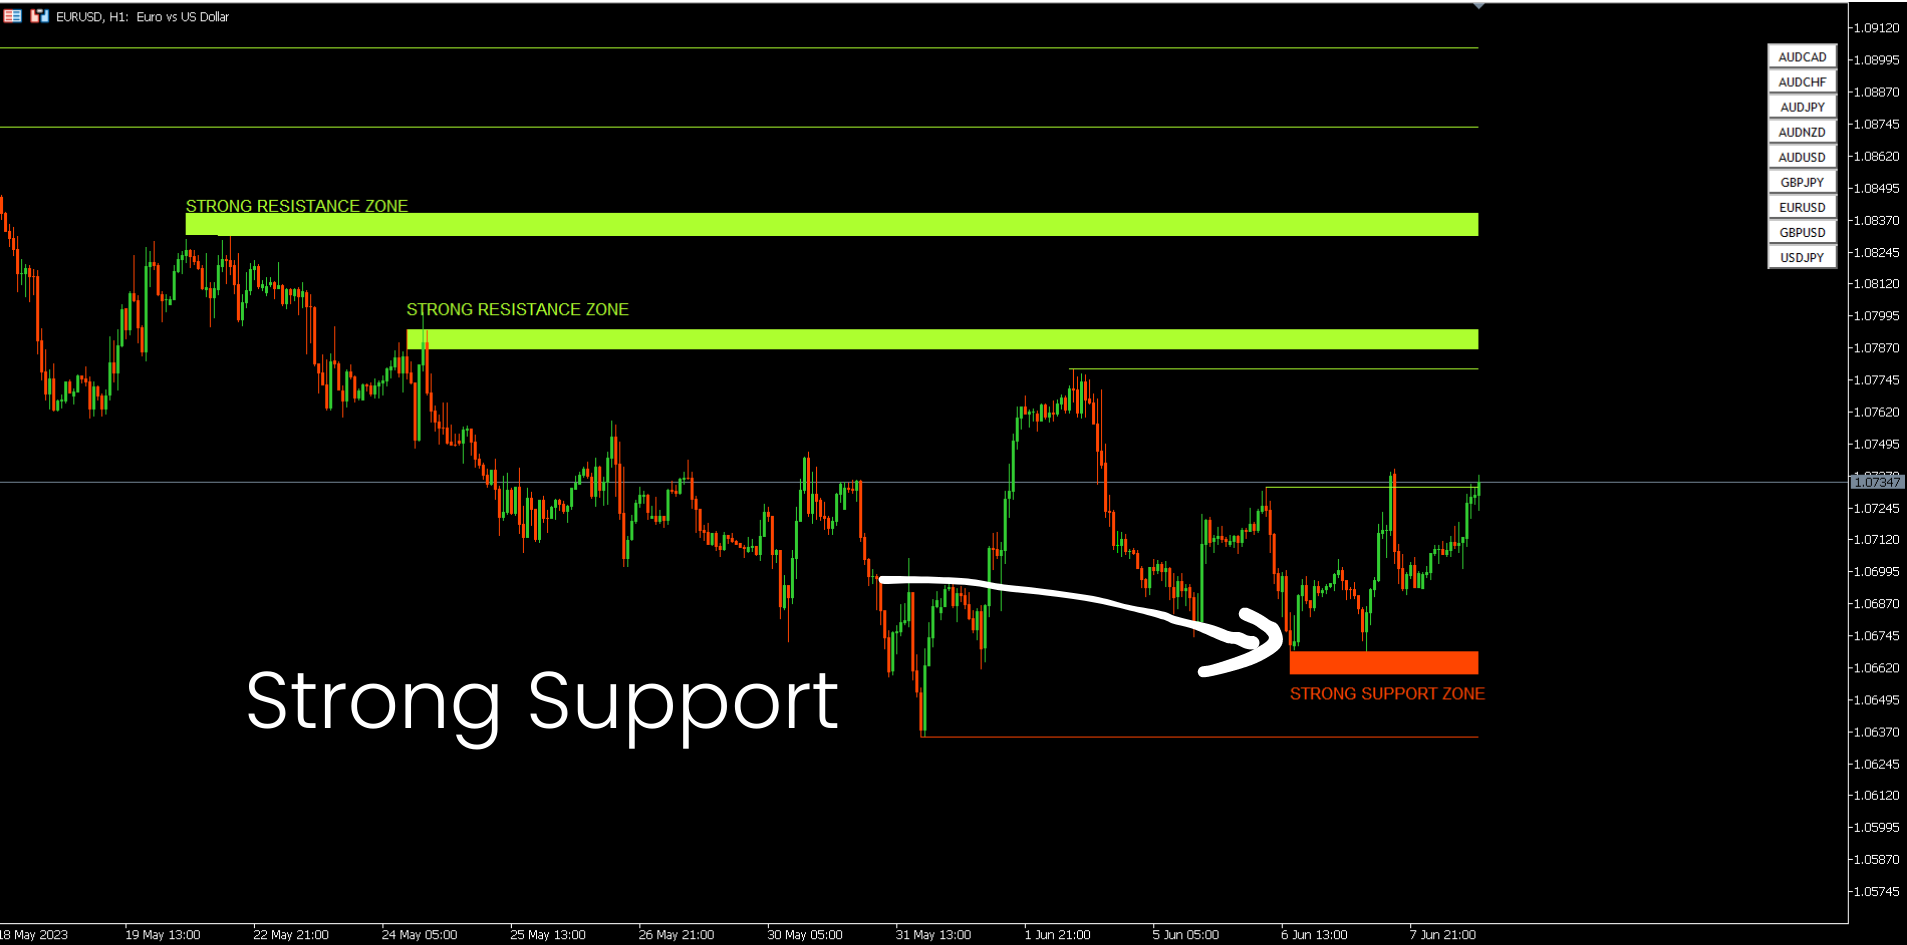
7. Forte suporte e resistência com base no padrão harmônico e volume.
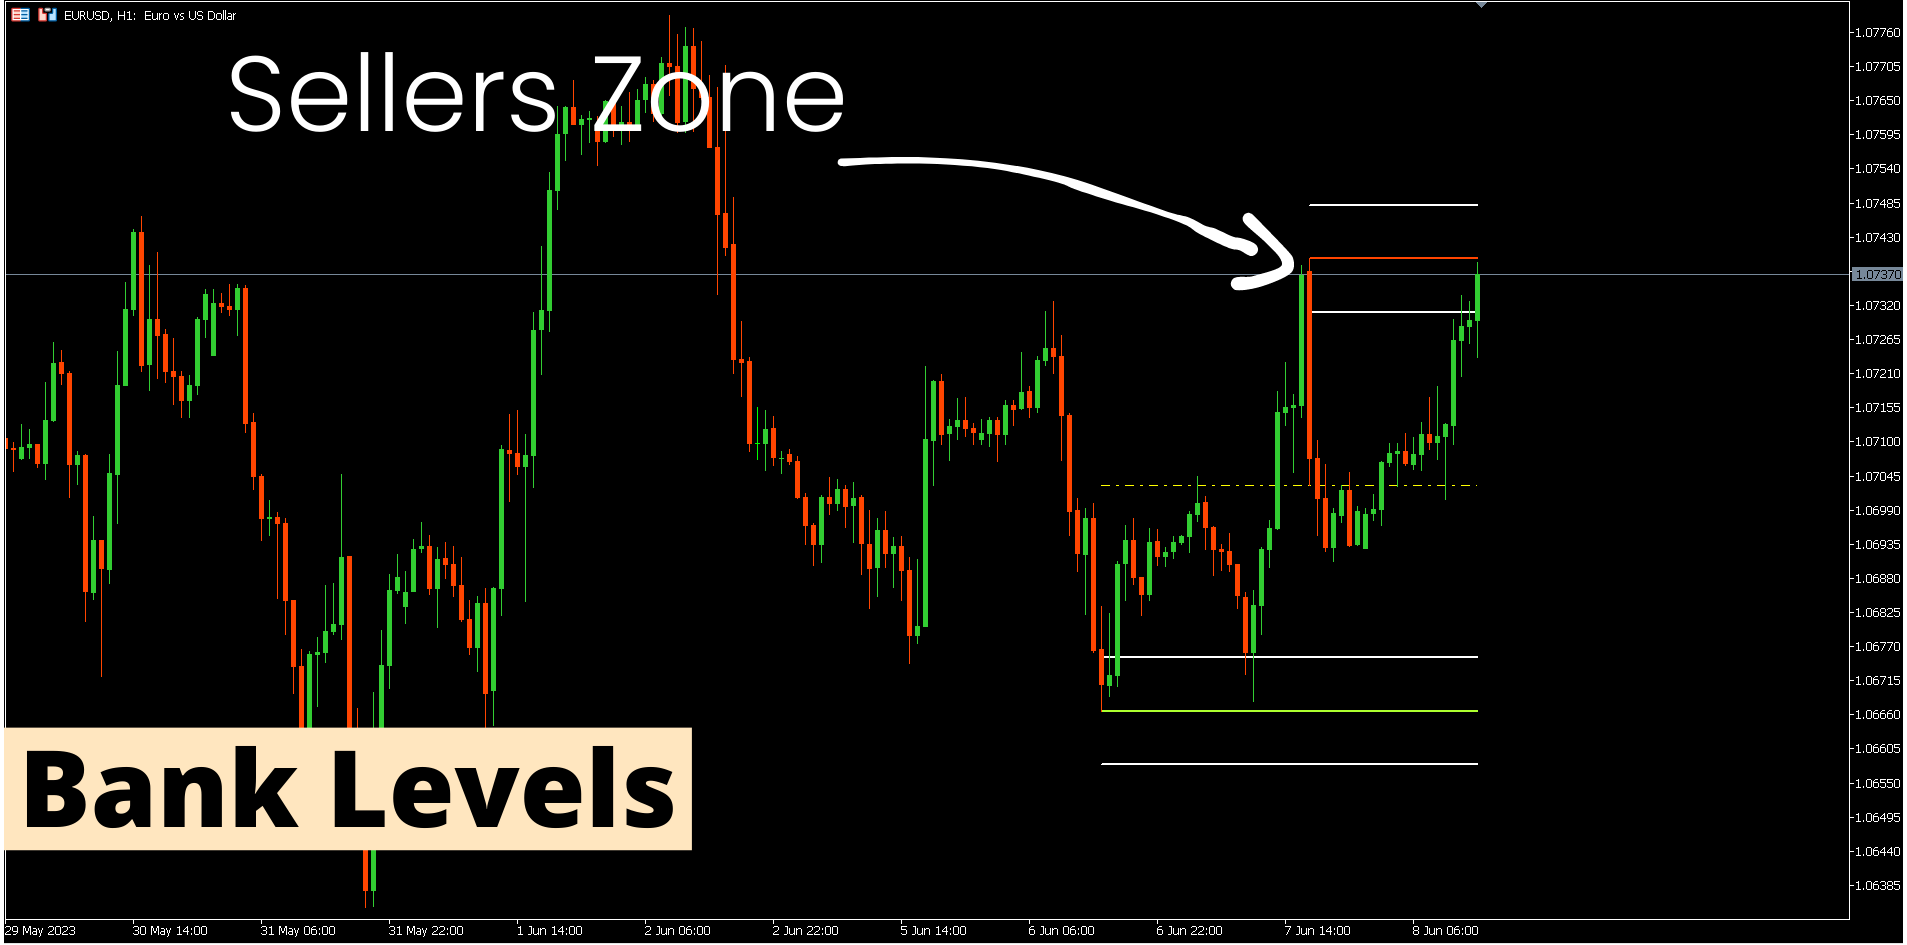
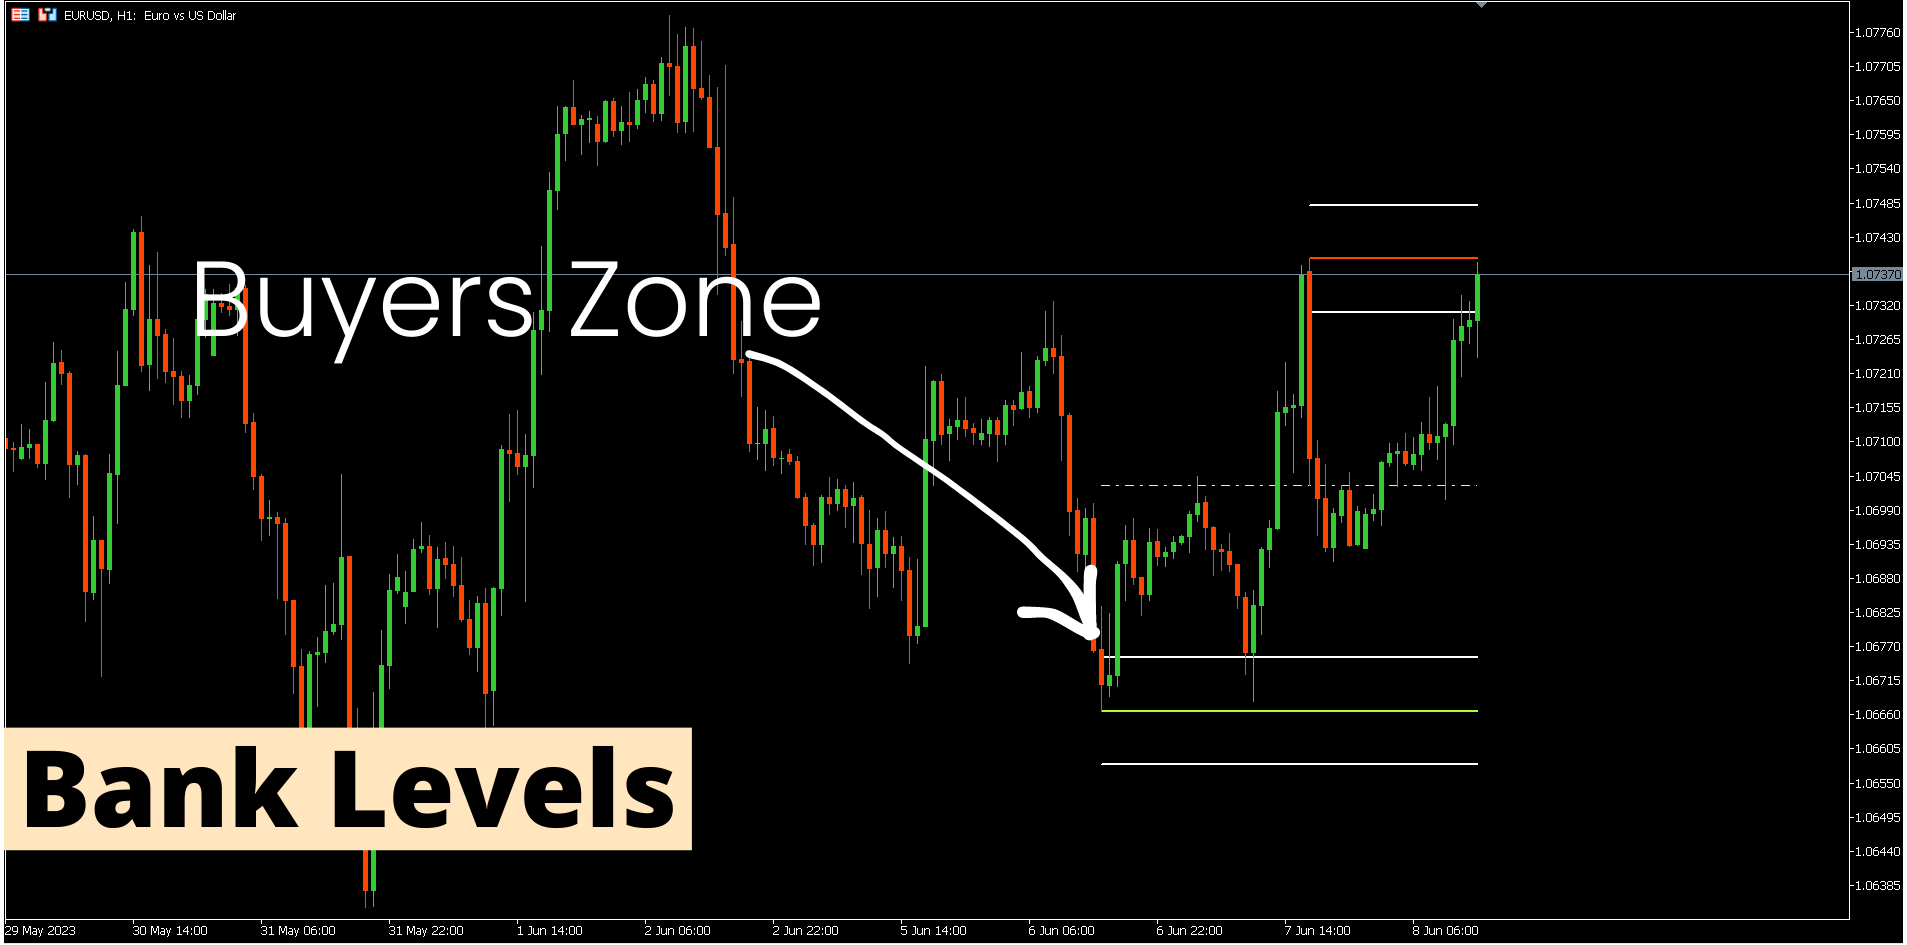
8. Zonas de nível de banco.
OFERTA POR TEMPO LIMITADO: O indicador de suporte e resistência de alta tensão está disponível por apenas 50 $ e vitalício. (Preço original 125 $)
Acessando nosso Blog MQL5, você pode encontrar todos os nossos indicadores premium com exemplos de análise: Clique aqui
Características principais
- Zonas de forte suporte e resistência baseadas em algoritmos de Harmônica e Volume.
- Zonas de retração de alta e baixa baseadas em algoritmos de Harmônica e Volume.
- Analisador de estrutura de mercado
- Pontos Pivots diários, semanais e mensais.
Documentações
Todas as documentações do Screener de Suporte e Resistência (Instruções) e detalhes de estratégia estão disponíveis neste post em nosso Blog MQL5: Clique aqui. Contato
Autor
SAYADI ACHREF, engenheiro de software fintech e fundador da Finansya.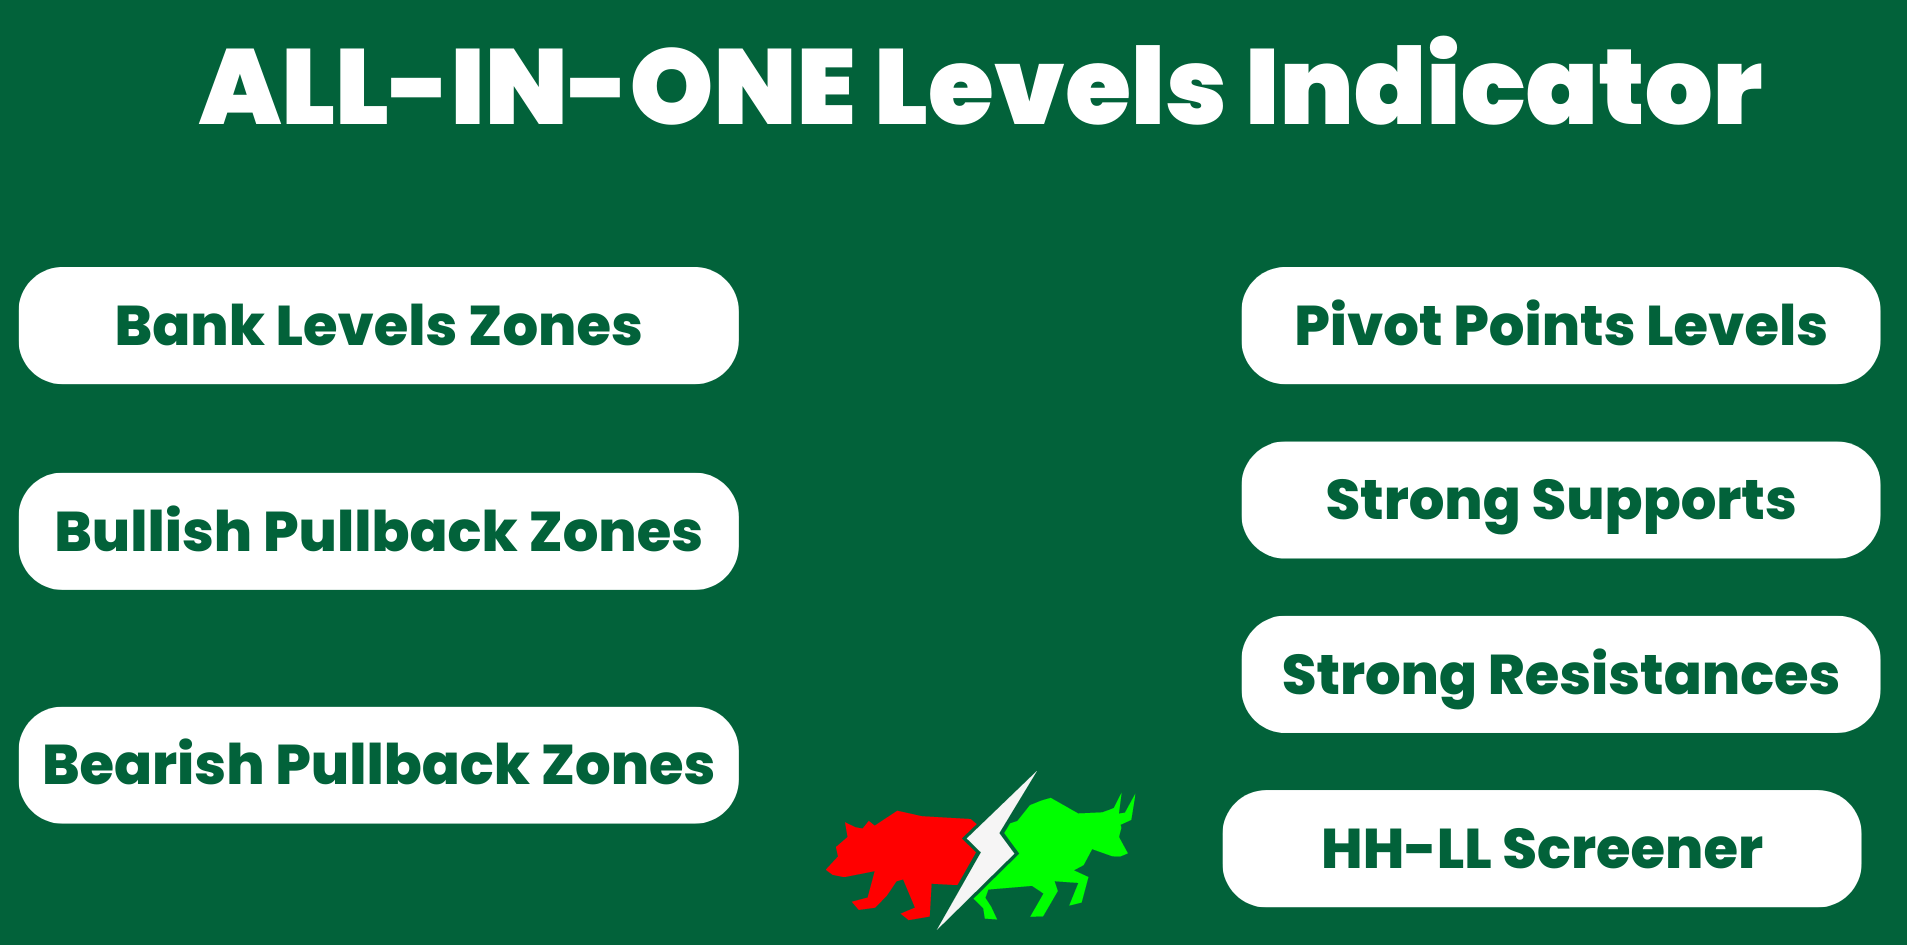


Hello, I´m facing some issues. The Indicator removes himself from the chart? Can you help me with this issue. With kind regards.