• 概要
  • レビュー (24)
  • コメント (66)
  • 最新情報

Support and Resistance Screener Pro MT5

4.75

サポートとレジスタンススクリーナーは、1つのインジケーター内に複数のツールを提供するMetaTraderの1つのレベルインジケーターにあります。 利用可能なツールは次のとおりです。

1.市場構造スクリーナー。

2.強気のプルバックゾーン。

3.弱気プルバックゾーン。

4.デイリーピボットポイント

5.毎週のピボットポイント

6.毎月のピボットポイント

7.ハーモニックパターンとボリュームに基づく強力なサポートとレジスタンス。

8.銀行レベルのゾーン。

期間限定オファー:HVサポートおよびレジスタンスインジケーターは、50ドルと生涯でのみご利用いただけます。 (元の価格125 $)
MQL5ブログにアクセスすると、分析例を含むすべてのプレミアム指標を見つけることができます。ここをクリックしてください。


主な機能

  • ハーモニックおよびボリュームアルゴリズムに基づく強力なサポートおよびレジスタンスゾーン。
  • ハーモニックおよびボリュームアルゴリズムに基づく強気および弱気のプルバックゾーン。
  •  市場構造スクリーナー
  • 毎日、毎週、毎月のピボットポイント。


ドキュメント

すべてのサポートおよびレジスタンススクリーナーのドキュメント(手順)と戦略の詳細は、MQL5ブログのこの投稿で入手できます:ここをクリックしてください。


コンタクト

ご不明な点がある場合やサポートが必要な場合は、プライベートメッセージでご連絡ください。


著者

SAYADI ACHREF、フィンテックソフトウェアエンジニアおよびFinansyaの創設者。 
レビュー 24
USD Down
59
USD Down 2024.12.04 13:19 
 

this tool is very important to calculate the risk and using the lot calculator, you can get a good combination of support and resistance level in addition to calculating the risk, the cost is nothing compared to the advantage of having such as a tool in hands, the costumer service is very comprehensive and answerring the questions in clear and precise manner, i recommand this tool for all traders with the lot and size calculator you will never be in hasardous situation due to non calculated open positions .

Nice Trader OÜ
2327
Aller Uja 2024.12.01 17:53 
 

a good tool if you learn to use it

Clinton Van
118
Clinton Van 2024.09.25 15:43 
 

I love both indicators Trend screener Pro and Support and Resistance Screener Pro but you can't use them blindly. You need to understand market structure. I always try to trade a strong currency versus a weaker one. I then trade with the trend after price makes corrections. The Support and resistance indicator helps see how close price is from support or resistance. On uptrend I buy at support levels and downtrend I buy at resistance levels of price corrections. Together these indicators is all you need to make informed decisions. I do my analysis on the 1H time Frame and then I enter my trades using the 1min or 5min time frames. Thanks for these indicators. They really safe me allot of time.

おすすめのプロダクト
Laguerre SuperTrend Clouds   adds an Adaptive Laguerre averaging algorithm and alerts to the widely popular SuperTrend indicator. As the name suggests,   Laguerre SuperTrend Clouds (LSC)   is a trending indicator which works best in trendy (not choppy) markets. The SuperTrend is an extremely popular indicator for intraday and daily trading, and can be used on any timeframe. Incorporating Laguerre's equation to this can facilitate more robust trend detection and smoother filters. The LSC uses the
Noize Absorption Index - is the manual trading system that measures the difference of pressure between bears forces and bulls forces. Green line - is a noize free index that showing curent situation. Zero value of index shows totally choppy/flat market.Values above zero level shows how powerfull bullish wave is and values below zero measures bearish forces.Up arrow appears on bearish market when it's ready to reverse, dn arrow appears on weak bullish market, as a result of reverse expectation.
An indicator of pattern #31 ("Long Island") from Encyclopedia of Chart Patterns by Thomas N. Bulkowski. The second gap is in the opposite direction. Parameters: Alerts - show alert when an arrow appears   Push - send a push notification when an arrow appears (requires configuration in the terminal) GapSize - minimum gap size in points ArrowType - a symbol from 1 to 17 ArrowVShift - vertical shift of arrows in points   ShowLevels - show levels ColUp - color of an upward line ColDn - color of a d
Trading Utility for Forex Currency Pairs Only not for Gold  Functions Auto Lot Calculation based on Risk Auto stoploss  Auto TakeProfit Breakeven Auto Close Half % Close in percentage with respect to the PIPs Pending Orders BuyLimit Sell Limit with distances BuyStop Sell Stop    with distances Trading Informations Risk in percentage For Multiple trades Combine Takeprofit and Combine Stoplosses
[ MT4 Version ] Supply and Demand Multitimeframe Supply and Demand Multitimeframe is the first indicator in the market that combines multiple aspects like trading volume, price structure and momentum to identify Supply and Demand zones for every asset. The Supply and Demand indicator analyzes simultaneously up to 4 different TFs and represents their information in the current graph. Its interactive UI highlights everytime the price enters a Supply or Demand zone even if the zones are not visible
US30NinjaMT5
Satyaseelan Shankarananda Moodley
US30 Ninja is a 5 minute scalping indicator that will let know you when there is a trade set up (buy or sell). Once the indicator gives the trade direction, you can open a trade and use a 30 pip stop loss and a 30 pip to 50 pip take profit. Please trade at own own risk. This indicator has been created solely for the US30 market and may not yield positive results on any other pair. 
Volality Index scalper indicator  Meant for Volality pairs such as Volality 10, 25, 50, 75 and 100 The indicator works on all timeframes from the 1 minute to the monthly timeframe the indicator is non repaint the indicator has 3 entry settings 1 color change on zero cross 2 color change on slope change 3 color change on signal line cross Orange line is your sell signal Blue line is your buy signal.
Welcome to the Ultimate Harmonic Patterns recognition indicator that is focused to detect advanced patterns. The Gartley pattern, Bat pattern, and Cypher pattern  are popular technical analysis tools used by traders to identify potential reversal points in the market. Our Ultimate Harmonic Patterns recognition Indicator is a powerful tool that uses advanced algorithms to scan the markets and identify these patterns in real-time. With our Ultimate Harmonic Patterns recognition Indicator, you ca
MT4版  |  FAQ Owl Smart Levels Indicator は、 Bill Williams の高度なフラクタル、市場の正しい波構造を構築する Valable ZigZag、エントリの正確なレベルをマークする Fibonacci レベルなどの一般的な市場分析ツールを含む 1 つのインジケーター内の完全な取引システムです。 利益を得るために市場と場所に。 戦略の詳細な説明 インジケータを操作するための指示 顧問-取引助手 プライベートユーザーチャット ->購入後に私に書いて、私はプライベートチャットにあなたを追加し、あなたはそこにすべてのボーナスをダウンロードすることができます 力はシンプルさにあります! Owl Smart Levels 取引システムは非常に使いやすいので、専門家にも、市場を勉強し始めて自分で取引戦略を選択し始めたばかりの人にも適しています。 戦略と指標に秘密の数式や計算方法が隠されているわけではなく、すべての戦略指標は公開されています。 Owl Smart Levels を使用すると、取引を開始するためのシグナルをすばやく確認し、注文を出すための
You can change the time period of the chart at the touch of a button. You can also change multiple charts at the touch of a button. You can also change multiple charts at the touch of a button,   saving you the trouble of changing time periods. We are live-streaming the actual operation of the system. Please check for yourself if it is usable. Please check it out for yourself. https://www.youtube.com/@ganesha_forex We do not guarantee your investment results. Investments should be made at you
Advanced Trading Chaos  The main purpose of the indicator is to help the trader detect the signals described by Bill Williams in his books to make a quick and correct trading decision. 1)Bullish/Bearish Reversal Bar(BDB) 2) Divergent Bar(DB) 3) Second Sage Signal — the third consecutive Awesome Oscillator bar  4) Working fractals (Fractals that worked above/below the red forehead  5) Three bar coloring modes  5.1) Coloring of bars according to the AO indicator (Including the squatting bar)  5.2
Average True Daily Range is an indicator that displays support and resistance zones based on the average daily price range. It is used to determine the intraday trading space and risk-return ratio. It needs to be traded in conjunction with other indicators to determine the direction. This indicator is used for intraday trading, so the indicator is only displayed on D1 below periods. If you are interested in day trading based on trend trading, you can use my other indicator " magic finger "
FREE
チャートオーバーレイ インジケーターは、同じチャートで複数の商品の価格アクションを表示し、通貨ペアが互いにどのように変動するかを評価できます。 [ インストールガイド | 更新ガイド | トラブルシューティング | よくある質問 | すべての製品 ] 買われ過ぎまたは売られ過ぎの通貨ペアを簡単に見つける 同じチャートに最大6つの通貨ペアを重ねてプロット 必要に応じて反転記号を表示する チャートのサイズ、ズーム、時間枠に適応 自動価格レベル計算 カスタマイズ可能な価格レベル密度 カスタマイズ可能な色とサイズ 通貨ペアの反転とは何ですか? 通貨ペアの反転とは、取引の主要通貨を反転させた2つの通貨間の為替レートを表示することです。たとえば、EURUSD、GBPUSD、およびUSDJPYを同じオーバーレイチャートにプロットする場合、価格が逆レートを反映するためにUSDJPYを反転することは理にかなっています:JPYUSD。これにより、JPYUSDの価格は、オーバーレイチャートの他の2つのシンボルと正の相関関係で移動し、チャートの学習が容易になります。 インジケーターのテスト このイン
プレミアムレベルは、正しい予測の精度が80%を超える独自の指標です。 この指標は、最高のトレーディングスペシャリストによって2か月以上テストされています。 あなたが他のどこにも見つけられない作者の指標! スクリーンショットから、このツールの正確さを自分で確認できます。 1は、1キャンドルの有効期限を持つバイナリーオプションの取引に最適です。 2はすべての通貨ペア、株式、商品、暗号通貨で機能します 手順: 赤い矢印が表示されたらすぐにダウントレードを開き、青い矢印が表示されたら閉じます。青い矢印の後に開くこともできます。 試してテストしてください!推奨設定はデフォルトです! 日足チャートで最高の精度を示します! インディケータは、2600 Pipsの収益性に対して、約10Pipsという非常に小さなマージンを使用します。
Improved version of the free HMA Trend indicator (for MetaTrader 4) with statistical analysis. HMA Trend is a trend indicator based on the Hull Moving Average (HMA) with two periods. HMA with a slow period identifies the trend, while HMA with a fast period determines the short-term movements and signals in the trend direction. The main differences from the free version: Ability to predict the probability of a trend reversal using analysis of history data. Plotting statistical charts for analyzi
Basic Support and Resistance   インジケータは、テクニカル分析を強化するために必要なソリューションです。このインジケータを使用すると、チャートにサポートレベルとレジスタンスレベルを投影できます/ mt4バージョン 機能 フィボナッチレベルの統合: サポートと抵抗レベルとともにフィボナッチレベルを表示するオプションを使用すると、私たちの指標は市場行動と逆転領域の可能性についてさらに深い洞察を提供します。 パフォーマンスの最適化: 各バーの開口部のみで拡張ラインを更新するオプションを使用すると、インジケータは、サポートレベルと抵抗レベルの精度を犠牲にすることなく最適なパフォーマンスを保証します。 入力 メイン設定 Timeframe:  この入力を通じて、より高い時間枠のサポートラインとレジスタンスラインをチャート上に表示することを選択できます。 Support/Resistance Strength [Number of Bars]:   この入力を使用して、サポートと抵抗の強度を決定できます。数が高いほど、サポート/抵抗がより強くなります。 Pric
An indicator of pattern #30 ("Island Reversal") from Encyclopedia of Chart Patterns by Thomas N. Bulkowski (two gaps, the second gap is in the direction of the first one). Parameters: Alerts - show alert when an arrow appears   Push - send a push notification when an arrow appears (requires configuration in the terminal) GapSize - minimum gap size in points ArrowType - a symbol from 1 to 17 ArrowVShift - vertical shift of arrows in pixels ShowLevels - show levels ColUp - color of an upward line
The   Supply and Demand Zones indicator   is one of the best tools we have ever made. This great tool automatically draws supply and demand zones, the best places for opening and closing positions. It has many advanced features such as multi timeframe zones support, displaying the width of zones, alert notifications for retouched zones, and much more. Because of market fractality, this indicator can be used for any kind of trading. Whether you are a positional, swing, or intraday trader does no
This indicator studies price action as an aggregation of price and time vectors, and uses the average vector to determine the direction and strength of the market. This indicator highlights the short-term directionality and strength of the market, and can be used to capitalize from short-term price movements by trading breakouts or binary options   [ Installation Guide | Update Guide | Troubleshooting | FAQ | All Products ] Find market direction easily Confirm with breakouts or other indicators
Fibo Daily Channel Indicator The  Indicator is a powerful tool for traders, providing precise daily support and resistance levels based on Fibonacci retracement and extension calculations. This indicator automatically draws key pivot points (PP, R1, R2, S1, S2) as well as additional extension levels (R3, R4, S3, S4), helping traders identify potential reversal and breakout zones with ease. It includes customizable alerts and push notifications, allowing traders to receive updates whenever the pr
Pipfinite creates unique, high quality and affordable trading tools. Our tools may or may not work for you, so we strongly suggest to try the Demo Version for MT4 first. Please test the indicator prior to purchasing to determine if it works for you. We want your good reviews, so hurry up and test it for free...we hope you will find it useful. Combo Energy Beam with Swing Control Strategy: Confirm swing pullback signals Watch Video: (Click Here) Energy Beam with Trend Laser Strategy: Confirm Tre
Swing Points
Usiola Oluwadamilol Olagundoye
Swing Points Indicator for MetaTrader 5 The **Swing Points Indicator** is a custom-built technical tool designed for MetaTrader 5 (MT5), primarily used for identifying crucial reversal points in price action. By plotting swing highs and swing lows, it highlights potential trend reversals, making it a valuable tool for traders relying on price action analysis. This indicator helps traders anticipate changes in market direction by visually marking significant turning points on the chart. Main F
Magic sl NASDAQ 100
Benyamin Naser Mokhtari Karchegani
The indicator now at your disposal is undoubtedly one of the best tools for trading in the NASDAQ 100 market, especially in the 1-minute and 5-minute timeframes. This indicator is meticulously designed for high precision and can be adjusted for other timeframes as well. Simply run it and receive good exit signals. Key Features: Specialized performance in the 1-minute and 5-minute timeframes: While this indicator works in other timeframes as well, its primary focus is on these two timeframes. Co
After working during many months, with the help of Neural Networks, we have perfected the ultimate tool you are going to need for identifying key price levels (Supports and Resistances) and Supply and Demand zones. Perfectly suitable to trigger your trades, set up your future actions, decide your Take Profit and Stop Loss levels, and confirm the market direction. Price will always move between those levels, bouncing or breaking; from one zone to another, all the remaining movements are just mark
ブームおよびクラッシュスパイク検出器インジケーターは、主に価格のブームおよびクラッシュを検出するための高度な戦略に基づいてコーディングされています。 価格の高確率のブームとクラッシュを検出するために、複雑なアルゴリズムが組み込まれました。 ブームまたはクラッシュフェーズの可能性について警告します。 ブームフェーズ:価格の上昇が速すぎる場合。 クラッシュフェーズ:価格の低下が速すぎる場合。 期間限定オファー:インジケーターは30ドルと生涯でのみご利用いただけます。 主な機能 プッシュ通知を携帯電話に送信します コンピューターまたはラップトップでポップアップしてアラートを鳴らします 再描画されない矢印を表示します(潜在的なブームの場合は上向きの矢印、潜在的なクラッシュの場合は下向きの矢印) すべてのペアでの作業。 おすすめ 時間枠:H1およびH4 ペアの推奨:トレンドフェーズのペア。 コンタクト ご不明な点がある場合やサポートが必要な場合は、プライベートメッセージでご連絡ください。 著者 SAYADI ACHREF、fintechソフトウェアエンジニアおよびFinansyaの
Visual Range Indicator MT5
AL MOOSAWI ABDULLAH JAFFER BAQER
Explore the Power of Precision with the Range Indicator! This cutting-edge indicator is designed to provide traders with a detailed analysis of market range movements. However, it is essential to note that the Visual Range Indicator is not optimized—it has been crafted for you to tailor it to your trading needs and optimize it for your unique strategy. Your mastery and customization will unlock its true potential! The Strategy Behind the Range Indicator The Visual Range Indicator focuse
VWAP Trend
Driller Capital Management UG
親愛なるトレーダーの皆様、ようこそ! こちらでは、 Volume Weighted Average Price (VWAP) インディケーターを購入できます。このインディケーターは、簡単に操作できるようにプログラムされています。チャートにドラッグ&ドロップするだけで、残りはアルゴリズムが自動で処理します。 選択した時間枠に基づいて、ボリューム加重平均価格ラインが自動的に計算されます。私たちのインディケーターは、他のVWAPインディケーターとは異なり、D1、W1、MN1よりも小さな時間枠での計算も可能です。したがって、インディケーターはインターデイ取引にも最適です。 平均値に加えて、上下の偏差も計算されます。私たちがすでに設定した適切な設定を使用すれば、スウィングを識別することができます。 VWAPの正確な計算方法については、こちらで確認できます: https ://www.mql5 .com /de /blogs /post /760276 ご質問やご提案がありましたら、いつでもお気軽にお問い合わせください!できるだけ早くお答えします。 Happy Pips!
Awesome Oscillator by Bill Williams with the ability to fine-tune and replace the averaging algorithms of the indicator, which significantly expands the possibilities of using this oscillator in algorithmic trading and brings it closer in its properties to such an indicator as the MACD. To reduce price noise, the final indicator is processed with an additional Smooth averaging. The indicator has the ability to give alerts, send mail messages and push signals when the direction of movement of th
これは、価格ラベル付きのAdvanced ZigZagDynamic および/または ExtendedFractals インジケーターの極値に基づくサポートおよびレジスタンスレベルのMTFインジケーターです(無効にすることができます)。 MTFモードでは、より高いTFを選択できます。デフォルトでは、レベルはZigZagインジケータードットに基づいて生成されます。フラクタルインジケータードットは、ZigZagと一緒に、またはその代わりに使用することもできます。使用を簡素化し、CPU時間を節約するために、計算はバーの開口部ごとに1回実行されます。 パラメーター: ForcedTF-レベル計算のチャート時間枠(現在の時間枠と等しいか、それを超える場合があります) MinPipsLevelWidth-ポイント単位の最小レベル幅(非常にタイトなレベルに使用) Use ZigZag Extremums points -ZigZagピークを使用してサポート/抵抗レベルを計算することを有効/無効にします Fixed pips range -ジグザグインジケーターを計算するための最小値と最大値の間の距離
Snipeer2
Ignacio Agustin Mene Franco
Sniper2 , It has points of lines, with colors that are showing you an entrance, that work as support and resistance! green dotted lines green shows entry for sale, the red dotted lines show a buy entry, pay attention to the supports that work as a break to catch long candles in a longer period of time. works for forex all pairs works for synthetic indices all pairs ! indicator on sale!
このプロダクトを購入した人は以下も購入しています
Quantum TrendPulse を ご紹介します。これは、   SuperTrend   、   RSI   、および Stochastic のパワーを 1 つの包括的なインジケーターに組み合わせて、取引の可能性を最大限に引き出す究極の取引ツールです。精度と効率を求めるトレーダー向けに設計されたこのインジケーターは、市場のトレンド、勢いの変化、最適なエントリー ポイントとエグジット ポイントを自信を持って特定するのに役立ちます。 主な特徴: SuperTrend 統合: 現在の市場動向に簡単に追従し、収益性の波に乗ることができます。 RSI精度: 買われすぎと売られすぎのレベルを検出し、市場の反転のタイミングに最適で、SuperTrendのフィルターとして使用されます。 確率的精度: 確率的振動を活用して、変動の激しい市場で隠れたチャンスを見つけます。SuperTrend のフィルターとして使用されます。 マルチタイムフレーム分析:   M5 から H1 または H4 まで、さまざまなタイムフレームで市場を常に把握します。 カスタマイズ可能なアラート: カスタム取引条件が満たされ
TPSpro TREND PRO は 、市場を自動的に分析し、トレンドとその各変化に関する情報を提供し、再描画せずに取引にエントリーするためのシグナルを提供するトレンド指標です。 インジケーターは各ローソク足を使用し、個別に分析します。上向きまたは下向きのさまざまな衝撃を指します。通貨、仮想通貨、金属、株、指数の取引への正確なエントリーポイント! バージョンMT5                   インジケーターの完全な説明     RFI LEVELS インジケーター と併用することをお勧めします。 主な機能: レンダリングなしで正確な入力信号! シグナルが表示されると、それは関連性を維持します。これは、シグナルを提供してからそれを変更し、その結果、入金された資金が失われる可能性があるリドローインジケーターとの重要な違いです。より高い確率と精度で市場に参入できるようになりました。矢印が表示された後、ターゲットに到達する (利益確定) か反転シグナルが表示されるまで、ローソク足に色を付ける機能もあります。 STOP-LOSS/TAKE-PROFITゾーンの表示 エントリーポイントを
これはMT5のインジケーターで、再描画なしで取引に参入するための正確なシグナルを提供します。 外国為替、暗号通貨、金属、株式、インデックスなど、あらゆる金融資産に適用できます。かなり正確な見積もりを提供し、取引を開始して終了するのに最適な時期を教えてくれます。1つのシグナルを処理しただけでインジケーターの元が取れた例の 動画 (6:22)をご覧ください。Entry PointsPro インジケーターの助けを借りたほとんどのトレーダーの最初の1週間の結果が改善しています。 Telegramグループ に登録してください。Entry Points Proインジケーターのメリットは次の通りです。 再描画のないエントリーシグナル 再描画されるインジケーターでは一度表示されたシグナルが削除されて大きな金銭的損失につながることがありますが、これと異なり、表示されて確認されたシグナルは消えることがありません。 エラーなしの取引開始 インジケーターアルゴリズムによって取引を開始する(資産を売買する)理想的な瞬間を見つけることができます。それを使用するすべてのトレーダーの成功率が向上します。 あら
指示する     ロシア     -        utilizar con   el indicador の ESP 推奨事項 -   TPSpro トレンド プロフェッショナル版 -   MT5のバージョン 最も重要なことは、将来においても最も重要なことです。 機能のプリンシパル: ゾーンのほとんどは、ベンダーとコンプラドールによってアクティブ化されます。 状況を直感的に把握できるよう、初期の衝動を修正します。 LOGIC AI: MUESTRA zonas (círculos) parabuscar puntos de entrada cuando se activa una plantilla 視覚的に優れた視覚効果があり、最も重要な機能がすべて揃っていることに注意してください。 優れたニベレス/ゾーンの視覚化 (modo MTF) 世界で最も人気のある場所/ゾーンです。これを使用するのに最適な方法です (   TPSproTREND PRO   )。 アルゴリズム プロフェッショナル セパラド パソ ア パソ パラ オペラ それは、オペラハウスやコントラ・デ・エラの指導におい
Golden Trend Indicator MT5
Noha Mohamed Fathy Younes Badr
4.86 (14)
Golden Trend indicator  is The best indicator for predicting trend movement this indicator never lags and never repaints and never back paints    and give  arrow buy and sell    before the candle appear  and it will help you and  will make your trading decisions clearer its work on all currencies and  gold and crypto and all time frame This unique  indicator uses very secret algorithms to catch the  trends, so you can trade using this indicator and see the trend clear on charts  manual guide and
FX Volume MT5
Daniel Stein
4.93 (14)
FX Volume:ブローカー視点で捉える本物の市場センチメント クイック概要 トレード手法をさらに高めたいとお考えですか? FX Volume は、リテールトレーダーやブローカーのポジション状況をリアルタイムで提供します。これは、COTのような遅延レポートよりもはるかに早く知ることができます。安定した利益を目指す方も、さらなる優位性を求める方も、 FX Volume は大きな不均衡を見極め、ブレイクアウトを確認し、リスク管理を洗練させるのに役立ちます。今すぐ始めて、実際の出来高データがどのように意思決定を変革するかを体感してください! 1. FX Volume がトレーダーにとって非常に有益な理由 高精度の早期警戒シグナル • 各通貨ペアを売買しているトレーダー数を、他者よりも早く、ほぼリアルタイムで把握できます。 • FX Volume は、複数のリテールブローカーから得られる本物の出来高データを収集し、分かりやすい形式で提供する 唯一 のツールです。 強力なリスク管理 • ロングやショートの大きな偏り(インバランス)を特定し、潜在的なトレンド転換を見逃しません。ストップ
まず第一に、このトレーディングシステムがノンリペイント、ノンリドロー、ノンラグのインジケーターであることを強調する価値がある。これにより、手動取引とロボット取引の両方に理想的なものになっています。 オンラインコース、マニュアル、プリセットのダウンロード。 「スマートトレンドトレーディングシステム MT5」は、新規および経験豊富なトレーダー向けにカスタマイズされた包括的なトレーディングソリューションです。10以上のプレミアムインジケーターを組み合わせ、7つ以上の堅実なトレーディング戦略を備えており、多様な市場状況に対応する多目的な選択肢となっています。 トレンドフォロー戦略:トレンドを効果的に乗り越えるための正確なエントリーとストップロス管理を提供します。 リバーサル戦略:潜在的なトレンドの反転を特定し、トレーダーがレンジ相場を活用できるようにします。 スキャルピング戦略:高速で正確なデイトレードおよび短期取引のために設計されています。 安定性:すべてのインジケーターはノンリペイント、ノンリドロー、ノンラグであり、信頼性の高いシグナルを保証します。 カスタマイズ:個々の取引の嗜好に合わせ
FX Levels: あらゆる市場における非常に高精度なサポート&レジスタンス 概要 通貨ペア、株式指数、個別銘柄やコモディティなど、どのような市場でも信頼できるサポートとレジスタンスを特定したいですか? FX Levels は伝統的な “Lighthouse” メソッドと先進的な動的アプローチを融合し、ほぼ汎用的な精度を実現します。ブローカーの実務経験を活かし、自動化されたデイリー更新とリアルタイム更新を組み合わせることで、 FX Levels は反転ポイントを見つけ、利益目標を設定し、自信をもってトレードを管理するための手助けをします。今すぐ試してみて、サポート/レジスタンス分析の正確性がどれほどトレードを向上させるかを実感してください! 1. FX Levels がトレーダーにとって非常に有用な理由 非常に正確なサポート&レジスタンスゾーン • FX Levels は異なるブローカー環境でもほぼ同一のゾーンを生成するよう設計されており、データフィードの差異や時刻設定のずれによる不一致を解消します。 • つまり、どのブローカーを利用していても一貫したレベルが得られるため、戦
FX Power: 通貨の強弱を分析して、より賢い取引を実現 概要 FX Power は主要通貨と金の実際の強弱をあらゆる市場状況で理解するための必須ツールです。強い通貨を買い、弱い通貨を売ることで、 FX Power は取引の意思決定を簡素化し、高い確率の取引機会を見出します。トレンドを追従する場合でも、極端なデルタ値を使用して反転を予測する場合でも、このツールはあなたの取引スタイルに完全に適応します。ただ取引するだけではなく、 FX Power で賢く取引をしましょう。 1. なぜ FX Power がトレーダーにとって非常に有益なのか 通貨と金のリアルタイム強弱分析 • FX Power は主要通貨と金の相対的な強弱を計算し、マーケットダイナミクスに関する明確な洞察を提供します。 • どの資産がリードしているか、または後れを取っているかを監視して、取引するペアを賢く選びましょう。 マルチタイムフレームの包括的なビュー • 短期、中期、長期のタイムフレームで通貨と金の強弱を追跡し、マーケットトレンドに基づいて取引戦略を調整できます。 • スキャルピングからスイングトレード
Enjoy a   50% OFF   Christmas holiday sale!   After your purchase, feel free to contact me for more details on how to receive a bonus indicator called VFI, which pairs perfectly with Easy Breakout for enhanced confluence!     Easy Breakout MT5   is a powerful price action trading system built on one of the most popular and widely trusted strategies among traders: the   Breakout strategy ! This indicator delivers crystal-clear Buy and Sell signals based on breakouts from key support and resis
!SPECIAL SALE!  The Trend Forecaster indicator utilizes a unique proprietary algorithm to determine entry points for a breakout trading strategy. The indicator identifies price clusters, analyzes price movement near levels, and provides a signal when the price breaks through a level. The Trend Forecaster indicator is suitable for all financial assets, including currencies (Forex), metals, stocks, indices, and cryptocurrencies. You can also adjust the indicator to work on any time frames, althoug
-   Real price is 80$   - 25% Discount ( It is 59$ now ) Contact me for instruction, any questions! Related Product:  Gold Trade Expert MT5 Introduction The breakout and retest strategy is traded support and resistance levels. it involves price breaking through a previous level.  The break and retest strategy is designed to help traders do two main things, the first is to avoid false breakouts. Many false breakouts start with a candlestick that breaks out of a level but ends with an immediate c
Gold Trend - これは優れた株価テクニカル指標です。指標のアルゴリズムは、資産の値動きを分析し、ボラティリティと潜在的なエントリーゾーンを反映しています。 最高の指標シグナル: - 売りの場合 = 赤のヒストグラム + 赤のショートポインター + 同じ方向に黄色のシグナル矢印。 - 買いの場合 = 青のヒストグラム + 青のロングポインター + 同じ方向の水色のシグナル矢印。 インジケータの利点 1. このインディケータは、高い精度でシグナルを発信します。 2. 確定した矢印シグナルは、トレンドが変化したときにのみ再描画されます。 3. どのブローカーのMetaTrader 5取引プラットフォームでも取引できます。 4. あらゆる資産(通貨、金属、暗号通貨、株式、指数など)を取引できます。 5. H1タイムフレーム(中期取引)で取引するのがよい。 6. 各トレーダーがインディケータを自分用に簡単にカスタマイズできるよう、インディケータ設定で個々のパラメータ(TF、色など)を変更できます。 7. このインディケータは、トレーディングシステムの優れたメイン機能として
ご紹介     Quantum Breakout PRO は 、ブレイクアウト ゾーンの取引方法を変革する画期的な MQL5 インジケーターです。 13年以上の取引経験を持つ経験豊富なトレーダーのチームによって開発されました。     クォンタム ブレイクアウト プロ   は、革新的でダイナミックなブレイクアウト ゾーン戦略により、あなたのトレーディングの旅を新たな高みに押し上げるように設計されています。 クォンタム ブレイクアウト インジケーターは、5 つの利益ターゲット ゾーンを備えたブレイクアウト ゾーン上のシグナル矢印と、ブレイクアウト ボックスに基づいたストップロスの提案を提供します。 初心者トレーダーにもプロのトレーダーにも適しています。 量子EAチャネル:       ここをクリック 重要!購入後、インストールマニュアルを受け取るためにプライベートメッセージを送ってください。 推奨事項: 時間枠: M15 通貨ペア: GBPJPY、EURJPY、USDJPY、NZDUSD、XAUUSD アカウントの種類: ECN、Raw、またはスプレッドが非常に低い R
Was: $249  Now: $149   Market Profile defines a number of day types that can help the trader to determine market behaviour. A key feature is the Value Area, representing the range of price action where 70% of trading took place. Understanding the Value Area can give traders valuable insight into market direction and establish the higher odds trade. It is an excellent addition to any system you may be using. Inspired by Jim Dalton’s book “Mind Over Markets”, this indicator is designed to suit the
Matrix Arrow Indicator MT5
Juvenille Emperor Limited
5 (13)
マトリックスアローインジケーターMT5は、すべてのシンボル/商品(外国為替、商品、暗号通貨、インデックス、株式)で使用できる100%再描画されていないマルチタイムフレームインジケーターに続くユニークな10in1トレンドです。マトリックスアローインジケーターMT5は、初期段階で現在のトレンドを判断し、最大10の標準インジケーターから情報とデータを収集します。 平均方向移動指数(ADX) 商品チャネルインデックス(CCI) クラシック平研アシキャンドル 移動平均 移動平均収束発散(MACD) 相対活力指数(RVI) 相対力指数(RSI) 放物線SAR ストキャスティクス ウィリアムズのパーセント範囲 すべてのインジケーターが有効な買いまたは売りシグナルを与えると、対応する矢印がチャートに印刷され、次のろうそく/バーの開始時に強い上昇トレンド/下降トレンドを示します。ユーザーは、使用するインジケーターを選択し、各インジケーターのパラメーターを個別に調整できます。マトリックスアローインジケーターMT5は選択されたインディケーターからのみ情報を収集し、それらのデータのみに基づいてアローを印刷
今、147ドル(いくつかの更新後に499ドルに増加します) - 無制限のアカウント(PCSまたはMac) RelicusRoad ユーザー マニュアル + トレーニング ビデオ + プライベート Discord グループへのアクセス + VIP ステータス 市場の新しい見方 RelicusRoad は、外国為替、先物、暗号通貨、株式、および指数の世界で最も強力な取引インジケーターであり、トレーダーに収益を維持するために必要なすべての情報とツールを提供します。初心者から上級者まで、すべてのトレーダーが成功するためのテクニカル分析と取引計画を提供します。これは、将来の市場を予測するのに十分な情報を提供する重要な取引指標です。意味をなさないチャート上のいくつかの異なる指標ではなく、完全な解決策を信じています.これは、信号、矢印 + 価格アクション情報を表示するオールインワンのインジケーターで、他に類を見ない非常に正確です。 強力な AI に基づいて、RelicusRoad は不足している情報とツールを提供して、あなたを教育し、トレーディングのプロ、成功したトレーダーにします。 ほと
Atbot
Zaha Feiz
4.76 (45)
AtBot: どのように機能し、どのように使用するか ### どのように機能するか MT5プラットフォーム用の「AtBot」インジケーターは、テクニカル分析ツールの組み合わせを使用して売買シグナルを生成します。単純移動平均(SMA)、指数移動平均(EMA)、および平均真実範囲(ATR)インデックスを統合して取引機会を特定します。さらに、Heikin Ashiキャンドルを使用してシグナルの精度を向上させることもできます。 購入後にレビューを残すと、特別なボーナスギフトを受け取ります。 ### 主な機能: - 再描画なし: シグナルはプロット後に変更されません。 - 再描画なし: シグナルは一貫しており、変更されません。 - 遅延なし: 遅延なくタイムリーなシグナルを提供します。 - 多様な時間枠: あらゆる時間枠で使用可能で、取引戦略に合わせることができます。 ### 操作手順: #### 入力と設定: - firstkey (TrendValue): トレンド検出の感度を調整します。 - Secondkey (SignalValue): 売買シグナル生成の感度を定義します。 - ma
このダッシュボードは、選択されたシンボルの最新の利用可能なハーモニックパターンを表示するので、時間を節約し、より効率的に /   MT4バージョン 。 無料インジケーター:   Basic Harmonic Pattern インジケーター列 Symbol : 選択したシンボルが表示されます。 Trend :   強気または弱気 Pattern : パターンの種類(ガートレー、バタフライ、バット、カニ、サメ、サイファー、ABCD) Entry : エントリー価格 SL: ストップロス価格 TP1: 1回目の利食い価格 TP2: 2回目の利食い価格 TP3:   3回目の利食い価格 Current price :   現在値 Age (in bars):    最後に描画されたパターンの年齢 主な入力項目 Symbols:   "28 Major Currency Pairs "または "Selected Symbols "から選択。 Selected Symbols:   カンマで区切られた監視したいシンボル("EURUSD,GBPUSD,XAUUSD")。ブローカーがペアに接
まず第一に、この取引インジケーターは再描画されず、再描画されず、遅延しないことを強調する価値があります。これにより、手動取引とロボット取引の両方に理想的なものになります。 ユーザーマニュアル:設定、入力、戦略。 アトミックアナリストは、価格の強さとモメンタムを利用して市場でより良いエッジを見つけるためのPA価格アクションインジケーターです。ノイズや誤ったシグナルを除去し、取引ポテンシャルを高めるための高度なフィルターを備えています。複雑なインジケーターの複数のレイヤーを使用して、アトミックアナリストはチャートをスキャンし、複雑な数学的計算をシンプルなシグナルと色に変換します。これにより、どのような初心者トレーダーでも理解して使用し、一貫した取引の決定を行うことができます。 「アトミックアナリスト」は、新規および経験豊富なトレーダー向けにカスタマイズされた包括的な取引ソリューションです。プレミアムインジケーターとトップノッチの機能を1つの取引戦略に組み合わせ、すべてのタイプのトレーダーにとって汎用性のある選択肢にします。 デイリートレーディングとスキャルピング戦略:高速で正確なデイ
トレンド検出インジケーターはあらゆる戦略を補完し、独立したツールとしても使用できます。 インジケーターの操作に関する推奨事項、コメント   #8   でダウンロードできます 利点 使いやすく、不要な情報でチャートを過負荷にしません。 あらゆる戦略のフィルターとして使用できます。 利益を得るのとストップロスを設定するの両方に使用できる動的なサポートとレジスタンスのレベルが組み込まれています。 ローソク足が閉じた後、インジケーターの色は変わりません。  株式市場、指数、石油、金、およびすべての時間枠で機能します。 トースト通知、電子メール通知、プッシュ通知、サウンドアラートの機能があります。 私の他の開発はここで見つけることができます: https://www.mql5.com/ja/users/mechanic/seller 入力パラメータ Alert-オン/オフ。アラート; Push Notification-オン/オフ。プッシュ通知; Mail-オン/オフ電子メール通知; Fibo 1,2,3,4,5,6,7,11,21,31,41,51,61,71-動的サポートと抵抗レベル
これはほぼ間違いなく、MetaTraderプラットフォームで見つけることができる最も完全な調和価格形成自動認識インジケーターです。 19種類のパターンを検出し、フィボナッチプロジェクションをあなたと同じように真剣に受け止め、潜在的逆転ゾーン(PRZ)を表示し、適切なストップロスとテイクプロフィットレベルを見つけます。 [ インストールガイド | 更新ガイド | トラブルシューティング | よくある質問 | すべての製品 ] 19の異なる調和価格形成を検出します プライマリ、派生および補完フィボナッチ投影(PRZ)をプロットします 過去の価格行動を評価し、過去のすべてのパターンを表示します この指標は、独自の品質とパフォーマンスを分析します 適切なストップロスとテイクプロフィットのレベルを表示します ブレイクアウトを使用して適切な取引を通知します すべてのパターン比をグラフにプロットします 電子メール/音声/視覚アラートを実装します スコット・M・カーニーの本に着想を得て、この指標は最も純粋で急を要するトレーダーのニーズを満たすように設計されています。ただし、トレードを容易にする
Royal Scalping Indicator is an advanced price adaptive indicator designed to generate high-quality trading signals. Built-in multi-timeframe and multi-currency capabilities make it even more powerful to have configurations based on different symbols and timeframes. This indicator is perfect for scalp trades as well as swing trades. Royal Scalping is not just an indicator, but a trading strategy itself. Features Price Adaptive Trend Detector Algorithm Multi-Timeframe and Multi-Currency Trend Low
まず最初に、このトレーディングシステムがリペイントされず、再描画されず、遅延しないことを強調する価値があります。これにより、プロのトレーディングに最適な状態になります。 オンラインコース、ユーザーマニュアル、デモ。 「スマートサポートアンドレジスタンストレーディングシステム」は、新規および経験豊富なトレーダー向けにカスタマイズされた高度なインジケーターです。この包括的なシステムは、7以上の戦略、10のインジケーター、およびデイトレード戦略、スイングトレード戦略、サポートおよびレジスタンス戦略、ローソク足パターン戦略、VWAP戦略、マルチタイムフレームトレンド戦略など、さまざまなトレーディングアプローチを組み合わせています。これは、矢印信号、エントリーポイント、出口ポイント、トレードアラート、より高い時間枠のトレンド分析、リアルタイムのトレードモニタリング、そして洞察力のあるトレンドとボリュームキャンドルの着色を提供します。自動的なサポートとレジスタンスの検出により、さまざまな市況下でトレーダーが的確な決定を下すのを支援する多面的なインジケーターとなっています。 スマートサポートアン
Gold Venamax - これは最高の株式テクニカル指標です。 指標アルゴリズムは資産の価格変動を分析し、ボラティリティと潜在的なエントリーゾーンを反映します。 インジケーターの機能: これは、快適で収益性の高い取引のためのマジックとトレンド矢印の 2 つのブロックを備えたスーパー インジケーターです。 チャート上にブロックを切り替えるための赤いボタンが表示されます。 マジックはインジケーター設定で設定されているため、異なるブロックを表示する 2 つのチャートにインジケーターをインストールできます。 Gold Venamax は、異なる矢印バッファー (GV と SD) を備えた 2 つのチャートに配置できます。 これを行うには、設定で異なる Magic を選択する必要があります。たとえば、あるマジック = 999、別のマジック = 666 を選択します。次に、チャート上の赤いボタンで矢印バッファを選択できます。 入力するのに最適な信号 = 両方のバッファ (GV および SD) の信号矢印 + 3 本すべての MA ライン (赤または青) の方向に従います。 インジケー
Timeframes Trend Scanner is a trend analyzer or trend screener indicator that helps you know the trend in all timeframes of symbol you're watching. This indicator provides clear & detailed analysis results on a beautiful dashboard, let you able to use this result right away without need to do any additional analysis. How it works Step 1: Calculate values of 23 selected & trusted technical indicators (Oscillator & Moving Average indicators) Step 2: Analyze all indicators using best practices to f
Gold Pointer は最高のトレンド・インジケータです。このインジケーターのユニークなアルゴリズムは、テクニカル分析および数学的分析の要素を考慮して資産価格の動きを分析し、最も収益性の高いエントリーポイントを決定し、買いまたは売り注文を発注するシグナルを出します。 最良のインジケーターシグナル: - 売り=赤のトレンドライン+赤のTFインジケーター+同じ方向に黄色のシグナル矢印。 - 買いの場合 = 青のトレンドライン + 青のTFインディケータ + 同じ方向の水色のシグナル矢印。 インジケータの利点 1. このインディケータは、高い精度でシグナルを発信する。 2. 2.シグナル(矢印)を音声(アラート&メッセージ)で確認した後、インジケータの確定シグナルは消えず、再描画されません。 3. どのブローカーのMetaTrader 5取引プラットフォームでも取引できます。 4. あらゆる資産(通貨、金属、暗号通貨、株式、指数など)を取引できます。 5. どのタイムフレームでも取引できます(M5-M15スキャルピングと取引/M30-N1中期取引/H4-D1長期取引)。 6.
The indicator very accurately determines the levels of the possible end of the trend and profit fixing. The method of determining levels is based on the ideas of W.D.Gann, using an algorithm developed by his follower Kirill Borovsky. Extremely high reliability of reaching levels (according to K. Borovsky  - 80-90%) Indispensable for any trading strategy – every trader needs to determine the exit point from the market! Precisely determines targets on any timeframes and any instruments (forex, met
MetaForecast M5
Vahidreza Heidar Gholami
5 (2)
MetaForecastは、価格データのハーモニクスに基づいて、どんな市場の未来を予測し視覚化します。市場が常に予測可能ではありませんが、価格にパターンがある場合、MetaForecastは可能な限り正確な未来を予測できます。他の類似製品と比較して、MetaForecastは市場のトレンドを分析することでより正確な結果を生成することができます。 入力パラメータ Past size (過去のサイズ) MetaForecastが将来の予測を生成するために使用するバーの数を指定します。モデルは選択したバー上に描かれた黄色の線で表されます。 Future size (将来のサイズ) 予測すべき将来のバーの数を指定します。予測された将来は、ピンクの線で表示され、その上に青い回帰線が描かれます。 Degree (程度) この入力は、MetaForecastが市場で行う分析のレベルを決定します。 Degree 説明  0 Degree 0の場合、価格の全てのピークや谷、そして詳細をカバーするために、「Past size」の入力に大きな値を使用することが推奨されています。  1 (推奨) Degre
note: this indicator is for METATRADER4, if you want the version for METATRADER5 this is the link:  https://www.mql5.com/it/market/product/108106 TRENDMAESTRO ver 2.4 TRENDMAESTRO recognizes a new TREND in the bud, he never makes mistakes. The certainty of identifying a new TREND is priceless. DESCRIPTION TRENDMAESTRO identifies a new TREND in the bud, this indicator examines the volatility, volumes and momentum to identify the moment in which there is an explosion of one or more of these data a
作者のその他のプロダクト
トレンド スクリーナー インジケーターでトレンド取引の力を解き放ちます。ファジー ロジックと複数通貨システムを活用した究極のトレンド取引ソリューションです。 ファジー ロジックを活用した革新的なトレンド インジケーターである Trend Screener を使用して、トレンド取引を向上させます。 これは、13 を超えるプレミアム ツールと機能、および 3 つの取引戦略を組み合わせた強力なトレンド追跡インジケーターであり、Metatrader をトレンド アナライザーにする多用途の選択肢となります。 期間限定オファー : トレンド スクリーナー インジケーターは、わずか 100 ドルで生涯ご利用いただけます。 (元の価格 50$ ) (オファー延長) Trend Screener の 100% 非再描画精度の揺るぎない精度を体験して、取引の決定が過去の価格変動の影響を受けないようにしてください。 マルチタイムフレームおよびマルチ通貨機能の多用途性を解放し、比類のない自信を持って外国為替、商品、暗号通貨、インデックスの世界を取引できるようにします。 Trend Screener の包括的な
Trend Screener
STE S.S.COMPANY
4.81 (89)
トレンドインジケーター、1つのツールに組み込まれたすべての重要なトレンド機能を備えたトレンドトレーディングとフィルタリングのための画期的なユニークなソリューション! これは、すべてのシンボル/商品(外国為替、商品、暗号通貨、インデックス、株式)で使用できる100%再描画されていないマルチタイムフレームおよびマルチ通貨インジケーターです。 期間限定オファー: サポートおよびレジスタンス スクリーナー インジケーターは、たった 50 ドルで永久的にご利用いただけます。(元の価格 250 ドル) (オファー延長) トレンドスクリーナーは、チャート内のドットで矢印トレンドシグナルを提供するインジケーターに続く効率的なインジケーターです。 トレンド分析インジケーターで使用できる機能: 1.トレンドスキャナー。 2.最大利益分析を備えたトレンドライン。 3.トレンド通貨強度メーター。 4.アラート付きのトレンド反転ドット。 5.アラート付きの強いトレンドドット。 6.トレンド矢印 毎日の分析例、毎日のシグナルパフォーマンス...など、トレンドスクリーナーインジケーターを使用して、ここで見つけること
トレンドラインマップインジケーターは、トレンドスクリーナーインジケーターのアドオンです。トレンドスクリーナー(トレンドラインシグナル)によって生成されたすべてのシグナルのスキャナーとして機能します。 これは、トレンドスクリーナーインジケーターに基づくトレンドラインスキャナーです。 Trend Screener Pro インジケーターがない場合、Trend Line Map Proは機能しません。 It's a Trend Line Scanner based on Trend Screener Indicator. If you don't have Trend Screener Pro Indicator,     the Trend Line Map Pro will not work . ブログにアクセスすると、トレンドラインマップインジケーターの無料バージョンをダウンロードできます。 Metatrader Testerの制限なしで、購入する前に試してみてください。 :  ここをクリック 1.簡単になる利点 通貨と時間枠に基づいて売買シグナルを表示します。 チャー
サポートとレジスタンススクリーナーは、1つのインジケーター内に複数のツールを提供するMetaTraderの1つのレベルインジケーターにあります。 利用可能なツールは次のとおりです。 1.市場構造スクリーナー。 2.強気のプルバックゾーン。 3.弱気プルバックゾーン。 4.デイリーピボットポイント 5.毎週のピボットポイント 6.毎月のピボットポイント 7.ハーモニックパターンとボリュームに基づく強力なサポートとレジスタンス。 8.銀行レベルのゾーン。 期間限定オファー:HVサポートおよびレジスタンスインジケーターは、50ドルと生涯でのみご利用いただけます。 (元の価格125 $) Metatrader Backtesterの制限なしでインジケーターを試してみませんか? デモ版をダウンロードするには、ここをクリックしてください。 主な機能     ハーモニックおよびボリュームアルゴリズムに基づく強力なサポートおよびレジスタンスゾーン。     ハーモニックおよびボリュームアルゴリズムに基づく強気および弱気のプルバックゾーン。     市場構造スクリーナー     毎日、毎週、毎月の
私たちのサポートまたはレジスタンスレベルは、市場の価格行動が逆転して方向を変え、市場にピークまたはトラフ(スイングポイント)を残したときに形成されます。サポートとレジスタンスのレベルは、取引範囲を切り開くことができます。インジケーターは、インジケーターセットで定義されたバーのX量(期間)に基づいて、スイングハイとスイングローを識別します。 注:価格アクションインジケーターが気に入った場合は、オールインワントレンドインジケーター(トレンドスクリーナー、トレンドライン、ストロングトレンド、トレンドリバーサルシグナルなど)をお試しください。 入手するには、 ここをクリックしてください 主な機能 テクニカル分析の重要な概念は、抵抗またはサポートレベルが破られると、その役割が逆転することです。価格がサポートレベルを下回ると、そのレベルは抵抗力があります。価格が抵抗レベルを超えて上昇した場合、それはしばしばサポートになります。 水平方向のサポートと抵抗のレベルは、これらのレベルの最も基本的なタイプです。それらは単に水平線で識別されます: チャートの緑のレベルは、抵抗レベルです。 チャートの赤
FREE
トレンドラインマップインジケーターは、トレンドスクリーナーインジケーターのアドオンです。トレンドスクリーナー(トレンドラインシグナル)によって生成されたすべてのシグナルのスキャナーとして機能します。 これは、トレンドスクリーナーインジケーターに基づくトレンドラインスキャナーです。 Trend Screener Pro インジケーターがない場合、Trend Line Map Proは機能しません。 ブログにアクセスすると、トレンドラインマップインジケーターの無料バージョンをダウンロードできます。 Metatrader Testerの制限なしで、購入する前に試してみてください。 :    ここをクリック 1.簡単になる利点 通貨と時間枠に基づいて売買シグナルを表示します。 チャートに矢印が表示されてから価格が増減したピップ数を評価します。 (トレンドスクリーナーインジケーター矢印) 信号のタイミングを表示します。 アラートを売買するための複数の時間枠と複数の通貨のアラートを取得します。 2.トレンドラインマップの使用方法 売買シグナルダッシュボードを表示する方法は?
ボラティリティ アナライザーはモメンタム インジケーターであり、タイトな取引範囲での値固め後に価格が大きく上昇する傾向を利用します。このインジケーターは、スクイーズが発火したときの動きの予想される方向を示すために、運動量オシレーターも使用します。このヒストグラムはゼロ ラインの周りで振動し、ゼロ ラインより上のモメンタムの増加はロングを購入する機会を示し、ゼロ ラインを下回るモメンタムはショートの機会を示す可能性があります。 期間限定オファー : インジケーターは、わずか 50 $ で無期限でご利用いただけます。 ( 元の価格 125$ ) 主な機能 横向きトレンド検出器。 低揮発性検出器。 強気の高値と弱気の高値のボラティリティ検出器。 すべての時間枠とすべてのペアで作業します。 ポップアップ アラートとプッシュ通知アラートを提供します。 コンタクト 質問がある場合、またはサポートが必要な場合は、プライベート メッセージでご連絡ください。 警告 すべてのインジケーターとツールは、公式のメタトレーダー ストア (MQL5 マーケット) からのみ入手できます。 プレミア
すべてのトレーダーは、1 回の取引で 5% (または 7%) を超えるリスクを負ってはならないことを知っています。これはマネー管理の法則であり、トレーダーは異なる取引レベルに対して異なるストップロス値を使用する必要があるため、使用可能な LotSize を毎回計算する必要があります。このインディケータは、チャートに配置する瞬間に適切な LotSize を計算し、「ストップ ロス ライン」を任意の方向にドラッグするたびに計算します。 期間限定オファー: すべてのプレミアム インジケーターはわずか 50$ で利用できます。MQL5 ブログにアクセスすると、プレミアム インジケーターのすべての詳細を確認できます。ここをクリック。 入力 MAX_RISK_PER_TRADE - トレーダーがトレードごとにリスクを負うパーセンテージ。 CUSTOM_BALANCE - リスクの計算に使用される金額を定義します。 0 => 電卓は口座残高を使用します。 ENTRY_PRICE_LINE_COLOR - TP (テイクプロフィット) ラインの色 STOP_PRICE_LINE_COLOR-
ブームおよびクラッシュスパイク検出器インジケーターは、主に価格のブームおよびクラッシュを検出するための高度な戦略に基づいてコーディングされています。 価格の高確率のブームとクラッシュを検出するために、複雑なアルゴリズムが組み込まれました。 ブームまたはクラッシュフェーズの可能性について警告します。 ブームフェーズ:価格の上昇が速すぎる場合。 クラッシュフェーズ:価格の低下が速すぎる場合。 期間限定オファー:インジケーターは30ドルと生涯でのみご利用いただけます。 主な機能 プッシュ通知を携帯電話に送信します コンピューターまたはラップトップでポップアップしてアラートを鳴らします 再描画されない矢印を表示します(潜在的なブームの場合は上向きの矢印、潜在的なクラッシュの場合は下向きの矢印) すべてのペアでの作業。 おすすめ 時間枠:H1およびH4 ペアの推奨:トレンドフェーズのペア。 コンタクト ご不明な点がある場合やサポートが必要な場合は、プライベートメッセージでご連絡ください。 著者 SAYADI ACHREF、fintechソフトウェアエンジニアおよびFinansyaの
平均日次範囲は、特定の期間にわたって測定された外国為替ペアの平均ピップ範囲を示します。トレーダーはADRを使用して、平均的な1日の動き以外の潜在的な価格行動を視覚化できます。 ADRが平均を上回っている場合、それは毎日のボラティリティが通常よりも高いことを意味します。これは、通貨ペアがその基準を超えて拡大している可能性があることを意味します。 ADRアナライザーは5つの主要な機能で構成されています。 範囲(ADR)スクリーナー:複数通貨のADR分析。 ADRゾーン:ADRゾーンの価格ブームの外で日中に予想される市場範囲を示します。 Xバーゾーン:ユーザーが指定したXバーのX量のブレークを表示します。 毎日の高および低ゾーン:前日の高レベルまたは低レベルの休憩を識別します。 ウィークリーハイゾーンとローゾーン:週の休憩日ハイレベルまたはローレベルを識別します。 期間限定オファー:レンジアナライザーインジケーターは、50ドルと寿命でのみご利用いただけます。 (元の価格125 $) 主な機能 マルチ通貨スクリーナー。 ADRゾーンブレイクアウト すべてのタイプのアラート(ポップ、プッ
ボラティリティ アナライザーはモメンタム インジケーターであり、タイトな取引範囲での値固め後に価格が大きく上昇する傾向を利用します。このインジケーターは、スクイーズが発火したときの動きの予想される方向を示すために、運動量オシレーターも使用します。このヒストグラムはゼロ ラインの周りで振動し、ゼロ ラインより上のモメンタムの増加はロングを購入する機会を示し、ゼロ ラインを下回るモメンタムはショートの機会を示す可能性があります。 期間限定オファー : インジケーターは、わずか 50 $ で無期限でご利用いただけます。 ( 元の価格 125$ ) 主な機能 横向きトレンド検出器。 低揮発性検出器。 強気の高値と弱気の高値のボラティリティ検出器。 すべての時間枠とすべてのペアで作業します。 ポップアップ アラートとプッシュ通知アラートを提供します。 コンタクト 質問がある場合、またはサポートが必要な場合は、プライベート メッセージでご連絡ください。 警告 すべてのインジケーターとツールは、公式のメタトレーダー ストア (MQL5 マーケット) からのみ入手できます。 プレミア
通貨強度メーターは、現在どの通貨が強いか、どの通貨が弱いかをすばやく視覚的にガイドします。 メーターは、すべての外国為替クロスペアの強度を測定し、それらに計算を適用して、個々の通貨の全体的な強度を決定します。 28ペアのトレンドに基づいて通貨の強さに基づいて計算します。 MQL5ブログにアクセスすると、インジケーターの無料バージョンをダウンロードできます。 Metatrader Testerの制限なしで、購入する前に試してみてください: ここをクリック 1.ドキュメント すべてのトレンド通貨強度のドキュメント(手順)と戦略の詳細は、MQL5ブログのこの投稿で入手できます: ここをクリックしてください。 2.お問い合わせ ご不明な点がある場合やサポートが必要な場合は、プライベートメッセージでご連絡ください。 3.作成者 SAYADI ACHREF、フィンテックソフトウェアエンジニア、Finansyaの創設者。
ブームおよびクラッシュスパイク検出器インジケーターは、主に価格のブームおよびクラッシュを検出するための高度な戦略に基づいてコーディングされています。 価格の高確率のブームとクラッシュを検出するために、複雑なアルゴリズムが組み込まれました。 ブームまたはクラッシュフェーズの可能性について警告します。 ブームフェーズ:価格の上昇が速すぎる場合。 クラッシュフェーズ:価格の低下が速すぎる場合。 期間限定オファー:インジケーターは30ドルと生涯でのみご利用いただけます。 主な機能 プッシュ通知を携帯電話に送信します コンピューターまたはラップトップでポップアップしてアラートを鳴らします 再描画されない矢印を表示します(潜在的なブームの場合は上向きの矢印、潜在的なクラッシュの場合は下向きの矢印) すべてのペアでの作業。 おすすめ 時間枠:H1およびH4 ペアの推奨:トレンドフェーズのペア。 コンタクト ご不明な点がある場合やサポートが必要な場合は、プライベートメッセージでご連絡ください。 著者 SAYADI ACHREF、fintechソフトウェアエンジニアおよびFinansyaの
すべてのトレーダーは、1 回の取引で 5% (または 7%) を超えるリスクを負ってはならないことを知っています。これはマネー管理の法則であり、トレーダーは異なる取引レベルに対して異なるストップロス値を使用する必要があるため、使用可能な LotSize を毎回計算する必要があります。このインディケータは、チャートに配置する瞬間に適切な LotSize を計算し、「ストップ ロス ライン」を任意の方向にドラッグするたびに計算します。 期間限定オファー: すべてのプレミアム インジケーターはわずか 50$ で利用できます。MQL5 ブログにアクセスすると、プレミアム インジケーターのすべての詳細を確認できます。ここをクリック。 入力 MAX_RISK_PER_TRADE - トレーダーがトレードごとにリスクを負うパーセンテージ。 CUSTOM_BALANCE - リスクの計算に使用される金額を定義します。 0 => 電卓は口座残高を使用します。 ENTRY_PRICE_LINE_COLOR - TP (テイクプロフィット) ラインの色 STOP_PRICE_LINE_COLOR-
平均日次範囲は、特定の期間にわたって測定された外国為替ペアの平均ピップ範囲を示します。トレーダーはADRを使用して、平均的な1日の動き以外の潜在的な価格行動を視覚化できます。 ADRが平均を上回っている場合、それは毎日のボラティリティが通常よりも高いことを意味します。これは、通貨ペアがその基準を超えて拡大している可能性があることを意味します。 ADRアナライザーは5つの主要な機能で構成されています。 範囲(ADR)スクリーナー:複数通貨のADR分析。 ADRゾーン:ADRゾーンの価格ブームの外で日中に予想される市場範囲を示します。 Xバーゾーン:ユーザーが指定したXバーのX量のブレークを表示します。 毎日の高および低ゾーン:前日の高レベルまたは低レベルの休憩を識別します。 ウィークリーハイゾーンとローゾーン:週の休憩日ハイレベルまたはローレベルを識別します。 期間限定オファー:レンジアナライザーインジケーターは、50ドルと寿命でのみご利用いただけます。 (元の価格125 $) 主な機能 マルチ通貨スクリーナー。 ADRゾーンブレイクアウト すべてのタイプのアラート(ポップ、プッ
フィルタ:
USD Down
59
USD Down 2024.12.04 13:19 
 

this tool is very important to calculate the risk and using the lot calculator, you can get a good combination of support and resistance level in addition to calculating the risk, the cost is nothing compared to the advantage of having such as a tool in hands, the costumer service is very comprehensive and answerring the questions in clear and precise manner, i recommand this tool for all traders with the lot and size calculator you will never be in hasardous situation due to non calculated open positions .

Nice Trader OÜ
2327
Aller Uja 2024.12.01 17:53 
 

a good tool if you learn to use it

168622
64
168622 2024.11.06 13:02 
 

ユーザーは評価に対して何もコメントを残しませんでした

Clinton Van
118
Clinton Van 2024.09.25 15:43 
 

I love both indicators Trend screener Pro and Support and Resistance Screener Pro but you can't use them blindly. You need to understand market structure. I always try to trade a strong currency versus a weaker one. I then trade with the trend after price makes corrections. The Support and resistance indicator helps see how close price is from support or resistance. On uptrend I buy at support levels and downtrend I buy at resistance levels of price corrections. Together these indicators is all you need to make informed decisions. I do my analysis on the 1H time Frame and then I enter my trades using the 1min or 5min time frames. Thanks for these indicators. They really safe me allot of time.

Dang Minh Tien
592
Dang Minh Tien 2024.02.08 08:01 
 

My indicator doesn't draw the S/R zone; it only shows text. Bank levels work fine. I think it's a minor bug because it looks like the indicator isn't compatible when you change your chart color scheme.

STE S.S.COMPANY
293014
開発者からの返信 Sayadi Achraf 2024.02.09 11:54
Hi sir, Thank you for taking time to write your review. I'm sending you ASAP a private message to check the issue you're facing.
--- best regards.
SAYADI ashref.
dutchguy076
74
dutchguy076 2023.10.23 22:09 
 

ユーザーは評価に対して何もコメントを残しませんでした

STE S.S.COMPANY
293014
開発者からの返信 Sayadi Achraf 2023.11.17 14:57
Dear sir, Thank you for taking time to write your review. We have just sent you an email to fix the issue that you're facing with u.
--- Please if you have any questions, feel free to contact me. Best regards.
SAYADI ashref.
Jerry Slagger
92
Jerry Slagger 2023.09.15 20:10 
 

This is one of the main indicators I use and I have been using it for 2 months now. The new version 13 is awesome. It allows all the levels to be displayed at the same time. So I can see that price is pushing a major or minor level, etc. These levels, along with the PullBack feature bring it all together so one can easily see the best entry / exit points. The HH LL Scanner is awesome as well. I use it to see if price is too high / low to enter, to make sure I am not entering after the move has already happened. Support is top notch and responsive.

STE S.S.COMPANY
293014
開発者からの返信 Sayadi Achraf 2023.09.20 17:46
Thank you for taking the time to share your review, Mr. Jerry.
Wilfried Pelletier
160
Wilfried Pelletier 2023.08.30 17:37 
 

ユーザーは評価に対して何もコメントを残しませんでした

STE S.S.COMPANY
293014
開発者からの返信 Sayadi Achraf 2023.08.30 17:39
Thank you for your review, we are happy to know that you liked our indicator. Any questions, please feel free to contact us.
Dunstan Wafula Namusonge
851
Dunstan Wafula Namusonge 2023.06.09 19:26 
 

The reason why I like this forex indicator so much is because it is easy to use. The indicator accurately gives me both price action and technical analysis at the same time. The multi-functional features make this a unique product. Alerts are accurate with precise signals. The author is very responsive and available. I strongly recommend this indicator.Trust me when I say that this will be your go to indicator once you try it.

STE S.S.COMPANY
293014
開発者からの返信 Sayadi Achraf 2023.09.20 17:46
Thank you for taking time to share your review MR. Wafula.
Олег Похилько
160
Олег Похилько 2023.04.06 16:48 
 

Good indicator, but Sayadi just the best!

Andres.Morelo
129
Andres.Morelo 2023.01.26 10:33 
 

excellent indicator, I like me very much. It complements my trading plan very well and customer service is exceptional, too good for price. I recommend 100% I give you five stars

Agbakeleke Idowu
609
Agbakeleke Idowu 2023.01.21 22:37 
 

Very Worst Indicator in mql5 market. You will do yourself a great disadvantage buying it. Don't be deceived by the fake comments you saw here. It is a total waste of money. Wasted my hard earned $50 on this Garbage of a Thing. I once added a review but this Big man Liar has deleted it. The Creator did a very lazy Job on this indicator, and I consider it a big theft taking $50 for this nonesense indicator.

Deleting my Review on this indicator means this is a scam indicator. Nonesense

A BAD SELLER. DON'T EVER BUY FROM HIM. FAKE REVIEWS EVERYWHERE

STE S.S.COMPANY
293014
開発者からの返信 Sayadi Achraf 2023.06.06 00:17
Hello Mr. Idowu, Thank you for taking the time to share your feedback with us. I must say, I was taken aback by your review. As sellers, we do not have the capability to remove customer reviews and we always value constructive criticism as it helps us improve our services. However, it seemed from your review that you may have had a misunderstanding about our indicator/service. We have been selling on the MQL5 market since 2020 and our primary goal has always been to provide the best possible service to our customers. Any suggestions that we have engaged in dishonest activities are deeply unsettling and contrary to our principles. We believe in transparency and honest communication with our customers. Thank you once again for your feedback, and we wish you a safe and prosperous trading journey. Best regards,
SAYADI Ashref
26 Trades, LLC
371
JASON ALAN MYERS 2022.12.03 16:45 
 

Awesome indicator! I use the Pullback Zones on higher timeframes, set and wait for alert, then go to lower timeframe and wait for alert to enter trade. Also, there is no repaint on this indicator. Most indicators have great signals until you realize they have repainted, but not this indicator. Support is always prompt and helpful.

STE S.S.COMPANY
293014
開発者からの返信 Sayadi Achraf 2023.03.23 10:29
Thank you for your review, Mr. Jason.
25170142
144
25170142 2022.10.24 13:55 
 

Very good indicator, I use the pullback function in combination with indices and trade the pullbacks. That works great. Also the support is very good always quick response to questions.

STE S.S.COMPANY
293014
開発者からの返信 Sayadi Achraf 2023.03.23 10:28
Thank you for your review sir.
Long Zhang
62
Long Zhang 2022.08.25 07:56 
 

你好,可能因为防火墙的原因看不到视频,您可以将视频发到我的邮箱吗

STE S.S.COMPANY
293014
開発者からの返信 Sayadi Achraf 2022.08.25 18:05
Dear sir, Thank you for taking time to write your review. I'm sending you now the request video via PM. Best regards.
SAYADI Ashref.
SparksyB
102
SparksyB 2022.08.20 23:11 
 

Amazing indicator with pivot points features !

GoldHulk
955
GoldHulk 2022.03.26 02:49 
 

I got that SR Indicator for MT4+5 and observe it now for quite some time (4 months +)

- I have to say it still impresses me of how good these SR Zones are.

There are many SR/SnD Indicators, some of them are pretty good (I also like Blahtech Supply and Demand very much), but this SR Indicator here just masters an incredible difficult part (especially for coding this)

>> It only gives you the IMPORTANT SR Zones on your screen and doesnt clutter your whole screen til its useless.

Also I like the Settings very much on this indicator, they are smart trimmed down to the necessary but still versatile enough for adjustments (very good in not to overwhelm you with a shitload of settings like many others do)

In short: If you have a good foundation in basic trading skills/knowledge, then this Indicator here is an amazing tool

(for me: it helps me to get more structured in my own trading approach - without this indicator I tend to be all over the charts, have difficulties to prioritize - so its a great help to overcome my weaknesses)

PS: @Sayadi Achraf, not sure if thats possible, but if you can manage to make this working in similar quality on major crypto assests as well, then this would be amazing :)

STE S.S.COMPANY
293014
開発者からの返信 Sayadi Achraf 2022.03.26 14:47
Hi sir, Thank you for your review and I'm to know that you liked our indicator. I sent crypto request to my technical team and we will for this crypto feature in our next upgrade. Best regards.
SAYADI Ashref.
33225272
159
33225272 2022.02.05 18:14 
 

THE BEST TOOL EVER...

KUSPRAPTONO
35
KUSPRAPTONO 2022.01.13 09:26 
 

ユーザーは評価に対して何もコメントを残しませんでした

STE S.S.COMPANY
293014
開発者からの返信 Sayadi Achraf 2022.01.13 14:01
Hi sir,ù Thank you for your message. This section for reviews only and for the request of support, you need to use the comment section, sir.
As i see that you bought the indicator since 3 hours ago, please don't worry we will give you all the necessary support to install the indicator properly in your Metatrader sir. We are sending you now a PM to check what issue you're facing to solve it with you. About exchange of product from MT5 to MT4, that's not possible sir. Best regards.
SAYADI Ashref.
peace55
45
peace55 2021.06.14 02:19 
 

I bought your product on Support and Resistance Pro... Please what timeframe works perfectly for it. Secondly, I wanted to get your order product the Currency strength meter but isn't in market place anymore

STE S.S.COMPANY
293014
開発者からの返信 Sayadi Achraf 2022.01.14 09:44
Hi sir. Thank you for choosing our products. This section for reviews only and for the request of support, you need to use the comment section, sir. The best timeframe is H1 and H4 sir. We published again the Currency Strength Meter for MT5, we are removed for upgrade, sir. You can find in our seller profile. Please if you have any questions, feel free to contact me sir.
12
レビューに返信
バージョン 13.20 2023.12.13
1. Fixed email alert issue with the last metatrader version.
バージョン 13.0 2023.09.15
1. Add options to enable-disable every feature
バージョン 12.0 2023.06.05
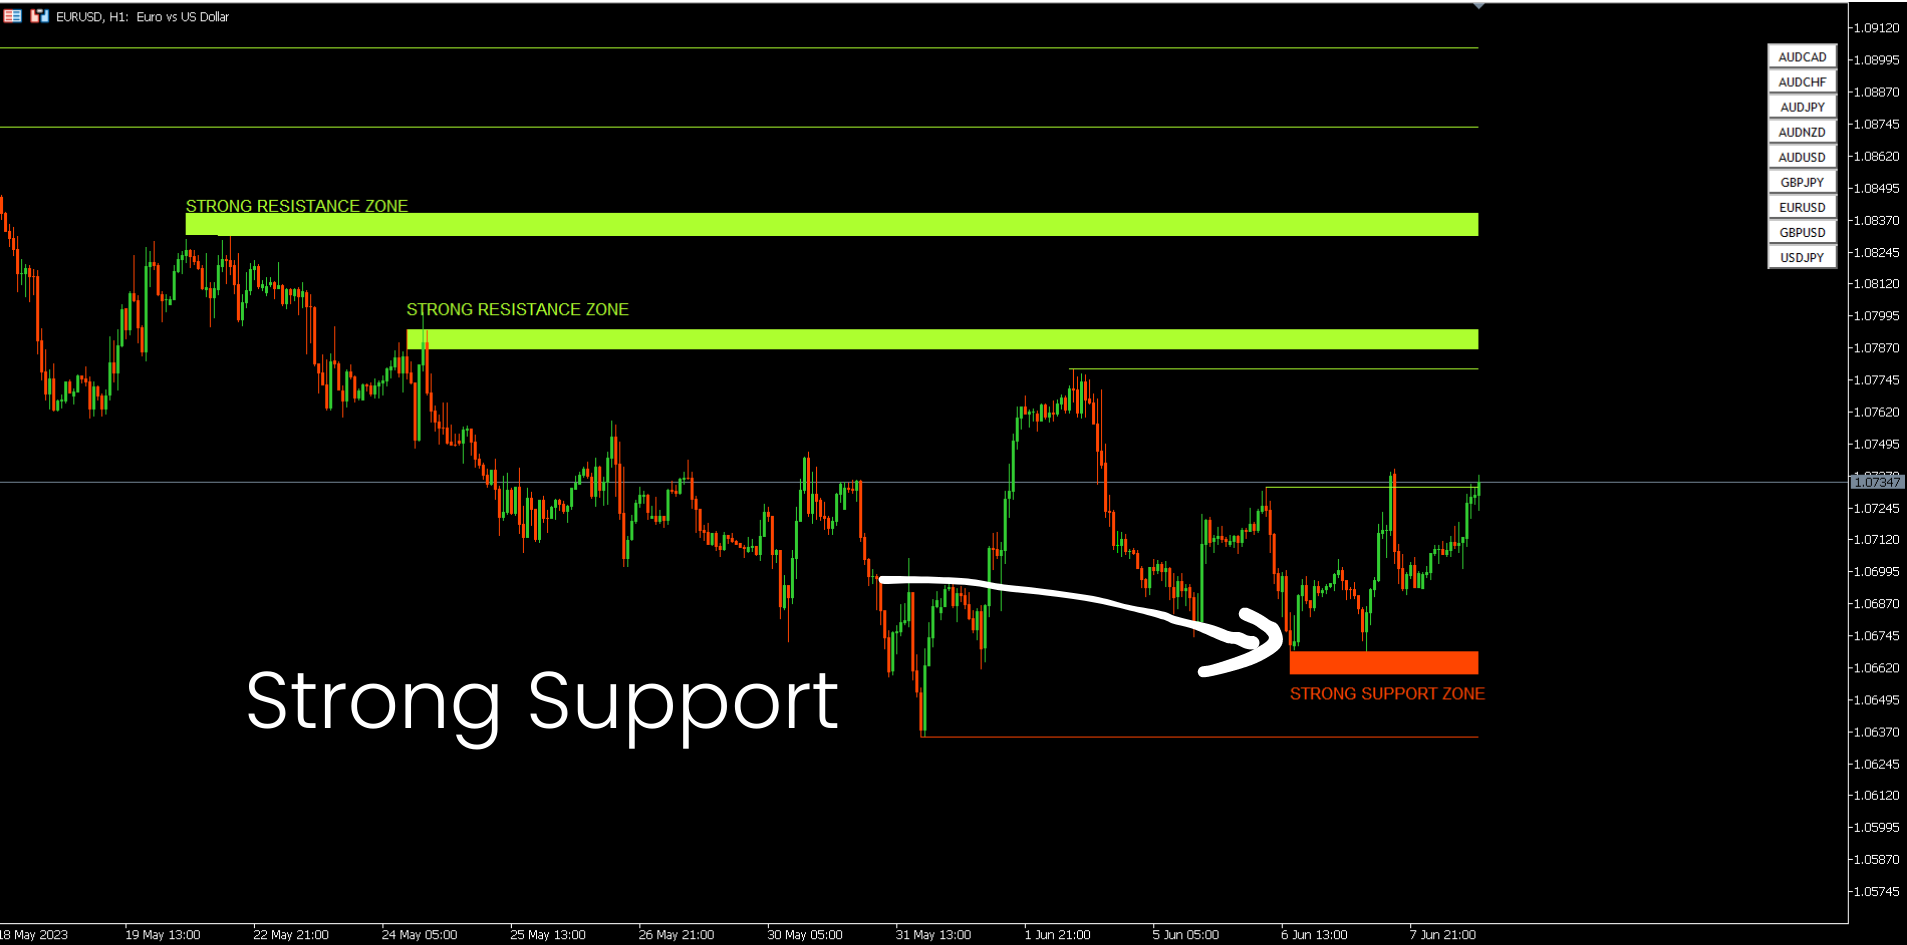
1. Optimize Pullback zones to include markets ( Deriv pairs )
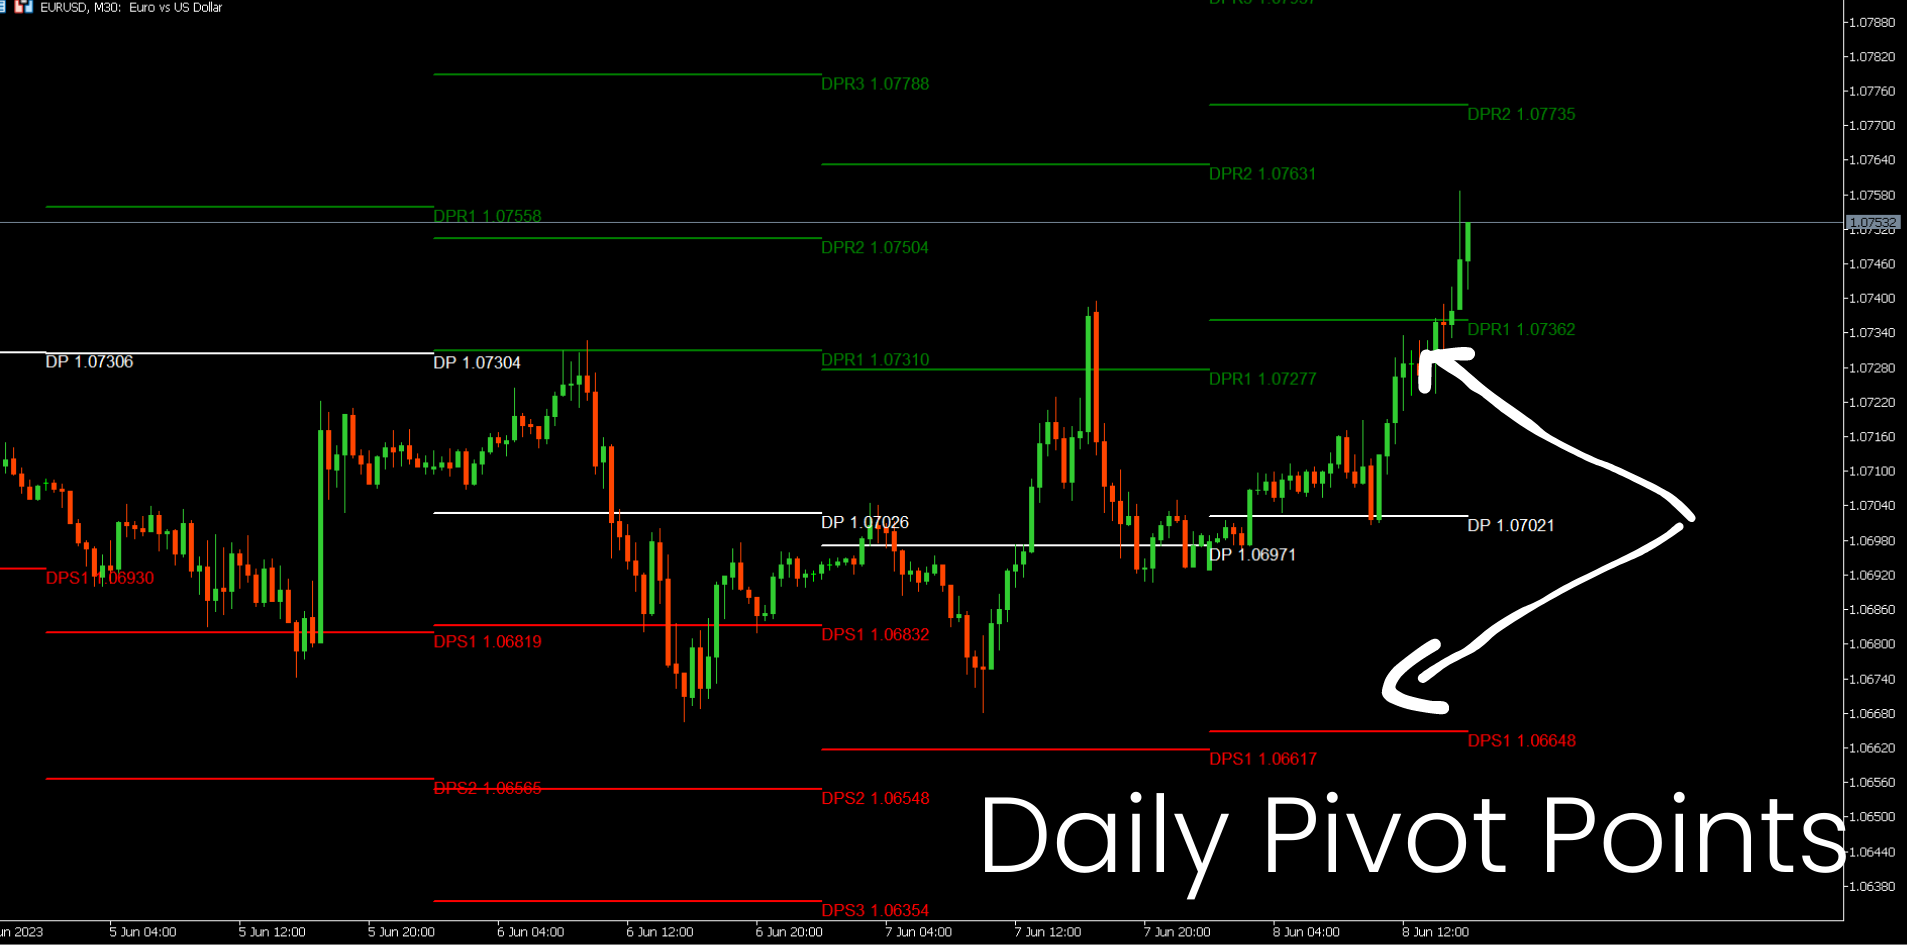
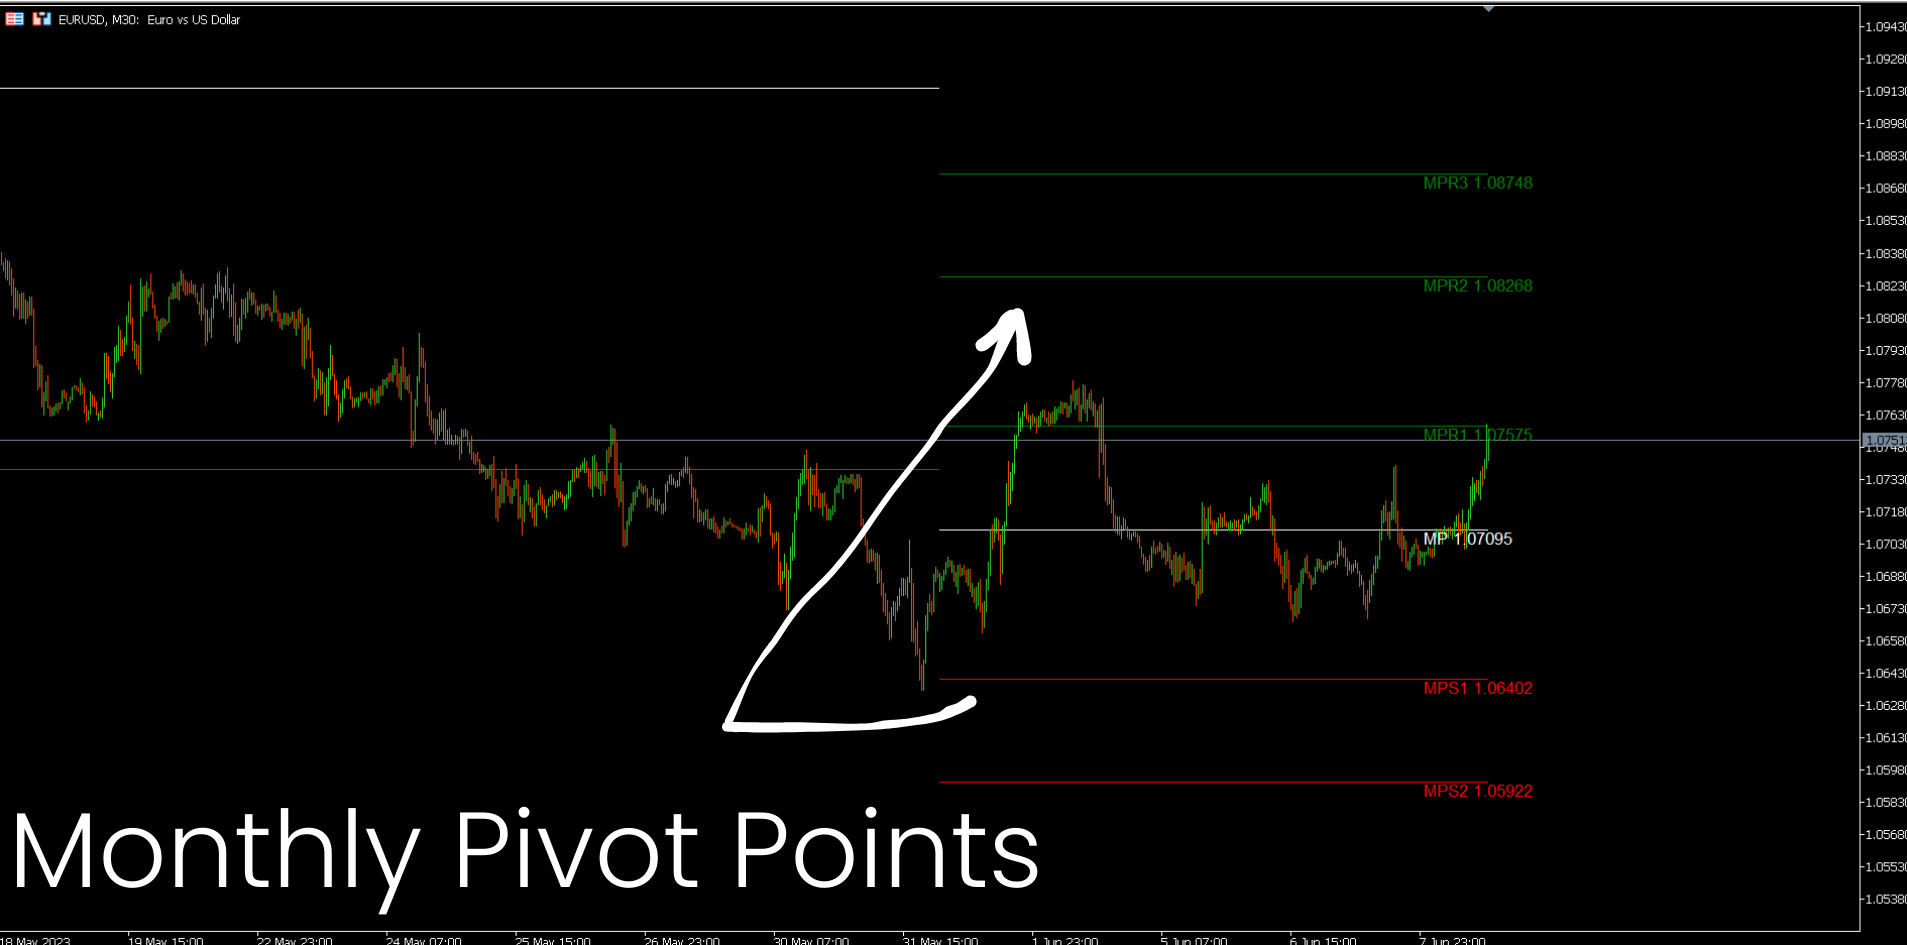
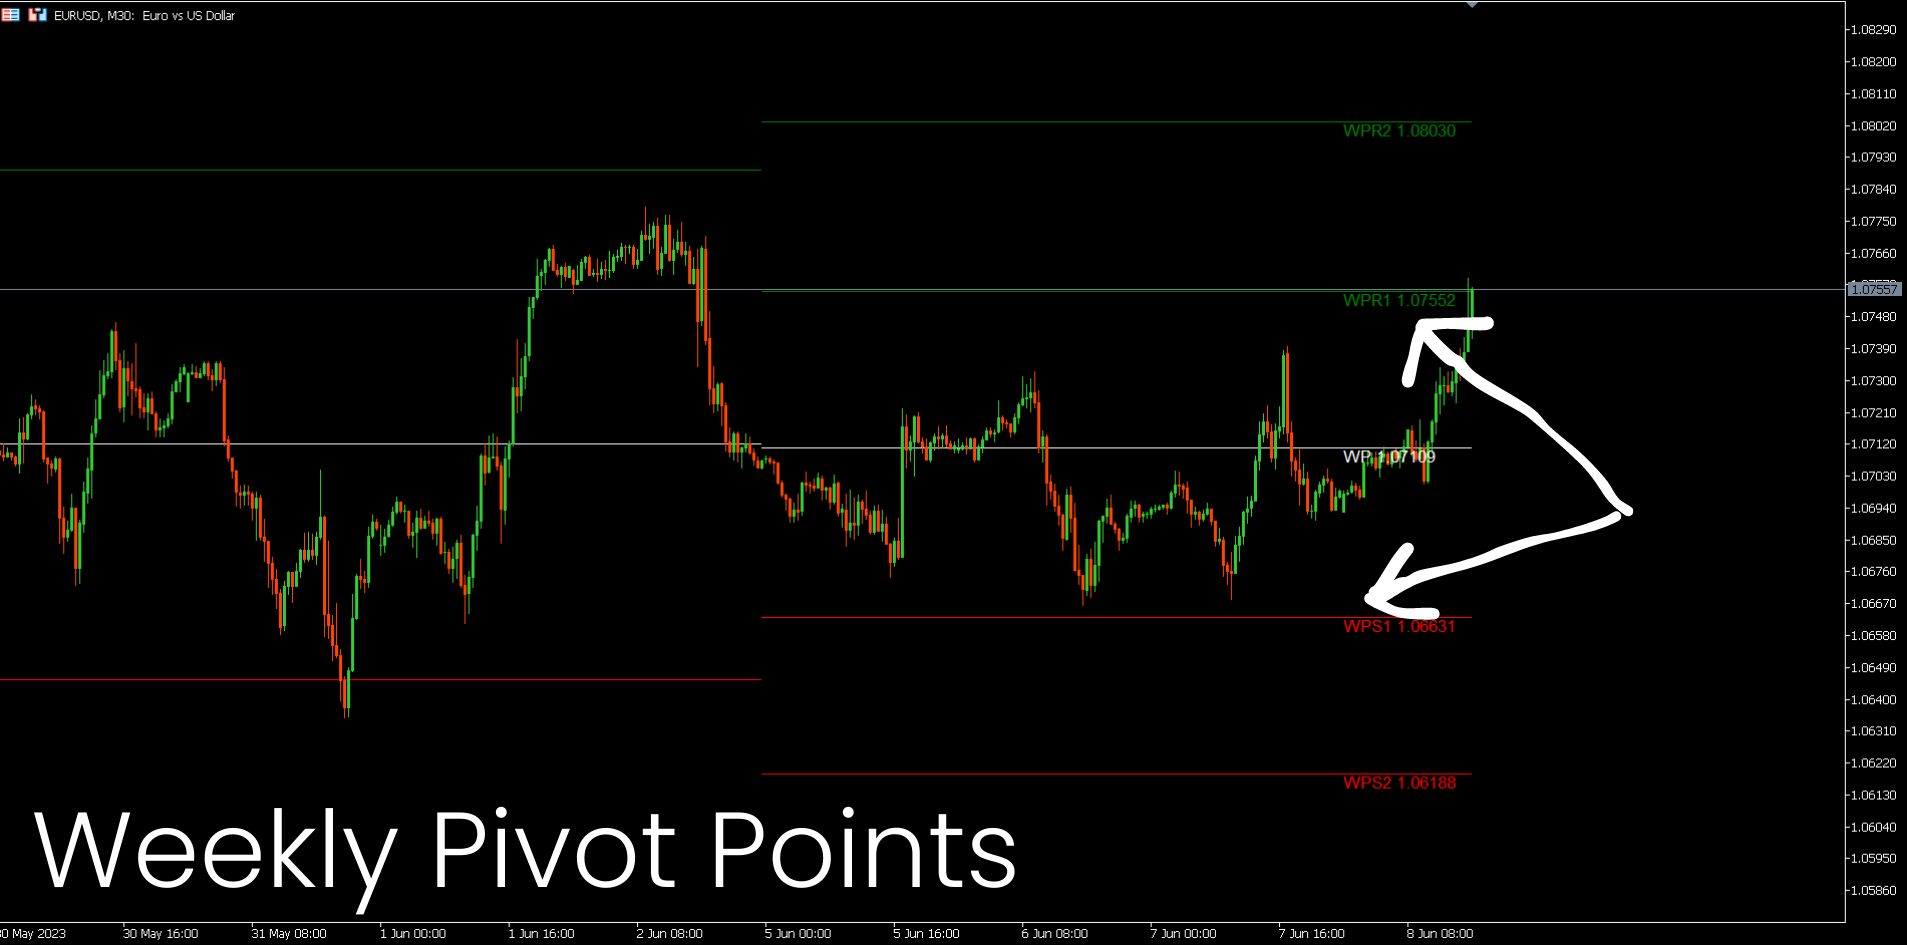
2. Enable 3 types of Pivots points.
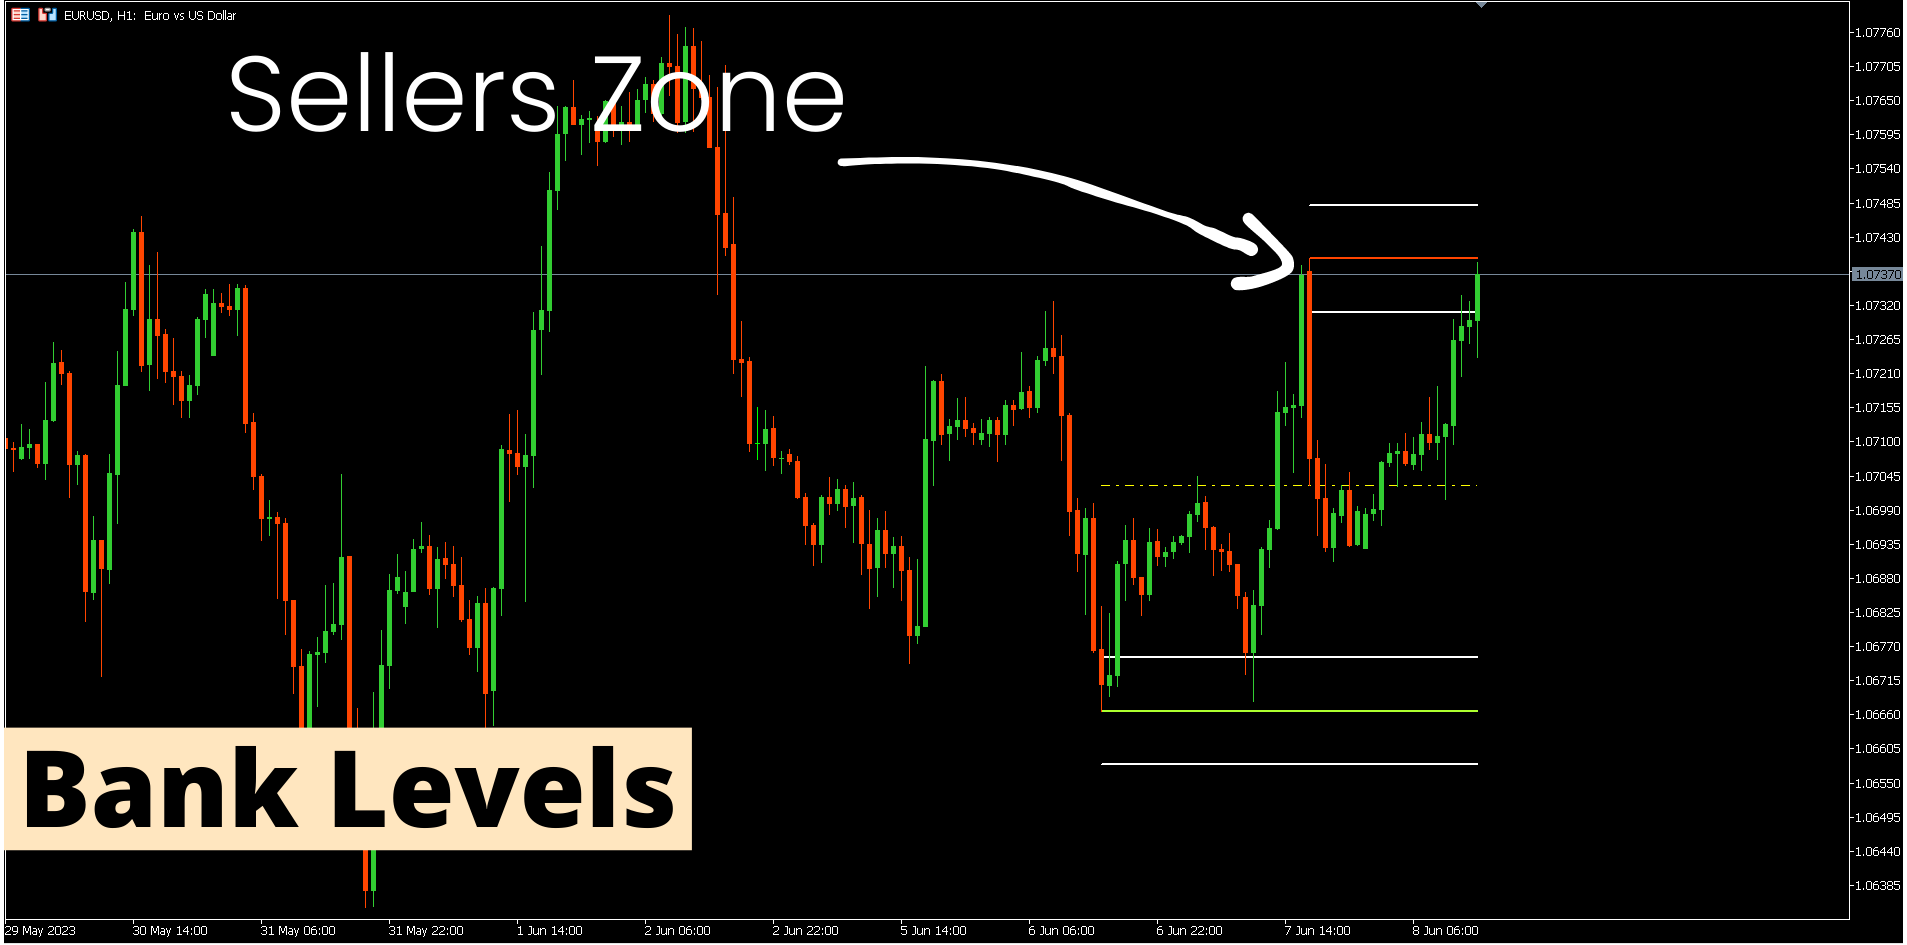
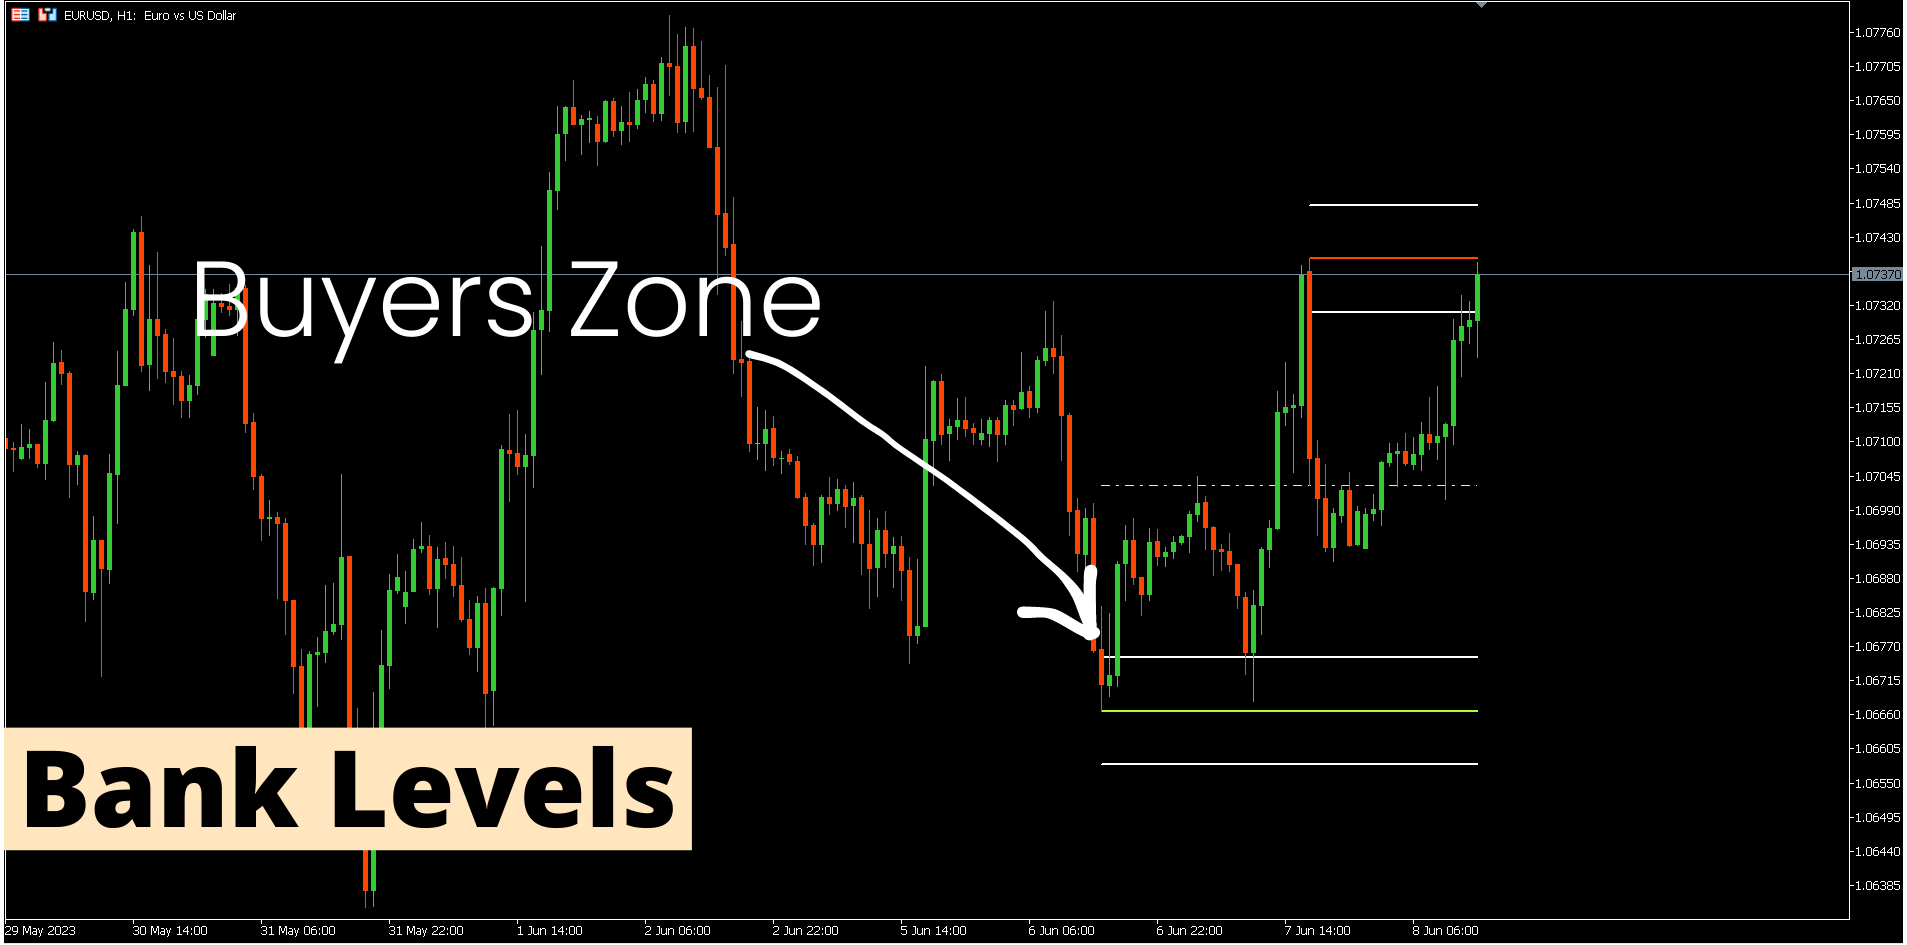
3. Optimize Bank level zones.
バージョン 11.1 2023.02.03
1. Combine Breakout/Pullback Zones to provide one zone with arrows.
バージョン 10.12 2023.01.23
1. Fixing speeling mistakes in the text of the alerts.
バージョン 10.10 2023.01.23
1. Fixing alert issue with In Buyers and Sellers Zones. ( PullBack - Breakout Zones Alerts )
2. Optimizing Buyers and Sellers backtesting speed.
バージョン 10.0 2023.01.18
1. Change Pullback Zones logic.
2. Add Breakout zones.
3. Remove the Bank level feature.
バージョン 9.30 2023.01.13
1. Improve the PullBack zone algorithm to wait for the bar to close to confirm the zone.
バージョン 9.2 2022.11.24
1. Add a Central line for Bank levels.
2. Optimizing and improving the Strong Support and Resistance zones Algorithm.
バージョン 9.1 2022.08.08
1. Fixing changing mode issues and cleaning old zones
バージョン 9.0 2022.08.07
1. Optimizing Pullback feature algorithm.
2. Add an option to keep old pullback zones.
バージョン 8.50 2022.05.30
1. Add a new feature: Bank Levels.
2. Add Alerts to the Price Action Screener.
バージョン 8.40 2022.02.08
1. Add Line Width for Pivots lines.
バージョン 8.30 2022.02.03
1. Add support for US30 via sensitivity parameter.
バージョン 8.21 2021.12.24
1. Optimizing Indicator code and speed performance.
2. Add Pivots points levels.
バージョン 8.20 2021.10.06
1. Optimizing indicator algorithm.
バージョン 8.10 2021.05.09
1. Increase indicator speed.
バージョン 8.0 2021.04.27
- Fixing issue of pairs navigator with GKFX Broker.
バージョン 7.50 2020.12.03
1. Algorithm optimization.
バージョン 7.20 2020.11.29
1. Fixing refreshing issue.