Gann Angles end Box
- Indicadores
-
Kirill Borovskii
 My name is Kyril Borovsky and I provide professional services to teach methods of W.D.Ganna and give expert advice on trading in the forex market, which allow clients to achieve the planned financial goals. I also offer software based on years of experience and knowledge of the methods of the
 - Versão: 1.1
- Atualizado: 15 março 2024
- Ativações: 5
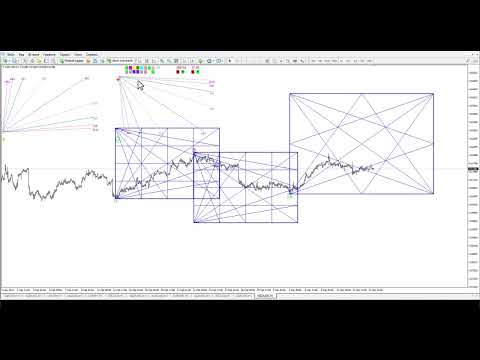
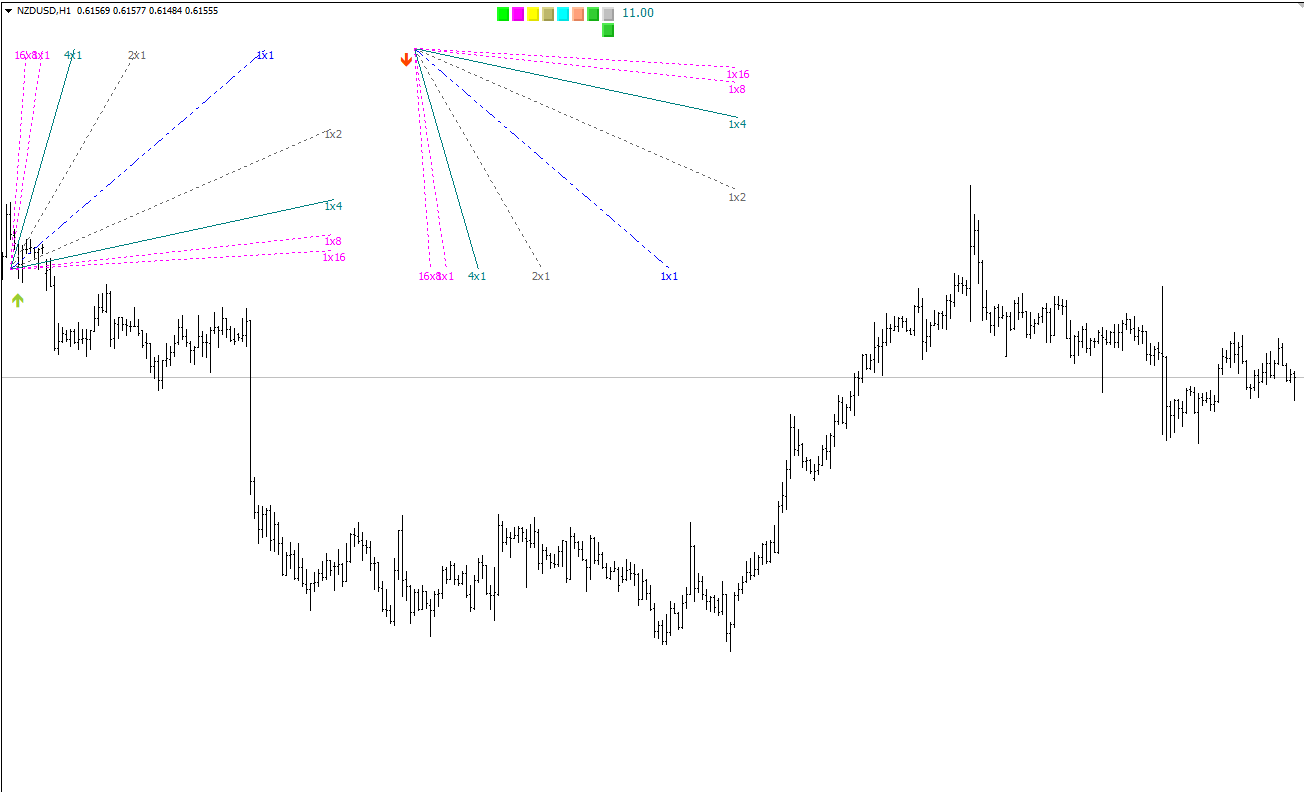
This indicator is, without a doubt, the best variation of the Gann Angles among others. It allows traders using Gann methods to automatically calculate the Gann angles for the traded instrument. The scale is automatically calculated when the indicator is attached to the chart. When switching timeframes, the indicator recalculates the scale for the current timeframe. Additionally, you can enter your own scales for the Gann angles. You can enter your own scales either for both vectors or for each individually, i.e., assign different scales for ascending and descending vectors. The indicator also allows you to not only draw angles but also 9 square levels and 52, 90, and 144 Gann boxes. The indicator includes a prediction function for goals based on angles. The indicator is controlled by a panel of buttons that is conveniently located above the chart and does not overlap with anything. The settings are intuitive and have descriptions of parameters.
Version for MT5 - CLICK