Conheça o Mercado MQL5 no YouTube, assista aos vídeos tutoriais
Como comprar um robô de negociação ou indicador?
Execute seu EA na
hospedagem virtual
hospedagem virtual
Teste indicadores/robôs de negociação antes de comprá-los
Quer ganhar dinheiro no Mercado?
Como apresentar um produto para o consumidor final?
Novos Indicadores Técnicos para MetaTrader 5 - 52

Good afternoon. Today we offer the maxlottomson indicator to determine the maximum volume that you can put up for purchase or sale, if you look at your deposit level. This indicator is convenient to use for News trading, when you need to determine the entry point on a high-speed movement and calculate the risk level as a percentage of the deposit, the maxlottomson indicator shows the maximum value of the LOT volume for your deposit that you can use for trading.
FREE

The indicator determines the state of the market: trend or flat.
The state of the market is determined by taking into account volatility.
The flat (trading corridor)is displayed in yellow.
The green color shows the upward trend.
The red color shows the downward trend.
The height of the label corresponds to the volatility in the market.
The indicator does not redraw .
Settings History_Size - the amount of history for calculation.
Period_Candles - the number of candles to calculate the

The Supertrend indicator is a very versatile and and accurate trend detection system. It can also be used an an reversal indicator. Therefor you can use it either as entry or as an exit signal. Depending on your settings it is also good for trend confirmation. This version is slightly enhanced from the original version from mladen. The Supertrend of Averages Histogram Version contains: 11 different price options Averaging period
18 different averaging types ATR period and ATR multiplier Shows r
FREE
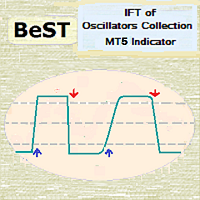
BeST_IFT of Oscillators Collection is a Composite MT4/5 Indicator that is based on the IFT ( Inverse Fisher Transformation ) applied to RSI , CCI , Stochastic and DeMarker Oscillators in order to find the best Entry and Exit points while using these Oscillators in our trading. The IFT was first used by John Ehlers to help clearly define the trigger points while using for this any common Oscillator ( TASC – May 2004 ). All Buy and Sell Signals are derived by the Indicator’s crossings of the Bu

A countdown timer for the Volume bar chart generator and Tick chart generator products, which are available for download from the MQL5 Market: Tick chart generator: https://www.mql5.com/en/market/product/29215 Volume bar chart generator: https://www.mql5.com/en/market/product/47197
The counter conveniently displays the number of ticks or transactions (depending on the chart) that need to pass for a new bar to start printing.
The user can set the following indicator inputs.
Volume type
FREE

Control Trading Support And Resistance
Es un indicador independiente del TimeFrame que permite proyectar niveles más relevantes del mercado en función del plazo de tiempo de la operativa. Los colores del indicador están escogidos para diferenciar entre los diferentes tipos de niveles y destacar a los más relevantes. Este indicador permite visualizar en un mismo gráfico los posibles objetivos relevantes que los diferentes traders pueden emplear siguiendo diferentes tipos de operativas en funci

Привет. Сегодня представляем индикатор корреляции - SynchroWindowTomson. Индикатор в одном окне показывает движение нескольких инструментов, по отношению друг к другу, удобно определять направление и изменение, особенно когда вы работаете с целым портфелем разных инструментов и нужно определить какой из них тянет результат назад и движется в другую сторону. Так же видны точки разворота спреда.
FREE
Market Zones MT5 Este indicador proporciona una lectura fácil del mercado basado en niveles estadísticos de Gauss, al igual que la metodología Market Profile. Utilizando una formula exclusiva el indicador estima dinámicamente las zonas que mejor representan dónde los movimientos del mercado permanecerán la mayor parte del tiempo (aprox. 70% del tiempo). Esto nos permite mirar el mercado de una forma más simple evitando caer en movimientos no relevantes. El precio se mueve despacio dentro de la

Description :
VWAP (Volume-Weighted Average Price) is the ratio of the value traded to total volume traded over a particular time horizon. It is a measure of the average price at which pair is traded over the trading horizon. Read More.
All Symbols and All Timeframes are supported.
Indicator Inputs :
VWAP Mode : Mode of VWAP Calculation. Options can be selected : Single,Session,Daily,Weekly,Monthly
Volumes : Real Volumes,Tick Volumes
Price Type : Used price for cal

QuantXMarketScanner is a multi assets indicator for MT5
- Mathematical model based on 7 custom moving averages indicators - Adaptable on Currencies, Stocks and Crypto - Automatic setup, self optimized
About QuantXsystem Products: – Simple installation & integration into MT5 – Unlimited License after purchase (for one user) – Automatic pattern recognition to identify the best timing and price levels. – Trading indicators are displayed directly and automatica

QuantXSTocks Trading Range Indicator for MT5:
INSTRUCTIONS TO USE OUR INDICATOR:- User needs to take trade on Arrow or after an Arrow CandleStick, You can achieve up-to 35-125 pips target by this Indicator. Best Timeframes for Stocks and Indices are M30 and H1: AMAZON M30 (50 pips) TESLA M30 (50 pips) APPLE M30 (50 pips) ADOBE M30 (50 pips) NASDAQ100 H1 (125 pips) The above are the approximate amount of pips you can achieve by this Indicator, Green arrow appears to be buy arrow while the Red a
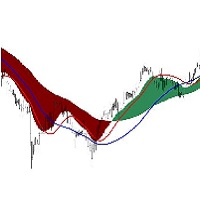
The Visual MACD Indicator is a forex technical analysis tool based on Moving Average Convergence Divergence, but it is plotted directly on the main trading chart with two macd signals. You should look for buy trades after the yellow line crosses the blue line and the MACD wave is blue. Similarly, you should look for sell trades after the yellow line crosses the blue when the MACD wave is red and the price is below the blue line . Go ahead and add it to your best trading system. It fits all
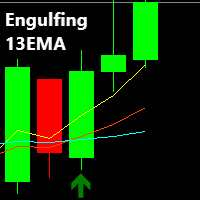
Description:
The Engulfing 13EMA is a Multi Timeframe Indicator that scans Multiple Symbols which will help you to identify potential trade set ups. As well as Forex, it can scan Crypto, Exotics, Metals, Indices, Energies or what ever else you have in your Market Watch list. You also have the option to enable/disable the time frames you want to scan. (M1,M5,M15,M30,H1,H4,D1,W1,MN1)
An alert is presented when the 13EMA passes through certain Engulfing candles, based on certain parameters wi

This is a momentum Indicator adapted to work on lower timeframes for Boom and Crash Indeecies. However the indicator can work with other Synthetic Indecies.
The indicator trend colour is set default to Aqua, then sell signal, the colour changes to red and blue signifies buy signals. .
For non Boom nor Crash Indecies use a smaller period and slightly increase the deviation.

Para utilizar o indicador Long e Short de forma eficaz e aproveitar as correlações entre diferentes ativos, é importante seguir algumas etapas fundamentais. Entenda a base do indicador: Familiarize-se com as métricas e cálculos subjacentes do indicador Long e Short. Compreenda como ele correlaciona os pares de moedas, índices ou criptomoedas e identifica as correlações positivas ou negativas entre esses ativos. Analise as correlações entre ativos: Utilize o indicador Long e Short para monitorar

The indicator synchronizes eight types of markings on several charts of one trading instrument.
This indicator is convenient to use in conjunction with "Multichart Dashboard" or other similar assistant that allows you to work with several charts at the same time.
"Multichart Dashboard" can be found under the link on my youtube channel.
Settings:
enable vertical line synchronization
enable horizontal line synchronization
enable Trend Line synchronization
enabling Fibonacci Retracement
FREE
Super Oscillator , is a powerful indicator that vibrates along with the market, resulting in a very useful tool to improve and decide your trading.
You can download the demo and test it yourself.
In a versatile indicator that in a single graph shows us information about four different aspects of the market
1) 4 operational zones. The indicator divides the screen into 4 zones that allows us to properly assess the moment of the market. a) Pullback Buy Trend. If the indicator is ab

Indicador Long & Short, rastreia os movimentos de ativos que há correlação positiva ou negativa permitindo explorar deslocamento antecipadamente.
– Alta taxa De Acerto Com Informação Em Tempo Real. – Entradas Com Mais Segurança Nas Operações. – Facilita a Leitura No Curto e Longo Prazo. - Opção de disparo de alerta para os Níveis.
– Funciona No Forex e Bovespa.
Informações para Ea Buffer Symbol 1ª = 0 ; Buffer Symbol 2ª = 2 ; * Versão gratuita somente EURUSD!
FREE

The indicator builds a graphical analysis based on the Fibonacci theory.
Fibo Fan is used for the analysis of the impulses and corrections of the movement.
Reversal lines (2 lines at the base of the Fibonacci fan) are used to analyze the direction of movements.
The indicator displays the of 4 the target line in each direction.
The indicator takes into account market volatility.
If the price is above the reversal lines, it makes sense to consider buying, if lower, then selling.
You can op

The indicator plots flexible support and resistance levels (dots). A special phase of movement is used for construction. Levels are formed dynamically, that is, each new candle can continue the level or complete it.
The level can provide resistance or support to the price even where it is no longer there. Also, support and resistance levels can change roles. The importance of levels is affected by: the amount of time the level is formed and the number of touches.
The significance of these l

DNA is an indicator that allows us to operate both in favor of a trend and a pullback. You can download the demo and test it yourself.
Trend trading is above zero and pullback trading is below zero.
The direction of the operation is marked by the color of the line.
If the line is green it corresponds to purchases.
If the line is red it corresponds to sales.
For example, if the green line is above zero and growing, we will have an uptrend operation. If the red line is above zero and

TD Combo is better when you have sharp directional moves, because it requires only thirteen price bars from start to finish compared to TD Sequential which needs at least 22 bars. The criteria for a Setup within TD Combo are the same with those required for a Setup within TD Sequential. The difference is that the count starts at bar 1 of the setup and not from bar 9 and TD Combo requires four conditions to be satisfied simultaneously.
Requirements for a TD Combo Buy Countdown
- Close lower

The indicator scans for TD Combo signals in multiple timeframes for the all markets filtered and shows the results on Dashboard. Key Features Dashboard can be used for all markets It can scan for signals on MN1, W1, D1, H4, H1, M30, M15 ,M5, M1 timeframes Parameters UseMarketWatch: Set true to copy all symbols available in market watch MarketWatchCount : Set the number of symbols that you want to copy from the market watch list. CustomSymbols: Enter the custom symbols that you want to be availa
T D Sequential indicator consist of two components. TD Setup is the first one and it is a prerequisite for the TD Countdown – the second component.
TD Setup TD Setup compares the current close with the corresponding close four bars earlier. There must be nine consecutive closes higher/lower than the close four bars earlier.
1- TD Buy Setup - Prerequisite is a bearish price flip, which indicates a switch from positive to negative momentum.
– Af

The indicator scans for TD Sequential signals in multiple timeframes for the all markets filtered and shows the results on Dashboard. Key Features Dashboard can be used for all markets It can scan for signals on MN1, W1, D1, H4, H1, M30, M15 ,M5, M1 timeframes Parameters UseMarketWatch: Set true to copy all symbols available in market watch MarketWatchCount : Set the number of symbols that you want to copy from the market watch list. CustomSymbols: Enter the custom symbols that you want to be a

This utility is a universal meta-indicator that enables you to use any other indicator calculated over the higher timeframe (HTF) data. Now you may find precise entries and exits on working timeframe with no need of switching to a higher timeframe. You no longer need to purchase HTF version of you favorite indicators.
Indicator parameters: inp_ind_name - name of the indicator that should be calculated on the selected timeframe. You can choose from: the list of built-in indicators (e.g. MA for

Crash 1000 Alert is an indicator that alerts trader when price is in the CRASH ZONE. The defaults settings work best only on Crash 1000 Index but are also fully customizable.
How to use: When price enters the crash zone, the indicator will send out messages of a potential crash. Traders can use this info to enter sell trades and capitalize on the spike down. Notifications and alerts are sent to your mobile device and platforms respectively. NB: please make sure notifications are enabled

This utility is a universal meta-indicator that enables you to use any other indicator calculated over the higher timeframe (HTF) data. Now you may find precise entries and exits on working timeframe with no need of switching to a higher timeframe. You no longer need to purchase HTF version of you favorite indicators.
Indicator parameters: inp_ind_name - name of the indicator that should be calculated on the selected timeframe. You can choose from: the list of built-in indicators (e.g. M

Boa tarde. Preparamos um novo produto para traders e analistas de mercado. Nosso indicador VolumeSpreadtompson-foi criado para ver a influência dos participantes institucionais do mercado no preço atual. O indicador mostra os níveis de variação do spread por unidade de tempo com seus valores principais. A prática mostra que a mudança nos volumes está associada a um aviso e à antecipação da atividade especulativa, especialmente em momentos - chave: notícias do Fed, notícias do petróleo, discursos
FREE

THE SOUND OF MARKET is an indicator designed to detect the sound produced for the market movement. This system detects the background sound produced by market movements in real time to decide in your operation. In addition, by analyzing the sound recorded in the indicator, we can detect operational patterns. You can download the demo and test it yourself.
The indicator has a text help in the upper right corner, in which it shows whether the indicator has a bullish or bearish backgro

Вилка Нео v5, разрабатывалась для торговой системы "Оракул", но постепенно дополнялась, например - углами Ганна и другими опциями... Можно создавать графические объекты с заданным цветом, стилем и толщиной, такие как: прямоугольники с заливкой и без, отрезки трендлиний и нестандартный инструмент - "вилка Нео" в виде трезубца, так же есть возможность интерактивно настраивать цветовую палитру прямо с графика, настраивать видимость объектов для разных ТФ, толщину и стили...
Панель переключается к
FREE

Micro Demo ******************* Секундные графики в Meta Trader 5 ********************** Более точного инструмента для входа в сделку вы не найдёте. Платная полная версия: Micro "Second charts" В демоверсии секундные периоды сменяются случайным образом через случайные интервалы времени. Отсутствует автоматическая настройка периодов бесплатных индикаторов.
Входные параметры: Displayed bars - отображаемые бары Step of price levels, pp, 0-off - шаг отрисовки ценовых уровней, пункты Scale
FREE

This indicator is a simple tool to spot a possible trend.
When the ribbon below the price bars, It will turn to Green color and the trend is seen to be bullish When the ribbon above the price bars, it will turn to Red color and the trend is seen to be bearish. It can be used a either Entry Signal Exit Signal or trailing stop, so it is very versatile. By default color : Green is UP trend and Red is Down trend and this work perfect with Bar4Colors.ex5
FREE

Micro ******************* Секундные графики MT5 ********************** Более точного инструмента для входа в сделку вы не найдёте. Входные параметры: Timeframe, sek - период построения графика, секунды Displayed bars - отображаемые бары Step of price levels, pp, 0-off - шаг отрисовки ценовых уровней, пункты Scale points per bar, 0-off - масштаб в пунктах на бар Show lines - отображение текущих уровней Show comment - отображение комментария Standard color scheme - стандартная цветовая сх
Pullback Probability It is an indicator that shows us the probability that the price will t urn around and we can operate that market turn.
The indicator marks a line that oscillates between a percentage of 0% to 100%.
The one indicated in the upper left corner shows us a help in which it informs us of the area in which the price is in real time, as well as the percentage that the candle is open. You can download the demo and test it yourself.
The indicator marks 6 work zones. 1) Above 80

HAWA GOLD MT5 Advanced trading indicator with realistic pre-defined entry and exit levels with almost 80% win rate. The system focuses only Small and Steady Profits . It uses fixed stop loss for every signal to keep money management in place. As compare to other available indicators in market, HAWA gold has unique feature of displaying total profit and loss in terms of points where 1PIP=10points and Minimum profit is 10 pips. Its smart and advanced algorithm detects trend and trend strengt

Are you tired of drawing Support & Resistance levels for all charts of the same Symbol while doing Multi-Timeframe analysis? Well, if you are Price Action trader then this indicator will solve your problem. Draw on 1 Timeframe and it will auto-sync with other charts of the same Symbol. You can draw rectangles, lines, arrows, and eclipse. It will give an alert when touched/break on line and arrow. It work's on all Timeframe.
Major Update
Added::
1}Triangle
2}Fibonacci Retracement

The Multitimeframe-Candles (MCandles) - Indicator for MT5 shows the contour of an higher, free selectable, timeframe as an overlay on the current timeframe. You can freely choose the timeframe, number of candles and color of the overlays. The indicator only calculates the current candle frequently, so it saves computing capacities. If you like the indicator, please left a comment.

You ask yourself the question every time you open your charts: how to win in trading? Will using a lot of indicators work? well know that I also asked myself the same questions when I first started trading. After testing many indicators, I realized that winning trading is simple and accurate trading. after several months of thinking and optimizing I was able to find my solution: Candle Good Setup Candle Good setup is a trend and entry timing indicator analyzing the market in multi-frame to give

Volumes ******************* Volumes для платформы секундных графиков Micro . ********************* Секундный график на порядок увеличит точность ваших входов и выходов. Секундный период , в привычном формате, позволит увидеть то, что ранее было скрыто. Бесплатные индикаторы, дополнят визуальную картину, что, в совокупности выведет вашу торговлю на новый уровень. Идеально подходит как скальперам, так и трейдерам торгующим внутри дня. Индикатор Volumes для платформы Micro. Входные парам
FREE

Moving Average ******************* Moving Average для платформы секундных графиков Micro . ********************* Секундный график на порядок увеличит точность ваших входов и выходов. Секундный период , в привычном формате, позволит увидеть то, что ранее было скрыто. Бесплатные индикаторы, дополнят визуальную картину, что, в совокупности выведет вашу торговлю на новый уровень. Идеально подходит как скальперам, так и трейдерам торгующим внутри дня. Индикатор Moving Average для платформы Micr
FREE

MACD ******************** MACD для платформы секундных графиков Micro . ********************* Секундный график на порядок увеличит точность ваших входов и выходов. Секундный период , в привычном формате, позволит увидеть то, что ранее было скрыто. Бесплатные индикаторы, дополнят визуальную картину, что, в совокупности выведет вашу торговлю на новый уровень. Идеально подходит как скальперам, так и трейдерам торгующим внутри дня. Индикатор MACD для платформы Micro. Входные параметры:
FREE

MOUNTAINS:It is an indicator that detects market consolidations prior to a movement.
The objective of this indicator is to indicate the areas before the market makes a move.
The areas that we are interested in detecting are the PLATEAU, which are between the slopes.
When the system detects a PLATEAU , the trader must place his operation in that area, waiting for the increase in volatility to reach its target.
The best option to carry out the operation of the PLATEAU is th

DAILY STATS PANEL is a small panel that shows some statistic of opened chart. For example: Fibonacci resistance and support, daily average moving points and today's moving range, etc. After applied this expert advisor to chart, a small panel will be shown on the right. ** NOTE: This is not an algo trading expert advisor. **
Input parameters show_pivot - Whether or not to show pivot, resistance and support line on the chart. Pivot Color - R1-R4, Pivot and S1-S4 horizontal line colors.
Stati
QXSTREND Our "Support and Resistance" indicator shows the support and resistance levels using the ADX indicator, and create an arrow based on three ADX Periods on different levels.
Recommended TIMEFRAMES:- M15,M30 and H4 (For Long Term Target) 120 pips & Approximately M5 (For 30 Pips target) ENTRY SIGNALS:- You need to take trade based on Arrows if Green Arrow occurs then you need to buy if Magenta Down Arrow occurs then sell trade.
About QuantXsystem Products: – Simple installatio

Prices move for many reasons and these can vary from one operator to another: software, private and institutional traders simultaneously contribute to the formation of the price, making predictive art very difficult. However, there are measurable factors that bind the price to an underlying trend in line with the physical reality that the financial asset represents: these are the macroeconomic indicators. Large investors use this information wisely to set their strategies. Understanding these m

Se você é um trader ativo e busca uma maneira eficaz de interpretar os movimentos do mercado financeiro, você vai adorar conhecer o Weis Wave Box. Este incrível indicador foi projetado para oferecer uma análise visual clara e precisa das ondas de volume, juntamente com a plotagem dos pontos de swing correspondentes. Com suas cinco formas de swing personalizáveis e outras características exclusivas, o Weis Wave Box se destaca como uma ferramenta indispensável para traders experientes e novatos.

Indicador multimoeda e multitimeframe do Canal de Desvio Padrão. Exibe a direção atual do mercado. No painel você pode ver rompimentos e toques (por preço) dos níveis do canal de regressão linear. Nos parâmetros, você pode especificar quaisquer moedas e prazos desejados. Além disso, o indicador pode enviar notificações quando os níveis são atingidos. Ao clicar em uma célula, este símbolo e ponto final serão abertos. Este é o scanner MTF.
A chave para ocultar o painel do gráfico é “D” por padr

Indicator determines the direction of price movement, calculates the possibility of entering the market using an internal formula and displays a breakout entry signal. Indicator signals appear both at the beginning of trend movements and in the opposite direction, which allows you to open and close orders as efficiently as possible in any of the market conditions. Version for МТ4: https://www.mql5.com/en/market/product/58349
Benefits: a unique signal calculation formula; high signal accuracy;
FREE

The 4 headed dragon is an indicator that has two functions. 1) Set the background trend. 2) Mark the predominant trend. By combining these two indicator signals, we will be able to trade for or against the trend, adapting the signals to your reading of the market.
You can download the demo and test it yourself.
1) Set the background trend.
Define four possibilities of trend that are the four heads of the dragon, marked by colors on the indicator, marking a) Powerful buying trend. b)
The San Andres Fault is an indicator designed to detect the movements that make the market tremble. This system detects a tremor and marks its intensity in real time to decide in your operation. In addition, the recording of the sismic signal allows us to interpret movement patterns that help us in decision making You can download the demo and test it yourself.
The indicator has a text help in the upper right corner, in which it shows whether the indicator has a bullish or bearish b

This indicator will create bars in 4 deference colors. The Green Bar is Up Trend. The Red Bar is Down Trend. Lite Green Bar is No Trend (corrective or sideway) but still in Up Trend. Pink Bar is No Trend (corrective or sideway) but still in Down Trend. You can just looking at the Bar's Color and Trade in Green Bar for Long Position and Red Bar for Short Position. You can change all the colors in your way. 1. Alert function : Will popup Alert Windows and play sound when the Bar was changed.

Swing Point Volume , o indicador que sinaliza fraqueza e força nos topos e fundos. Este indicador pode ser usado no Método Wyckoff.
Informações fornecidas; - Swing em ticks customizados. - Volume e pontos em cada Swing realizado. - Porcentagem de Deslocamento. - Opção de Alerta sonoro nas rupturas de topos e fundos. - Volume em ticks e Real Volume. - Volume HL(extremos) ou (abertura e fechamentos) - Formas de volume customizadas.

Este indicador separa tendências (altistas e baixistas) de maneira simples. Sempre que tiver a possibilidade de uma tendência longa aparecerá a coloração vermelha (baixa) e verde (para alta). O ponto benéfico deste indicador é que se torna possível pegar a tendência inteira de uma determinada operação. O candle verde depois de uma longa tendência de baixa significa que este é um bom momento para a compra. Já o candle vermelho, depois de um longo momento de compradores, significa um bom momento

Genetic Code , is an indicator that differentiates two types of market: the market in range and the market with volatility.
This indicator allows the trader to choose whether to use a range trade or a volatility trade. You can download the demo and test it yourself.
When observing the trace of the indicator it shows us narrow areas that correspond to market ranges.
These ranges always end with a volatility process, so you can work with two conditional pending orders.
When th

DNA is an indicator that allows us to operate both in favor of a trend and a pullback.
You can download the demo and test it yourself.
Trend trading is above zero and pullback trading is below zero.
The direction of the operation is marked by the color of the line.
If the line is green it corresponds to purchases.
If the line is red it corresponds to sales.
For example, if the green line is above zero and growing, we will have an uptrend operation. If the red line is above zero and

The background trend is an indicator that helps us to know the trend that is dragging the market. The indicator has 2 possibilities: 1) If the indicator is above zero the trend is buying and the indicator will be green.
2) If the indicator is below zero, the trend is selling and the indicator will be red.
You can download the demo and test it yourself.
The indicator has a text help in the upper right corner, in which it shows whether the indicator has a bullish or

O indicador Magic Histogram MT5 é uma ferramenta universal, adequada para escalpelamento e negociação de médio prazo. Este indicador usa uma fórmula inovadora e permite determinar a direção e a força da tendência. Magic Histogram MT5 não é redesenhado, então você pode avaliar sua eficiência usando dados de histórico. É mais adequado para M15, M30, H1 e H4.
Benefícios do Indicador Excelentes sinais indicadores! Adequado para iniciantes e comerciantes experientes. Usando as configurações flex
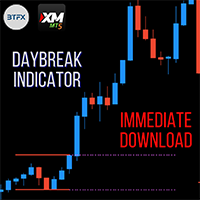
O indicador Daybreak criado por Best Trades Fx marca as zonas para observar um rompimento durante a abertura do mercado de Londres. As zonas são definidas em GMT + 2 como padrão, para que isso seja eficaz em sua plataforma, você deve selecionar a hora de início para corresponder às 12h GMT e a hora de término para corresponder às 7h GMT, dependendo do servidor da sua corretora. Este indicador pode ser usado em todos os símbolos. Assista ao vídeo do Youtube para uma explicação mais aprofund
Os Canais de Keltner, são poderosas ferramentas da análise técnica com o intuito de aproveitar as oportunidades criadas pela volatilidade dos preços. O indicador foi desenvolvido originalmente pelo americano Chester W. Keltner, na década de 1960, e é bastante utilizado, em especial no mercado americano.
Porém apesar da alta usabilidade no mercado, o Keltner Channel sofre com um problema de ter apenas 2 canais, o que dificulta muito saber a hora certa de entrar ou sair em uma posição. Sendo a

O BTFX Pivot Points é um indicador que calcula os níveis de Suporte e Resistência para cada dia. Ao usar este indicador, os níveis de pivô apontam objetivos claros. Os níveis de resistência são mostrados em roxo acima da linha de pivô prateada. Os níveis de suporte são mostrados em laranja e podem ser encontrados abaixo da linha de pivô prateada. Este indicador funciona muito bem quando usado com o indicador BTFX Daybreak. Para uma explicação mais detalhada sobre esses indicadores, ass

Fazer trades pode ser um tanto cansativo quando você precisa olhar várias coisas ao mesmo tempo. Formato dos candles, suportes, resistências, horários, notícias e indicadores. Essa ferramenta tem o objetivo de facilitar a análise do indicador ADX. Ele colore os candles baseado nos níveis do indicador e das linhas DI. O período,o limite do indicador e as cores dos candles são personalizáveis. Você também poderá colocar uma ajuda visual do lado direito inferior do gráfico para visualizar os valo
FREE
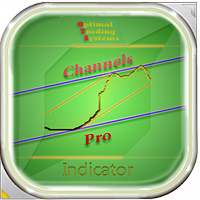
Este indicador determina os canais ao longo dos quais os preços se movem no histórico de negociação. Existem muitas estratégias de negociação que dependem da negociação de canal em um rompimento de canal. Este indicador pode desenhar canais de preços lendo informações de vários períodos de tempo ao mesmo tempo (do atual, do segundo e do terceiro). Você pode personalizar a cor e a espessura das linhas para cada período. Além disso, você pode definir uma distância diferente entre altos e baixos pa

Sinais de compra e venda baseados no Setup Armadilha Day Trade (DT TRAP), popularizado no Brasil por Alexandre Wolwacz (STORMER), para falhas de rompimento.
Como o indicador funciona? O indicador ativa o sinal de compra ou venda quando suas respectivas condições são atendidas. Para uma compra, é preciso que o candle faça uma mínima menor que a mínima do dia anterior. Neste momento, será plotado o sinal com a cor secundária. Para uma venda, é preciso que o candle faça uma máxima maior que a m

The RealCryptoLevels indicator by downloading the order book of crypt exchanges with maximum depth shows horizontal volumes of popular crypto currencies on the chart, so you can see not only the volumes, but also the levels and them strength (see screenshots), which is very important for successful trading in all strategies from scalping to medium-term trading, because you can see the preferences of buyers and sellers at the moment and their mood for the future. The indicator pulls volume data

This indicator significantly expands the capabilities of the usual ZigZag due to the addition of parabolic channels at the earliest stage of their origin. Download the demo version and test it in the tester. All graphics in the tester are working. But the ZigZag algorithm is special here, because it is implemented on a unique author's ultrafast loop-less algorithm for calculating parabolic regression and calculating its standard deviation. The features of this ZigZag are: Fast calculation, rega

TClusterSearch - индикатор для поиска кластеров согласно заданным критериям. Для работы индикатора требуются реальные биржевые обьемы. Основная функциональность
Поиск и визуализация кластеров с обьемом, задаваемым фильтрами (до трех). Для каждого фильтра можно задать свой цвет. Поиск и визуализация кластеров с дельтой большей значения задаваемым фильтром Поиск и визуализация кластеров по бид/аск согласно фильтру Возможность фильтровать кластера в зависимотсти от его положения относительно б

As Bandas de Bollinger estão entre os indicadores mais utilizados na análise técnica, o seu autor é o americano John Bollinger, analista financeiro e grande colaborador da área. John começou a desenvolver essa técnica na década de 1980 e em 2001 lançou o seu livro Bollinger on Bollinger Bands.
As bandas de Bollinger são muito úteis para indicar níveis de preço em que uma ação pode ter se valorizado ou desvalorizado demais, além de indicarem sinais de Topos e Fundos. O indicador é calculado a
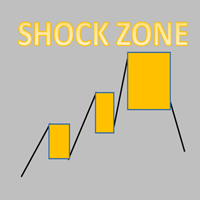
Every trading shock range is a point of gaining momentum!
The stop loss is generally the height of the shock zone.
Take profit depends on personal preference and market position. Generally at least double the height of the shock zone. Being in a good market position, it can have a profit-loss ratio of 5-10
Necessary for traders: tools and indicators Waves automatically calculate indicators, channel trend trading Perfect trend-wave automatic calculation channel calculation , MT4 Perfect

Provide ideas for trend trading.
Automatic calculation and generation of trend channels.
The channel line, also known as the pipeline line, is to draw a straight line parallel to the trend line in the opposite direction of the trend line, and the straight line crosses the highest or lowest price of the recent period. These two lines run the price in the middle and have obvious pipe or channel shapes. Necessary for traders: tools and indicators Waves automatically calculate indicators, chann
O Mercado MetaTrader oferece um local conveniente e seguro para comprar aplicativos para a plataforma MetaTrader. Faça download de versões de demonstração gratuitas de Expert Advisors e indicadores a partir do seu terminal para testes no Testador de Estratégia.
Teste os aplicativos em diferentes modos para monitoramento do desempenho e assim fazer um pagamento para o produto que você deseja, usando o sistema de pagamento MQL5.community.
Você está perdendo oportunidades de negociação:
- Aplicativos de negociação gratuitos
- 8 000+ sinais para cópia
- Notícias econômicas para análise dos mercados financeiros
Registro
Login
Se você não tem uma conta, por favor registre-se
Para login e uso do site MQL5.com, você deve ativar o uso de cookies.
Ative esta opção no seu navegador, caso contrário você não poderá fazer login.