Conheça o Mercado MQL5 no YouTube, assista aos vídeos tutoriais
Como comprar um robô de negociação ou indicador?
Execute seu EA na
hospedagem virtual
hospedagem virtual
Teste indicadores/robôs de negociação antes de comprá-los
Quer ganhar dinheiro no Mercado?
Como apresentar um produto para o consumidor final?
Novos Indicadores Técnicos para MetaTrader 5 - 23

filling It is an oscillator indicator, where it clearly marks sale and purchase, It has two colors, red and blue. red marks you buy, and blue marks you for sale, ideal for scalping and lengths! works for forex markets works for synthetic index markets ideal for volatility and jumps! It also works for crash and boom! walk in all temporalities! Good profit! World Investor.

macd rsi It is a macd indicator added to the rsi to capture perfect entries in the average crossovers! As seen in the indicator, it has 2 lines, one of gold color and the other violet line, where the cross of the violet with the gold downwards is a sell signal when it crosses the violet up from the gold it is a buy signal! very good to make shorts works for forex markets and synthetic indices It is used in any temporality! Good profit! World Investor.
The concept of Harmonic Patterns was established by H.M. Gartley in 1932. Harmonic Patterns create by 4 peak (ABCD) or 5 peak (XABCD). In traditional, we have BAT pattern, Gartley pattern, butterfly pattern, crab pattern, deep crab pattern, shark pattern. Each pattern has its own set of fibonacci. In this indicator, we add more extended pattern named ZUP pattern. So we have total 37 pattern as follow This indicator detects all above patterns, takes fibonacci projections as seriously as you do,

Extreme indicator! is an oscillator that works with candle volume levels, where it consists of red and green colors, where you measure the sale and purchase! where it also comes with a line crossing format where it reconfirms the purchase or sale on this occasion, works for forex markets and for the synthetic index markets ! It works for all seasons! Good profit! World Investor.

Color range ! It is an indicator that indicates the volume of the candle giving you input or output depending on the color you touch on the candle! It works perfect for making H1 or H4 lengths! It also works for scalping but ideal for long! works at any time works for forex markets for synthetic index markets !!! also for crypto. Good profit!!!!!! World Investor.

extend ! is an oscillator indicator, Where you measure bullish and bearish trends ideal for scalping and lengths! The strategy consists of the crossing of lines, where it has 2 types of lines, one blue and one green! where the blue line crosses over the green line gives entry signal, where the green line crosses below the blue line gives a sell signal! It works for all seasons! Good profit! World Investor.

Swing Line! It is an indicator that easily captures a trend channel, be it bullish or bearish! being able to easily hunt the rebounds, long and short, as well as rebound support and resistance of the channel! The indicator is suitable for any temporality! very good for scalping and long! works for forex markets and synthetic indices also crypto! good profit World Investor .

Trendline! trend line indicator, support and resistance, ideal for hunting long and short! where it uses 2 lines, the red and the blue, the red one marks rebounds for sales, the blue one marks you rebounds for purchase And not only that, but it also marks you, the uptrend and downtrend. works for any season works for forex markets and synthetic indices! also crypto. Good profit! World Investor.

Stellar volume. is an oscillator, indicating the high ranges and the low ranges. marking the ceiling and floor of each trend on the oscillator, where the violet line crosses the gray line gives a purchase entry, where the violet line crosses the red line downwards gives a sell signal, very easy to use and very simple, works for forex markets and synthetic indices! and for any temporality to operate. Good profit! World Investor.

Ma Distance Parabolic! is a moving average indicator with parabolic sar ! ideal for hunting trends where there are two ideal points showing input there are 2 points where there are blue points that mark the rise and the other green point where it marks the drop The indicator gives you the entry signal when it gives the second point the position is taken. suitable for forex and synthetic indices, also crypto! Good profit! World Investor.

Zigzag Oscillator. it is an indicator programmed to hunt each point of the zigzag of the candle! as in the foreground of zigzag this oscillator takes you to simple measurements, to catch every bounce from floor to ceiling! Ideal for scalping and intraday. works for any season! for all forex pairs! for all pairs of synthetic indices ideal for volatility 75 and other jumps! Good profit! World Investor.

Oscillator Moving ! is an oscillator where it has 3 input points where is the orange line, the red line and the blue line where the orange line touches the ceiling of the blue line, it gives a buy entry signal. where the red line crosses the blue line gives a sell signal! very clear to see and very simple to use! It can be used at any time! can be used in Forex markets. In the synthetic and crypto index markets! good profit World Investor.

High Low Expert! It is an indicator where it marks the high and lows in the short and long term works like demand and supply and support and resistance too Ideal for scalping in M1, it also works for longs in H1 or H4! works for all temporalities, works for forex markets and for the synthetic index markets ! ideal for volatility pairs and jumps It also goes in crypto! good profit World Investor.

Bear Bull! It is an indicator that marks with Heikin Ashi candles but modified, the sales and purchases long and short trend! with 2 colors green marks the purchase, purple marks the sale, works for any type of temporality, works for forex markets and synthetic indices! ideal for any pair, it also works for crypto pairs, Good profit! World Investor - World Inversor -

Crash Scalper sign! is a programmed flag %100 for the crash , where it has the scalping function in M1 where it sends you input signals with the blue arrow and exit signs with the arrow board, Its principle is scalping from 2 to long candlestick trends, the exit arrow will always mark you, sending you a signal message, It also has a message for email and cell phone message where it sends you the signals! It works for all seasons! Good profit! World Investor.

Boom Scalper! is a programmed flag %100 for the Boom index, can be used on the boom 1000, 500 and 300 works for scalping M1 and longs at any time frame always sending you the signal with a purchase message and the sign where it is sold, It has the system to send email as a signal and message as signal In case you are not on your desktop PC so you do not miss any signal! Good profit! World Investor.

Este indicador pode identificar mais de 60 padrões de candles no gráfico, incluindo suas variantes de alta e baixa. Basta escolher nas configurações o padrão que deseja.
Padrões Disponíveis 2 Crows Gravestone Doji On Neck 3 Black Crows Hammer Piercing 3 Inside Hanging Man Rick Shawman 3 Line Strike Harami Rising and Falling Three Method 3 Outside Harami Cross Separating Lines 3 Stars in South High Wave Shooting Star 3 White Soldiers Hikkake Short Line Abandoned Baby Hikkake Modified Spinning T
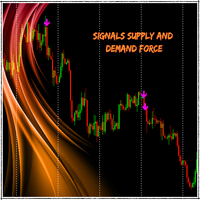
Este Indicador esta basado en el rebote de un soporte o resistencia fuerte con un indicador que tiene interno de fuerza de movimiento. Tiene la opción de ver el soporte y resistencia actual y ver la fuerza que tiene dicho soporte o resistencia.(Activando el parámetro Ver_Sop_Res ) Parámetros: Sop o Res, Fuerza Mayor a...: Con este parámetro podrás ajustar la fuerza del soporte o resistencia, con la cual el indicador evaluara si es una señal bajista o alcista. Velas Historial: Con este parámetro

Recommended broker to use the indicator: https://tinyurl.com/5ftaha7c Indicator developed by Diogo Sawitzki Cansi to show possible trade points. Do not repaint. The results displayed in the past are exactly what happened. We also use it to hold trades longer and not get out on false reversal signals which are actually just a profit taking of trades and no one is trying to reverse the direction of the trend. Indicator Parameters: PERIOD: Period for analyzing the buying or selling force to fin
FREE
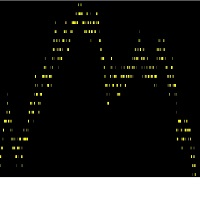
grafico de media os dados são exibidos pela media aritimetica dos negocios realizados, evitando as distorções dos outros graficos. A forma de operação e pela busca de padrões. o parametro e para reduzir as distorções, diminuindo as interferências, quanto menor for o valor mais alinhado o grafico fica. ativos mais lentos são o ideal, atualmente estou usando no dollar canadense.
FREE
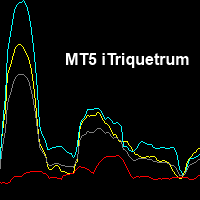
Индикатор показывает отклонения корреляции трех валютных пар, после резкой волатильности пар возвращает их к состоянию сбалансированости Выбор периода отклонения даст возможность наблюдать за более длительными отклонениями Цветные линии хорошо помогают распознать на какой валютной паре произошло отклонение цены, можно наблюдать как резко уходят цены по всем парам, и возвращаются к своему среднему значению
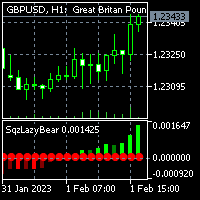
For MT4 version please click here . - This is the exact conversion from TradingView source: "Squeeze Momentum Indicator" By "LazyBear". - This is a non-repaint and light processing load indicator. - Buffers and inputs are available for use in EAs and optimization purposes. - You can message in private chat for further changes you need.
Thanks for downloading...

UR Vortex MT5
The Probabilistic UR Vortex Formula: An Accurate System for Predictive Market Analysis using Volatility and Standard Deviation Calculations. The UR Vortex MT5 indicator is a technical analysis tool that uses volatility and standard deviation calculations to predict potential tops and bottoms in a market. It measures the strength of a trend by calculating the distance between the current price and a moving average, and then standardizing this distance by dividing it by the average
Volatility Crusher Indicator is a Non-Lag MT5 indicator which detect trades on any time frame. The indicator has alerts to buy and sell once a trade has been detected. It will also send pop-up signal to your mobile phone and you can trade anywhere you are with your phone while its generating signals for you on PC connected to VPS. Its recommended on m5 to h4 time frame on any pair on Deriv MT5 Broker. Pairs recommended: Volatility Index 10, Volatility Index 25, Volatility Index 100 Volatility I
Stochastic cross alert signal overlay is indicator show signal buy and sell you can attach it easy in your chart mt5, it work all time frame it work all time frame Setting: input int KPeriod=5; input int DPeriod=3; input int Slowing=3; input ENUM_MA_METHOD MA_Method=MODE_SMA; Contact me immediately after the purchase to get the settings and a personal bonus!

Previous Period High Low . This indicator shows the previous Day, Week, Month and Years High and Low. It's great for price action strategies. : Provides clear and visible breaks in structure. : Easy to see breakout levels. : Easy to see gaps between previous high, low levels after breakouts have occurred. The indicator works on every time frame. Multiple periods can be selected and be seen on the same chart. Every line can be customized to Your liking. Color, style and thickness. Enjoy!

Todos os 11 indicadores desligam e ligam rapidamente!
Conjunto de indicadores:
2 indicadores "TENDÊNCIA" :
- rápido = linha 4 cores - lento = pontos 4 cores
A coloração dos indicadores depende da direção da tendência e do indicador RSI: 1) tendência de alta e RSI <50% 2) tendência de alta e RSI>50%
3) RSI de tendência de baixa <50%
4) RSI de tendência de baixa > 50% Defina os períodos do indicador para cada período de tempo: M5 M10 M15 M30 H1 H2 H4 H6 H12 D1 W1 MN
Não entre em

UPDATED The Non-Repaint zones is a time base indicator that scans for possible reversal of the market for perfect entry. It read the history and draws the possible zone for our comfort. The indicator possesses four different zones that read the history of the market over 10,000 previous bars and predict the possible entry point. It rescans every market trend change to give us the possible zone, it is used for trading all types of markets and does not repaint. The indicator has the following inp
FREE

UR Gama (alimentado por cálculos semelhantes encontrados em sistemas de aprendizado de máquina)
O UR Gamma é uma ferramenta de análise financeira de ponta que oferece uma visão nova e aprimorada do clássico indicador WaveTrend. Ao incorporar técnicas avançadas de Processamento de Sinal Digital, o UR Gamma aborda algumas das limitações dos algoritmos WaveTrend tradicionais e fornece uma abordagem mais precisa, robusta e dinâmica para identificar e medir tendências na ação do preço.
Vantagens

Pivot Classic, Woodie, Camarilla, Fibonacci and Demark Floor/Classic Pontos pivô, ou simplesmente pivôs, são úteis para identificar possíveis níveis de suporte/resistência, faixas de negociação, reversões de tendência e sentimento do mercado, examinando os valores alto, baixo e de fechamento de um ativo. Os Pontos Pivot Floor/Classic podem ser calculados da seguinte forma. Pivot Point (P) = (High + Low + Close)/3 S1 = P * 2 - High S2 = P - (High - Low) S3 = Low – 2*(High - P) R1 = P * 2 - Low R2
FREE

ICT Core Content Concepts turned into indicator plus all previous tools known from the Position Smart Indicator . This makes it the Full PSI Private Version ( read more ) restricted up to now but available only after the Mentorship Core Content was made public on YouTube. You will find many price action study tools like: Central Bank Dealing Range - CBDR Asian Range FLOUT Profiles and SD targets on the CBRD, Asian Range and Flout both on the wicks and on the bodies Seek & Destroy Prof
Imagine a way to automatically and clearly recognize the direction of the current market. Uptrend or Downtrend?
Forget about moving averages, there is a simple way to determine that. Welcome to the world of statistics. Welcome to the simple yet powerful world of Linear Regression. Just a complicated name for a genius and simple measurement.
Calibrating this indicator is pretty clear and obvious since the degree of freedom is total and deep.
Once calibrated to your desired Symbol/Asset,

This indicator can be considered as a trading system. It offers a different view to see the currency pair: full timeless indicator, can be used for manual trading or for automatized trading with some expert advisor. When the price reaches a threshold a new block is created according to the set mode. The indicator beside the Renko bars, shows also 3 moving averages.
Features renko mode median renko custom median renko 3 moving averages wicks datetime indicator for each block custom notificatio
FREE

FRB Trader - Nossa missão é proporcionar o melhor suporte para os clientes, por meio de conteúdo e ferramentas, para que eles possam alcançar os resultados esperados. - Se você tiver alguma dúvida ou sugestão, entre em contato conosco. Seu feedback é muito importante para nós.
FRB Agressão de Compra
O indicador mostra o Saldo da Agressão de Compra do TIMEFRAME escolhido pelo usuário por meio de um histograma em uma nova janela. Este indicador só pode ser usado se a corretora fornecer dados so

FRB Agressão de Venda
- Indicador mostra o Saldo da Agressão Vendedora do TIMEFRAMES escolhido pelo usuário através de um histograma numa nova janela. - Este indicador só pode ser usado se a corretora informa os dados sobre os Volumes. As corretoras do mercado forex não informam esses dados. - B3 (Bovespa) informa os dados e com isso é possível usar nas corretoras brasileiras.
Configurações Cor - Definir a cor que será mostrada no histograma. Usar Dados Históricos - Define se o indic

FRB Saldo de Agressão
- Indicador mostra o Saldo da Agressão do TIMEFRAMES escolhido pelo usuário através de um histograma numa nova janela. - Este indicador só pode ser usado se a corretora informa os dados sobre os Volumes. As corretoras do mercado forex não informam esses dados. - B3 (Bovespa) informa os dados e com isso é possível usar nas corretoras brasileiras.
Configurações Cor - Definir a cor que será mostrada no histograma. Usar Dados Históricos - Define se o indicador irá calc

This indicator allows the trader to see what is difficult to see and recognize with the eyes.
The indicator naturally recognizes and visualizes all processes in the behaviour of a trading instrument, which will be an excellent assistant for a trader who likes to make decisions on his own.
This indicator draws a set of approximating channels in all sections of history with different periods. Formed channels form naturally and form their own hierarchy of channels by seniority (length and width

** All Symbols x All Timeframes scan just by pressing scanner button ** *** Contact me after the purchase to send you instructions and add you in "M W Scanner group" for sharing or seeing experiences with other users. Introduction: Double Top(M) and Double Bottom(W) is a very repetitive common type of price reversal patterns. Double Top resembles M pattern and indicates bearish reversal whereas Double Bottom resembles W pattern and indicates a bullish reversal that they have high win r

The Supertrend etradro indicator is volatility based and is more of a trend following indicator in function. The ATR indicator, which is integrated into the calculation of the super trend, also calculates course gaps (gaps) and does not overlook them. This allows more accurate values to be calculated. When measuring volatility, the mean value of the current price serves as the basis. Since the Supertrend indicator features sliding stop and reversal lines, it is quite similar in function to the P
FREE

Introducing our new Indicator: "Draws the Open Price Line for every Timeframe Automatic" ...an essential tool for any trader looking to improve their visual perception and establish patterns in their trading behavior and strategy. This indicator is designed to work on all timeframes that MetaTrader 5 supports, and can be individually activated and customized according to your preferences. The indicator draws the open price line of a new starting bar in different colors for each timeframe, making

This Oscillator describes the drift of an asset, as part of the geometric Brownian Motion (GBM). As a data basis the mean reverting log returns of the asset price is considered. It gives the percentile of drift directional. For instance, a value of 0.05 means a drift of 5%, based on the selected sample size. If the value is positive, drift to higher asset values is determined.
This indicator should be used in confluence with other indicators based on volatility, probability and statistics. L
FREE
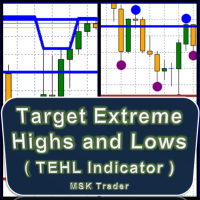
TEHL Indicator is an automatic indicator designed and optimized to highlight the highest highs and the lowest lows in several convenient ways. Using deep calculations, it spots the extreme highs and lows automatically, and facilitates to you defining the resistance and support levels. The indicator has several options for changing marking icon, drawing style, bars range (period) and more as will be detailed below. This indicator does very well along normal and consolidation (aggressive) zones.

This powerful tool is designed to help traders identify key reversal patterns in their charts, including the hammer and star bar formations. With this indicator, you can quickly and easily spot these patterns as they form, allowing you to make well-informed trades and potentially increase your profits. The Hammer Start indicator is customizable, allowing you to set your own parameters for identifying patterns and alerts. Whether you're a seasoned trader or just starting out, the Hammer and Star
FREE
The ORB The Opening Range Breakout or the OPR 'Open Price Range' MT5 Indicator is a powerful tool designed to enhance your trading experience by automatically tracking market openings range, custom ranges, sessions, and Asian ranges. This dynamic indicator is perfect for price action traders, offering unparalleled precision and accuracy without any manual effort. Key Features: London ORB The Opening Range Breakout : Automatically displays the London open price range. New York ORB The Openin

Stochastic Professional 3 in 1! It is an indicator programmed to operate professionally! and very easy to use where it gives you alerts, marks sales and purchases, sending you alerts at any time, where you reconfirm the entry with green and red arrows for sale and purchase very effective for scalping and lengths! suitable for Forex and synthetic indices! Good profit! World Investor.

MULTI MARKET SPEED INDICATOR FOR MARKET FLOW & PERFORMANCE CATEGORIZING Specially developed for pattern detection and multi market and cross / intermarket research, volatility , and performance research. Measure in real time, speed & performance on multi markets Detect price and time cycles , squeezes, performance, pattern in structure, pattern in price and structure, patterns over different individual markets and how they move together, time and price action and of course upcomin

Arrows Scalp Oscillator indicating buying and selling, It is added with arrows that indicate sell and buy, moving average crosses where they indicate the break to enter better being the sale or the purchase! perfect for scalping! in the Forex markets and synthetic indices! It also works for crypto! Suitable for any period of time, it can also be used for lengths! Good profit! World Investor.

Renko Gold! clearly indicates the floors and ceilings where it goes from 4 lines, the line below that marks the floor in green confirming with the thinnest line clarifies the purchase entry, the same is for sale, the top line marks the ceiling and the thinnest red line marks the sale, This indicator works for all temporalities! For Forex and Synthetic Indices markets! It also works for crypto markets! Good profit! World Investor.

Professional Channel! indicator that clearly marks the bullish and bearish channels also marking support and resistance! the line has 3 colors where the green color marks buy! the blue line is rebound and the red line is the one that marks the ceiling, that is, the sale! works for all seasons for forex markets and synthetic indices also for crypto markets! good profit World investor.

Ichimoku technic . is a candlestick indicator, which captures bullish and bearish trends according to its sail color! where there are breaks, it also captures with candle colors, The 2 most important colors to hunt trends are red and aqua, where clearly by color it tells you when it goes up or down, Serve for all seasons! It works for the forex markets and synthetic indices, also crypto! World Investor. Good profit!

Supply and demand Professional. It is an indicator of supply and demand clearly, It indicates with colors where it marks the different areas of supply and demand, trading volume. support zone low , support zone high , resistance zone low , resistance zone high works for all seasons works for forex markets and synthetic indices! It works for scalping and longs! World Investor Good profit!

Parabolic Professional. is a parabolic sar indicator, programmed better to better catch the entries, where it throws red dots, gives upload input, where it puts gray dots, gives point of sale, perfect for making lengths of H4, and H1 It is also used for scalping, It works at any time. suitable for forex and synthetic indices, also crypto, World Investor , Good profit

Step ma, It has a band indicator where it gives you inputs, when the candle leaves the band, it's called step ma, It is used in all temporalities, ideal for scalping, long can also be done It has 2 colors of bands on the lower side and red on the upper side and the rebound line is blue. works for forex markets works for synthetic index markets ! for all pairs! World Investor, Good Profit!

ATR Professional. is an indicator similar to the bollinger, but this back is more advanced to scalp and long in h4 or h1, It has its bands, the strategy is that it marks entry when the candle leaves the band, or does it bounce on the upper roof or lower floor, works for all seasons! works for forex markets and synthetic indices also crypto! Good profit! World Investor.

MT4 Version Kill Zones
Kill Zones allows you to insert up to 3 time zones in the chart. The visual representation of the Kill Zones in the chart together with an alert and notification system helps you to ignore fake trading setups occurring outside the Kill Zones or specific trading sessions. Using Kill Zones in your trading will help you filter higher probability trading setups. You should select time ranges where the market usually reacts with high volatility. Based on EST time zone, f

MT4 Version Kill Zones SMT Divergences Order Blocks ICT
The Order Blocks ICT indicator is a powerful tool for traders looking to gain an edge in the market. This indicator is based on the order flow and volume analysis, which allows traders to see the buying and selling pressure behind the price action. This information can be extremely valuable in identifying key levels of support and resistance, as well as potential turning points in the market. The Order Blocks ICT indicator is easy to u

Unlock the power of the market with the Investment Castle Multi Time Frame Moving Average Indicator. Simplify your trading journey by easily identifying trends and pullbacks across multiple time frames on one convenient chart. This indicator is a must-have tool for any serious trader. Available for MT4 and MT5, and exclusively on the MQL5 market, customize your experience by adding as many indicators as you need on the chart, each with their own unique time frame or period. Enhance your strat
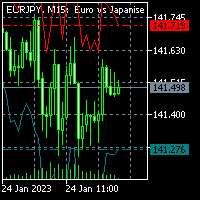
For MT4 version please click here . This is the exact conversion from TradingView: "Average True Range Stop Loss Finder" By "veryfid". - This indicator implements a deviation channel. - The channel determines trend direction as well as stop loss placement. - This is a non-repaint and light processing load indicator. - You can message in private chat for further changes you need.

AC Pivot Panel
AC Pivot Panel is a pivot point indicator including favorite selection panel accessible in the chart. For pivot traders, It is well convenient to easily and quickly can adjust their pivots setting in the chart. To reaching this goal, a panel has been considered to user can easily switch to each pivot levels by different method and time period. In the current version: All pivots including supports and resistance can be selected to display or disappear in the chart just by
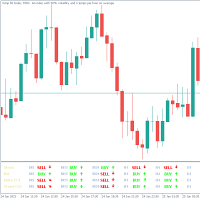
The Trend Assistant indicator is a technical analysis tool that helps traders identify the current trend of a financial instrument by analyzing different timeframes on a chart.
The indicator shows the trend based on M1 (1 minute) , M5 (5 minutes) , M15 (15 minutes) , M30 (30 minutes) , H1 (1 hour) , H4 (4 hours) , D1 (1 day) , W1 (1 week) , and MN1 (1 month) timeframes. The trend is represented by a colored arrows on the sub window chart, with a bullish trend shown in green and a bearish tre

The EMA Engulfing Cross indicator is an indicator for the MetaTrader 5 platform that signals potential buy and sell opportunities based on an engulfing candle pattern after a recent exponential moving average cross. You can adjust how recently the trend change must have occurred using the PASTemaCROSS input. The RSI oversold/overbought function is used to confirm the signals generated by the moving averages. It takes into account the previous bar before the engulfing bar, and it is best used wi

The Rubdfx swing indicator is a useful tool for traders looking to identify trend changes in a particular instrument they are trading. It is designed to draw a line on the main chart, and the signals are indicated by color changes with signal alerts. The color green is used to indicate a bullish trend, while the color pink is used to indicate a bearish trend. These colors can be customized to fit the trader's preferences or theme. The Rubdfx swing indicator has the ability to spot both long-te

The rubdfx divergence indicator is a technical analysis tool that compares a security's price movement. It is used to identify potential changes in the price trend of a security. The indicator can be applied to any type of chart, including bar charts and candlestick charts.
The algorithm is based on MACD, which has been modified to detect multiple positive and negative divergences. Settings
___settings___ * fastEMA * slowEMA * signalSMA *Alerts: True/False
#Indicator Usage
B
Think of an indicator that instantly shows you all supports, resistances and turncoats and can send a notification to your phone or an alarm on your computer. In addition to all these, it groups how many times it has entered each field and, accordingly, the strength of the field. Supply Demand And Turncoat is at your service. Setup for any TimeFrame and Chart you want and enjoy easy trading. Features: Ability to select the fields to be shown (weak, untested, turncoat, verified, proven) Merge fie

O Indicador de Tempo das Sessões de Negociação:
O "Indicador de Tempo das Sessões de Negociação" é uma poderosa ferramenta de análise técnica projetada para aprimorar sua compreensão das diferentes sessões de negociação no mercado Forex. Este indicador integrado de forma transparente fornece informações cruciais sobre os horários de abertura e fechamento das principais sessões, incluindo Tóquio, Londres e Nova York. Com o ajuste automático do fuso horário, ele atende aos traders globalmente,
FREE
Pode ser aplicado a qualquer ativo financeiro: câmbio, criptomoeda, metal precioso, ações, índice. Fornecer pontos de negociação precisos para lhe dizer o melhor momento para abrir e fechar posições. Comum a especialistas e iniciantes O guia passo a passo do usuário usa exemplos especiais para explicar como manipular indicadores, mesmo que você os use pela primeira vez. Este indicador considera os valores de três dimensões: tempo, preço e valor quadrado médio Sem redesenho do sinal de entrada S

** All Symbols x All Timeframes scan just by pressing scanner button ** *** Contact me immediately after the purchase to send you instructions and add you in "Market Structure group" for sharing or seeing experiences with other users. Introduction: Market structure is important for both new and professional traders since it can influence the liquidity and price action of a market. It’s also one of the most commonly used techniques to understand trends, identify potential reversal points,

Contador de Candle Este produto faz a contagem dos candles e mostra o resultado conforme a configuração definida pelo usuário. Traders profissionais usam para enfatizar um candle específico.
Configuração Posição - Escolher se os números serão apresentados acima ou abaixo do candle Distância - A distância que o número terá do candle, referente a mínima ou máxima Tamanho da Fonte - Tamanho da fonte Cor - Cor da Fonte

Máxima e Mínima de Candles
Indicador que mostra a Máxima e Mínima de X candles através de uma linha.
Configurações Números de Candles para o cálculo - Definir a quantidade de candles para o indicador achar a máxima e a mínima daquele período de candles. Continuação da Linha até a margem direita - Se você deseja que a linha da Máxima e Mínima se estenda até a margem direita do gráfico Cor da Linha de Máxima - Definir a cor da linha de máxima Style da linha de Máxima - Definir o estilo da linha

Pontos Importantes do Dia Indicador que mostra os pontos considerados importantes de X dias. (Abertura, Fechamento, Máxima, Mínima). Usado bastante por quem faz Day Trade, esses pontos podem ser usados para a tomada de decisão de um trader.
Configuração Máxima/Mínima/Fechamento/Abertura Show - Mostrar Days - Quantidade de dias que irá mostrar no gráfico Color - Cor da Linha Style - Estilo da linha
O Mercado MetaTrader é a única loja onde você pode baixar um robô demonstração de negociação gratuitamente para testes e otimização usando dados históricos.
Leia a visão geral e opiniões de outros clientes sobre os aplicativos, faça o download para o seu terminal e teste um robô de negociação antes de comprá-lo. Apenas no Mercado MetaTrader você pode testar um aplicativo de forma absolutamente gratuita.
Você está perdendo oportunidades de negociação:
- Aplicativos de negociação gratuitos
- 8 000+ sinais para cópia
- Notícias econômicas para análise dos mercados financeiros
Registro
Login
Se você não tem uma conta, por favor registre-se
Para login e uso do site MQL5.com, você deve ativar o uso de cookies.
Ative esta opção no seu navegador, caso contrário você não poderá fazer login.