Conheça o Mercado MQL5 no YouTube, assista aos vídeos tutoriais
Como comprar um robô de negociação ou indicador?
Execute seu EA na
hospedagem virtual
hospedagem virtual
Teste indicadores/robôs de negociação antes de comprá-los
Quer ganhar dinheiro no Mercado?
Como apresentar um produto para o consumidor final?
Novos Indicadores Técnicos para MetaTrader 5 - 35

Dark Support Resistance is an Indicator for intraday trading. This Indicator is programmed to identify Support and Resistance Lines , providing a high level of accuracy and reliability.
Key benefits
Easily visible lines Only the most important levels will be displayed Automated adjustment for each timeframe and instrument Easy to use even for beginners Never repaints, never backpaints, Not Lag 100% compatible with Expert Advisor development All types of alerts available: Pop-up, Email, Pus
Big promotion! , prices are now on discount , get your copy now The Rubdfx Price Tracker that is used to show price price bound , the price almost never goes out of the channel and most of the time price will react when it touches the channel limits .It determines the best highest and lowest prices at which you can sell and buy respectively Suitable for scalping & swing trading It Draws arrows that appear after a candle close , The arrows indicate bullish or bearish pressure For bearish an

The market price usually falls between the borders of the channel .
If the price is out of range, it is a trading signal or trading opportunity.
Basically, Fit Channel can be used to help determine overbought and oversold conditions in the market. When the market price is close to the upper limit, the market is considered overbought (sell zone). Conversely, when the market price is close to the bottom range, the market is considered oversold (buy zone).
However, the research can be used

Automatic Trend Line Fit. This indicator automatically plots the straight line and parabolic (curved) trend to any symbol at any timeframe. The plotted straight line is a good indication of the current trend and the curved line is an indication of a change momentum or change in the current trend. Plotting the straight line over about 2/3 the number of candles as the curved line is usually a good way to determine entry and exit points as it shows the current trend and momentum of the market. This
FREE

GenMA MTF
The signal indicator WITHOUT REDRAWING gives recommendations on the direction of trading.
When the price moves through the internal channel, it gives signals (red and blue arrows) that recommend a possible change in the direction of the price movement up or down.
When the price crosses the external channel, it gives signals (yellow arrows), warning that a strong price movement is possible, which will not immediately change the direction of trading.
When the price crosses the a
FREE

RubdFx Perfect Reversal , The reversal indicator is used to determine areas of support and resistance by Drawing an arrow with a level of supply and demand ( ReversalZones ). - You will catch more swings by reducing the period, and less swings if you increase period - Mobile, computer and email alerts available . it is not pushed by price which means the arrow will stay in one place,suitable for scalping and long term trading Also Compatible with all forex paris , BUY RULES; open a buy positio

Estocástico: Ele foi desenvolvido por George Lane no início da década de 1950. Ele é baseado no princípio de que o preço fecha perto da máxima se o ativo está em uma tendência de alta, e perto da mínima caso esteja em uma tendência de baixa. Seguindo a ideia do movimento inercial dos preços. Este indicador pode gerar possíveis sinais de momentos de sobrecompra ou sobre vendas de ativos. De um modo usual ele pode utilizado segundo alguns padrões;
Estocástico Lento: Uma média móvel de 3 período

In the world of finance, correlation is a statistical measure of how two securities move in relation to each other. Correlations are used in advanced portfolio management. This indicator measures how different securities move in relation to a reference one, thus making portfolio management easier. [ Installation Guide | Update Guide | Troubleshooting | FAQ | All Products ] Avoid concurrent trades in highly correlated instruments Find trading opportunities among highly correlated instruments Cor
FREE

Фрактальная дивергенция - это скрытая дивергенция, построенная на фракталах Билла Вильямса. Бычья фрактальная дивергенция представляет собой комбинацию из двух нижних фракталов, последний из которых расположен ниже предыдущего, и при этом две свечи справа от минимума последнего фрактала имеют минимумы выше уровня предыдущего фрактала (см. скриншот 1). Медвежья фрактальная дивергенция - это комбинация из двух соседних верхних фракталов, последний из которых расположен выше, чем предыдущий верхн
FREE

Esse Indicador é uma boa opção para quem gosta de operar a longo prazo e com paciência. Ele trabalho com os níveis de fibo na media de 200 são 9 níveis onde você pode operar nas reversões o mercado partir do níveis abaixo. Level 1 = 550 pontos Level 2 = 890 pontos Level 3 = 1440 pontos Level 4 = 2330 pontos Level 5 = 3770 pontos Level 7 = 9870 pontos Level 8 = 15970 pontos Level 9 = 25840 pontos Level 6 = 6100 pontos
FREE

O indicador Vwap Deviation Bands segue na mesma linha dos outros indicadores da White Trader, que buscam leveza, personalização e qualidade, para entregar o que há de melhor para o trader. Isto, além de combinar preço e volume (informações importantes para o trader) com uma medida estatística do desvio padrão.
Este indicador já foi utilizado e testado por outros traders que deram sugestões, inclusive, para chegarmos nesta versão final (embora ainda esteja aceitando sugestões, sempre :) ). O d

The Alligator indicator uses three smoothed moving averages, set at five, eight, and 13 periods, which are all Fibonacci numbers. The initial smoothed average is calculated with a simple moving average (SMA), adding additional smoothed averages that slow down indicator turns. Scan all your favorite pairs with Alligator, and get notified on your preferred time frames.
Setting is Customizable
Click to change time frame or open new pairs
Notification: Phone/Popup/Email

This indicator Allow you to get notification from 7 indicators. Scan all your favorite pairs with your favorite technical indicator, and get notified on your preferred timeframes.
Settings are Customizable
(RSI, ADX, MACD, Alligator, Ichimoku, Double MA, and Stochastic)
Click to change the time frame or open new pairs
Notification: Phone/Popup/Email

O Painel de Alerta de ADR mostra rapidamente onde o preço está sendo negociado atualmente em relação ao seu intervalo médio diário normal. Você receberá alertas instantâneos via pop-up, e-mail ou push quando o preço exceder o intervalo médio e os níveis acima de sua escolha, para que você possa pular para retrocessos e reversões rapidamente. O traço foi projetado para ser colocado em um gráfico em branco e apenas ficar no fundo e alertá-lo quando os níveis forem atingidos, para que você não pre

O painel de alerta RSI / TDI permite monitorar RSIs de uma só vez (selecionável por você) em todos os principais pares que você negocia.
Você pode usá-lo de duas maneiras:
1. Selecione vários prazos e o traço mostrará quando houver vários prazos estendidos além das condições normais de negociação. Um ótimo indicador de que o preço aumentou muito recentemente, pois atingiu um nível de sobrecompra ou sobrevenda em vários prazos, de modo que uma retração ou reversão deve ocorrer em breve.

White Weis Volume
Este indicador mostra o somatório do volume em cada onda, bulish ou bearish, conforme idealizado por David Weis, mas traz um importante adicional que é a marcação da barra de maior volume da onda (White Bar)!
Na codificação do indicador, foi buscado otimizar o código para exigir o mínimo processamento durante o uso e não sobrecarregar o mt5.
O indicador pode ser usado para análise e estudo pré pregão, onde o trader analisa possíveis pontos de suporte e resistência com

Dark Breakout is an Indicator for intraday trading. This Indicator is based on Trend Following strategy, providing an entry signal on the breakout. The signal is provided by the arrow, which confirms the breaking of the level. We can enter in good price with this Indicator, in order to follow the main trend on the current instrument. It is advised to use low spread ECN brokers. This Indicator does Not repaint and N ot lag . Recommended timeframes are M5, M15 and H1. Recommended working pairs
Esse indicador exibe os candles com maior volume do mercado, com base em um período e em uma porcentagem de crescimento acima da média. Também é possível ativar a funcionalidade "Show deep analisys" que utiliza algoritmos para pintar os candles na direção provável do mercado ao invés de pintá-lo baseando-se na abertura e fechamento.
Programadores de EA: Esse indicador não redesenha.
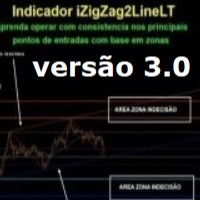
- iZigZag2LineLT Nova versão 3.0 do indicador iZigZag2LineLT onde nele se busca por possíveis regiões de exaustão do mercado buscando pequenas ou grandes reversões , segue as mesmas características contendo no indicador das linhas LTB e LTA, Fibonacci, Suportes e Resistências com a aplicação de zonas de Indecisões do Mercado (versão melhorada do Stop or Move do Sato´s), nessas zonas aparecem sugestões (através das linhas pontilhadas) para incluir ordens pendentes buscando sempre as reversões mai

Gapless Moving Average (GMA)
Média móvel sem gaps (GMA) Versão melhorada do indicador padrão de Média Móvel ( Moving Average, 'MA' ) da biblioteca MetaTrader que fornece a possibilidade de eliminar os gaps (lacunas) entre os candles que distorcem os valores médios principalmente durante os N (' period ') candles iniciais após a abertura do mercado devido ao spread ('gap') entre o preço de fechamento do dia anterior e o preço de abertura do dia seguinte. Quanto maiores
FREE

Olá pessoal.
Esse indicador vai mostrar, no histograma de volume, se o candle foi um Doji, candle de alta, ou candle de baixa.
A construção deste indicador foi solicitada por um trader que usa outros indicadores do meu catálogo, e resolvi liberar ele free para ajudar traders que achem que o indicador pode contribuir no seu operacional.
Os parâmetros são:
Volume Type: Real Volume ou Tick Volume. Cor se o candle for de baixa: selecionar a cor. Cor se o candle for de alta: selecionar a
FREE
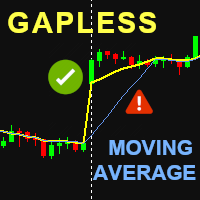
Gapless Moving Average (GMA)
Média móvel sem gaps (GMA) Versão melhorada do indicador padrão de Média Móvel ( Moving Average, 'MA' ) da biblioteca MetaTrader que fornece a possibilidade de eliminar os gaps (lacunas) entre os candles que distorcem os valores médios principalmente durante os N (' period ') candles iniciais após a abertura do mercado devido ao spread ('gap') entre o preço de fechamento do dia anterior e o preço de abertura do dia seguinte. Quanto maiores são esses gaps , mais

This panel displays the price percentage change
Shows the percentage change in price from the last open: Daily, Weekly and Monthly timeframes. Numbers are easier to use than histogram currency meters. Line up the three timeframes strengths/weaknesses for strong trends. Compare currencies strongest against weakest. USD is the world's reserve currency to compare against.
How to use 1. Match the strongest currency with weakest currency; or 2. Match the strongest or weakest currency against US
FREE

Simple alternate MACD version like the one used in tradingview. Two lines (MACD & signal line) and a histogram. This MACD version can be used in many different ways. Potential trades are the crossing of the MACD & signal line, the crossing of the MACD through the 0-line of the histogram, the MACD being under the 0-line of the histogram or the movement of the histogram itself. A combination of these potential signals on different timeframes can be very precise, but always needs additional confirm
FREE
inp_timeframe: Set Timeframe of indicator MA Parameters: (Same as standard moving average indicator) inp_MA_period, inp_MA_shift, inp_MA_method, inp_MA_price: Moving Average Period, Moving Average Shift, Moving Average Method, Moving Average Price Please take note that using a MA_shift of 0 will result in a different result when the indicator is reloaded for higher time frame This indicator only accepts shift>0 This is due to the indicator showing the current time moving average and atr at the c
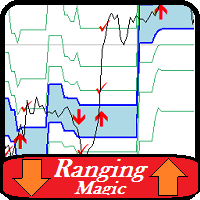
This is a powerful indicator that is very easy to work with. Its default setting is for the euro-dollar pair, but with the right settings it can be used in all markets and all time frames less than daily. The basis of the work of the Ranging indicator is to find areas of price range and get signals from it. You can specify the duration of the valid sufferings and the minimum and maximum price in it. It is also possible to determine the number of reliable signals received from each range.
Othe
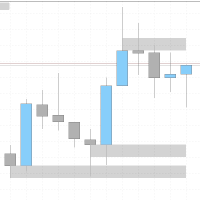
I created an indicator inspired by the "Wicks don´t lie" community on Youtube. It let's you see zones from other timeframes, and lets you keep a zone from a higher timeframe when you go to lower time frames. It operates by creating zones wherever the price has previously turned and not been retested again. This makes it easier to know where to expect a possible hick-up while going with a breakout, or where the price might make a reversal. The indicator also continues to add zones out from the cu

VR Cub é um indicador para obter pontos de entrada de alta qualidade. O indicador foi desenvolvido para facilitar cálculos matemáticos e simplificar a busca por pontos de entrada em uma posição. A estratégia de negociação para a qual o indicador foi escrito tem provado a sua eficácia há muitos anos. A simplicidade da estratégia de negociação é a sua grande vantagem, o que permite que até mesmo os comerciantes novatos negociem com sucesso com ela. VR Cub calcula os pontos de abertura de posição e

Modified oscillator MACD. A classic indicator that combines a trend indicator with an oscillator to detect entry points. Has a multi-timeframe panel and 3 types of notifications
Benefits:
Works on all instruments and timeseries Trend indicator with oscillator for inputs Multi-period panel on all timeframes Pluggable arrows when signals appear Three types of notifications: push, email, alert
MT4 version -> HERE / Our news -> HERE
How the indicator works:
AW Classic MACD - Indica
FREE

Description This addon is originated from my own trading. I spent my whole time waiting for signals and just wanted a notification when a specific signal appears. So i started to wrote my own addon and called it "LifetimeSaver", because thats exactly what it is for me. But because this addon should not only be for my personal trading, I extended the LifetimeSaver and now its highly customizable, so that it can fit your needs.
Functions: Notification at your defined target/signal Notificatio

SupportResistance é um indicador de suporte e resistência dinâmico baseado na máxima e na mínima dos candles anteriores. Os parâmetros de cálculo são configuráveis. Pode-se usar como referência os valores máximos e mínimos do candle anterior ou se pode usar a máxima e a mínima de um grupo de candles anteriores. O indicador utiliza de uma linha vermelha para indicar a resistência e uma linha verde para indicar o suporte. Quando um suporte ou uma resistência é rompida, sua linha fica pontilhada, s

Time Session OPEN-HIGH-LOW-CLOSE This Indicator Will Draw Lines Of OHLC Levels Of Time Session Defined By User. It Will Plot Floating Lines On Current Day Chart. Time Session Can Of Current Day Or Previous Day. You Can Plot Multiple Session Lines By Giving Unique ID To Each Session. It Can Even Show Historical Levels Of Time Session Selected By User On Chart To Do Backdating Test. You Can Write Text To Describe The Lines.
FREE

CPR Pivot Lines It Will Draw Pivot Point R1,R2,R3 S1,S2,S3 Tc Bc Best Part Is That You Can Even Add Values Of High,Low,Close Manually Also To Get Your All Levels On Chart.So If Your Broker Data Of High ,Low ,Close Is Incorrect Then You Don’t Have To Depend On Them Anymore. You Can Even Modify All Lines Style. It Will Show Line In Floting Style And Not Continues Mess.
FREE

This indicator implements the logic behind Traders Dynamic Index to the classic MACD Indicator. It helps to find powerful trende changes and ignore meaningless ones. It is simply the classic MACD indicator plotted with volatility bands on top designed with the sole purpose of being able to ignore trend changes that do not follow an over-extension or over-contraction of the market. The indicator alerts on trend changes after the volatility bands have been breached and implements alerts of all ki
FREE

Este indicador usa o indicador ZigZag da Metaquotes como base para traçar automaticamente a extensão de fibonacci e retração de fibonacci com base nas ondas de Elliot.
Uma retração de Fibonacci será plotada em cada onda desenhada pelo ZigZag.
Uma extensão de fibonacci será plotada somente após a 2ª onda.
Ambos os fibonacci serão atualizados ao longo da mesma tendência de onda. Suportando até 9 ondas elliot consecutivas.
Parâmetros: Depth( Profundidade): quanto o algoritmo ir
Esse indicador mostra vários padrões de candle. Muito útil para aprender ou fazer trades em alguns papéis de ação ou forex. Atualmente são suportados os seguintes padrões: The supported patterns are: Spinning top de alta, spinning top de baixa, marabozu de alta, marabozu de baixa, candle de força de alta, candle de força de baixa, kicker de alta, kicker de baixa, engolfo de alta, engolfo de baixa, harami de alta, harami de baixa, piercing de alta, núvem negra, estrela da manhã, estrela da tard

Este indicador marca os níveis de volume relevantes ao longo do dia. Os dois níveis relevantes são o candle com mais volume e o período com mais volume de lotes transacionados.
O fundo vermelho preenchido é a faixa de preço com o volume mais relevante do dia (provavelmente o grande jogador que está no comando do jogo). As linhas roxas mostram a faixa de preço com maior volume (provavelmente uma área onde algum grande jogador está se acumulando antes de forçar uma direção do mercado). Há t
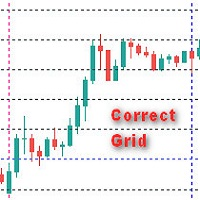
Общие сведения Индикатор отображает правильную сетку с задаваемым в параметрах шага в пунктах , что позволяет более точно визуально оценить масштаб и размер ценовых движений. Параметры индикатора
Step - шаг сетки в пунктах по вертикали Figure - шаг фигуры MaxBars - ограничение истории (0 - вся история)
Цвет вертикальных лини color new_day - Цвет новый день new_week - Цвет новая неделя new_mon - Цвет новый месяц
Цвет горизонтальных линий new_Hfigure - Цвет

Este painel é uma ferramenta de alerta para uso com o indicador de reversão da estrutura de mercado. Seu objetivo principal é alertá-lo para oportunidades de reversão em prazos específicos e também para os novos testes dos alertas (confirmação) como o indicador faz. O painel foi projetado para ficar em um gráfico por conta própria e funcionar em segundo plano para enviar alertas sobre os pares e prazos escolhidos. Ele foi desenvolvido depois que muitas pessoas solicitaram um traço para monitora
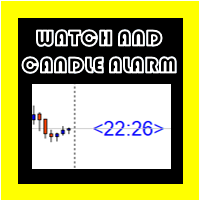
Osw Watch para METATRADER 5
Este é um indicador que mostra o tempo restante para o candle atual expirar em um relógio, ele está sempre localizado próximo ao último candle após o preço, os números são mostrados da mesma forma que nas imagens, e podem ser modificados em tamanho e cor.
entre suas configurações, você pode definir:
o tamanho dos números que mostram a hora.
a cor dos números que mostram a hora.
Também dentro da configuração você pode ativar e desativar para que um alarme so
Indicador de amendoim
Este indicador indica a tendência com LINHA grossa em azul e vermelho com base na Cruz dourada, Cruz morta e MACD. Você pode ajustar o número livremente nas configurações dos parâmetros (período MA, valor MACD).
Portanto, você pode ajustar esse indicador ao tipo de moeda de negociação, período e assim por diante. O número padrão deste indicador é adequado para negociações de USD / JPY M30 ou H1.
COMO USAR
LINHA VERDE: AUMENTE, COMPRE LINHA VERMELHA: QUEDA, VENDE Pa
Os níveis de volume são um indicador muito importante para a negociação de ações. Nesses níveis, a maioria das transações foi realizada. No futuro, o preço costuma saltar desses níveis e isso pode ser aplicado com sucesso na negociação. Este indicador é capaz de determinar os níveis em que houve o maior volume para o período especificado da história. Esses níveis são mostrados como linhas, os parâmetros para determinar os níveis são configuráveis. Além de exibir, este indicador pode informar ao
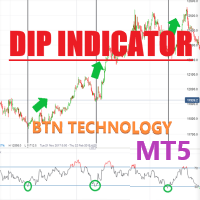
DIP Indicator Oshime DIP Indicator Oshime This indicator is based on Oshimegai(buying on the dips). This is based on Moving Average line so this indicator indicates the lines based on long term trend and short term trend. So this indicator is helpful when you trade with a short time flames. Therefore, you can find easily in M5 or M15 and M30 flame when you should get the positions of sell or buy. HOW TO USE Blue UP Arrow--Price will go up(You should get the position of BUY.) Pa

The market price usually falls between the borders of the channel .
If the price is out of range , it is a trading signal or trading opportunity .
Basically , Fit Channel can be used to help determine overbought and oversold conditions in the market. When the market price is close to the upper limit, the market is considered overbought (sell zone). Conversely, when the market price is close to the bottom range, the market is considered oversold (buy zone).
However, the research can
Desenvolvido para auxiliar em operações de retração em opções binárias, este indicador mostrará os melhores pares para operar retração de vela!
Como funciona:
O indicador irá calcular o comprimento total de cada vela (low ao high), o total do corpo e total de sombras (cima e baixo) e calcular a porcentagem total de pavio de vários ativos configuráveis. O contador é atualizado a cada nova vela.
ATENÇÃO: A demo no testador de estratégias não é funcional em vários pares.

九转序列,源自于TD序列,是因TD序列的9天收盘价研判标准而得名。 汤姆·德马克(Tom DeMark)技术分析界的着名大师级人物,创建了以其名字首字母命名的TD系列的很多指标,价格反转的这个指标就是其中重要的一个,即TD序列。 德马克原版TD序列指标要复杂一些,想研究就自行看关于德马克的资料吧。这里只说简单的TD序列(九转序列)。 九转序列分为两种结构,低九买入结构和高九卖出结构。 TD高九卖出结构:连续出现的九根K线,这些K线的收盘价都比各自前面的第四根K线的收盘价高, 如果满足条件,就在各K线上方标记相应的数字,最后1根就标记为9,如果条件不满足,则K线计数中断,原计数作废重新来数K线。如出现高9,则股价大概率会出现转折。 TD低九买入结构:连续出现的九根K线,这些K线的收盘价都比各自前面的第四根K线的收盘价低,如果满足条件,就在各K线下方标记相应的数字,最后1根就标记为9,如果条件不满足,则K线计数中断,原计数作废重新来数K线。如出现低9,则股价大概率会出现转折。
结构的本质是时间和空间的组合,时间是横轴,空间是纵轴,不同的时间周期和空间大小的组合,形成不同的结构形态,不同

Looks for strong price movements and draws levels upon their completion.
You determine the strength of the movement yourself by specifying in the settings the number of points and the number of candles of the same color in a row in one direction.
There are 2 types of building in the settings: extrenum - high / low close - close price You can also adjust the number of displayed levels and the number of candles for calculations.
By default, the settings indicate 5 levels for 360 candles.
FREE
Developed to assist in binary options retraction operations, this indicator will show the best assets to operate retractions!
How it works: The indicator will calculate the total length of each candle from low to high, the total of the body and total of shadows (up and down) and calculate a total shadows percentage of various configurable assets. The counter is updated with each new candle.
ATENTION: Demo on the estrategy tester is not functional to show other assets, but still can show how

Donchian通道(唐奇安通道指标)是用于交易突破的最古老、最简单的技术指标之一。 一般来说,唐奇安通道的宽度越宽,市场波动就越大,而唐奇安通道越窄,市场波动性也就越小 。此外,价格走势可以穿过布林带,但你看不到唐奇安通道的这种特征,因为其波段正在测量特定时期的最高价和最低价。 交易实用必备工具指标 波浪自动计算指标,通道趋势交易 完美的趋势-波浪自动计算通道计算 , MT4版本 完美的趋势-波浪自动计算通道计算 , MT5版本 本地跟单复制交易 Easy And Fast Copy , MT4版本 Easy And Fast Copy , MT5版本 本地跟单复制交易 模拟试用 Easy And Fast Copy , MT4 模拟账号运行 Easy And Fast Copy , MT5 模拟账号运行 唐奇安通道指标计算: 唐奇安上阻力线 - 由过去N天的当日最高价的最大值形成。 唐奇安下支撑线 - 由过去N天的当日最低价的最小值形成。 中心线 - (上线 + 下线)/ 2 唐奇安通道信号 唐奇安通道常用作突破指标。它提供了两种主要类型的突破信号,一个是上阻力线或下支
FREE
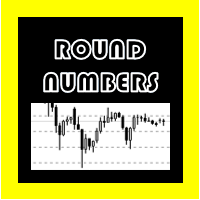
NÚMEROS REDONDOS (para Metatrader 5)
Este indicador permite adicionar linhas horizontais de acordo com os números redondos que o ativo contém.
Ao contrário de outros indicadores, este calcula os níveis mais próximos de forma dinâmica e automática à medida que o preço se move.
trabalha com pares de moedas, índices, metais, ações, etc.
Arredondar com 5 dígitos, 3 dígitos e números inteiros de 10 100 ou 1000.
as linhas podem ser ajustadas em parâmetros como:
Oculte a linha ou númer
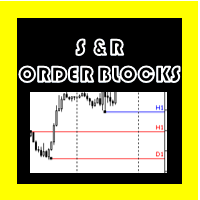
LINHAS DE SUPORTE E RESISTORES + BLOCOS DE COMANDO para METATRADER 5
Uma forma visual muito mais agradável de localizar apoios e resistências, ao contrário das linhas horizontais normais, estas podem ser localizadas a partir de um ponto específico, sem se estender para trás, fazendo com que o gráfico não pareça bem, também mostra o nome da temporalidade em que foi criado para que, quando você estiver operando, saiba a que temporalidade ela pertence.
Você também pode criar blocos de pedidos
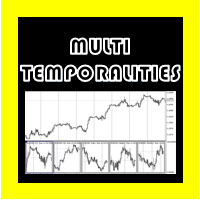
MULTI-TIMES PARA METATRADER 5
Este indicador, em uma janela inferior, mostra o gráfico atual em diferentes intervalos de tempo, o que pode ajudá-lo a decifrar melhor o mercado, levando em consideração os intervalos de tempo maiores.
Entre as configurações que você pode modificar estão:
visualização de preços em gráficos vista das temporalidades nos gráficos habilitar cada um dos gráficos nas diferentes temporalidades (M1, M5, M15, H1, H4, D1, W1, MN1).

I present an indicator for professionals. Prof MACD is very similar to classic MACD in appearance and its functions . However, Prof MACD is based on completely new algorithms (for example, it has only one averaging period) and is more robust, especially on small timeframes, since it filters random price walks. The classic MACD indicator (Moving Average Convergence / Divergence) is a very good indicator following the trend, based on the ratio between two moving averages, namely the EMA

Investment Castle Volatility Index has the following features: 1. This indicator shows the volumes of the current symbol and the market volatility. 2. This indicator is built-in in the Investment Castle EA which works as volatility index for the EA dynamic distance and opposite start. 3. Parameters available for optimization for each pairs. 4. Works with any chart.
FREE

Automatic Fibonacci Retracement Line Indicator. This indicator takes the current trend and if possible draws Fibonacci retracement lines from the swing until the current price. The Fibonacci levels used are: 0%, 23.6%, 38.2%, 50%, 61.8%, 76.4%, 100%. This indicator works for all charts over all timeframes. The Fibonacci levels are also recorded in buffers for use by other trading bots. Any comments, concerns or additional feature requirements are welcome and will be addressed promptly.
FREE

The third indicator from the set for market analysis. The first one is here: https://www.mql5.com/ru/market/product/65258 The second one is here: https://www.mql5.com/ru/market/product/65347
The indicator builds a channel of maximum price fluctuations for a specified period. Additionally, the middle of the channel is drawn.
All color settings, line types are customizable.
The indicator allows you to see the picture of price movement from a slightly different angle. You can use several in

The second indicator from the set for market analysis. The first one is here: https://www.mql5.com/ru/market/product/65258
The indicator draws a line by levels where the price reaches a aliquot of the value in the Step parameter. You can specify the spread of + - points from the required level.
All color settings, line types are customizable.
Example: Step - 500 Deviation - 20 If the symbol reaches the price for example 1.73500 + - 20, i.e. from 1.73480 to 1.73520, lines are being built.
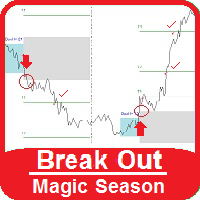
<< See how it works on YouTube >>
Possibilities:
Arrow signal to buy, sell and hit the targets Alert signal send mail Execute custom audio file The Break Out Magic indicator monitors price fluctuations over a set period of time (adjustable rectangle). Then, according to the maximum and minimum price, in the second rectangle, it determines the outline break lines. And sets 3 goals to exit from each side. In the settings we have:
Start Time: Start time of range
End Time: The end of range tim

KDJ Index 4 交易实用必备工具指标 波浪自动计算指标,通道趋势交易 完美的趋势-波浪自动计算通道计算 , MT4版本 完美的趋势-波浪自动计算通道计算 , MT5版本 本地跟单复制交易 Easy And Fast Copy , MT4版本 Easy And Fast Copy , MT5版本 本地跟单复制交易 模拟试用 Easy And Fast Copy , MT4 模拟账号运行 Easy And Fast Copy , MT5 模拟账号运行 "Cooperative QQ:556024 " "Cooperation wechat:556024" "Cooperative email:556024@qq.com" 强烈推荐趋势指标, 波浪的标准自动计算 和 波浪的标准自动计算MT5版本
KDJ指标又叫 随机指标 ,是一种相当新颖、实用的技术分析指标,它起先用于期货市场的分析,后被广泛用于股市的中短期趋势分析,是期货和股票市场上最常用的技术分析工具。 随机指标KDJ一般是用于股票分析的统计体系,根据统计学原理,通过一个特定的周期(常为9日、9周等

The indicator is designed to display candles (bars) of a higher timeframe on the current one. The indicator has many settings for the displayed candles, as well as a sound signal that will sound a few minutes (seconds) before the bar closes. Input parameters: BarsCount = 50 - the number of displayed bars of the higher timeframe Auto_Candle_UP_TF = false - Automatic selection of a higher timeframe Candle_UP_TF = PERIOD_H1 - Higher timeframe, if Auto_Candle_UP_TF = false Signal_Close_Candle_UP_TF

Suporte Automático e Resistência Osw MT5
Este indicador representa graficamente as linhas nos possíveis pontos de suporte e resistência do ativo selecionado.
atua em múltiplas temporalidades.
permite que você configure:
Cor das linhas. Largura das linhas. Tipo de linhas. Quando o indicador inicia seu funcionamento, ele analisa os apoios e resistências de níveis superiores para a temporalidade em que está trabalhando.

The MaxMinTrend indicator displays the highs and lows of the price on the chart. This indicator was created to simplify the determination of trend directions, as well as to support open positions, by transferring Stoploss to the current highs and lows of the price, thereby making a large profit. This indicator is not redrawn.
Input parameters:
BarsCount - 1000 - Number of bars to draw the indicator
maxmin - true - Enabled display of Highs and Lows
line - true - Enabled display of the co

The Flat Horizontal Channel Range Price indicator automatically draws a horizontal channel (range) of prices on a higher or current timeframe. This indicator was developed to simplify the determination of sideways movements of the market, as well as to search for entry signals for a pullback from the boundaries of a channel (range) or for its breakdown.
Input parameters:
BarsCount - 1000 - Number of bars to search for a horizontal channel AutoPeriodDraw - true - Enabled automatic drawing of

Phi Cubic Fractals Pack1A with FuTuRe PACK 1A é uma melhoria sobre o Pack 1 que inclui a possibilidade de selecionar as linhas LINE 4/8/17/34/72/144/305/610 individualmente. Este produto contém os indicadores do PACK 1A (Lines + LineSAR + Channels + BTL + Ladder) + MODO FUTURO Phi Lines - medias moveis especiais, semelhantes às MIMAs do Phicube, capazes de indicar com muita clareza tanto a tendencia como a consolidação; Phi LineSAR - apaga ou destaca as Phi Lines para mostrar apenas as linha

The indicator displays the size of the spread for the current instrument on the chart. Very flexible in settings. It is possible to set the maximum value of the spread, upon exceeding which, the color of the spread label will change, and a signal will sound (if enabled in the settings). The indicator will be very convenient for people who trade on the news. You will never enter a trade with a large spread, as the indicator will notify you of this both visually and soundly. Input parameters: Aler
FREE

Para aqueles que precisam de um indicador de Perfil de Volume / Perfil de Mercado, aqui está a solução! Contém as informações essenciais: Ponto de Controle (POC); Área de Valor Superior (VAH); Área de Valor Inferior (VAL); Você pode optar em TER ou NÃO TER o Histograma de volume do dia, de acordo com seu gosto. Caso opte por apresentar o histograma, se atente que de acordo com o tipo de ativo, seja necessário ajustar a escala do indicador (último parâmetro do indicador). Você também pode escolhe

Indicator shows buy/sell arrows depending on volatility factor. Indicator does not repaint! It works on any pair and any timeframe. It is well tested through strategy builders and shows quite interesting results as a good filter indicator and as independent signaler as well (check the screenshots). It is possible to search for a lot of interesting parameters for profitable trading, some of which are shown on the screenshots. There are next inputs in indicator settings: N-volatility period; Level

The Williams Conditional Range (WCR) is a technical analysis indicator used to determine the oversold / overbought condition of the market by examining the position of the closing price in a given range formed by the extremes in the past and looking for divergences that indicate the likelihood of a reversal. It allows you to assess whether buyers or sellers have had a stronger influence on the price over a certain period of time, and to suggest further developments. The indicator is easy to inte
FREE

6-BAND VWAP (Volume Weighted Average Price)
Indicador de Bandas VWAP totalmente customizável e de fácil integração com Expert Advisors (EA).
PRINCIPAIS CARACTERÍSTICAS:
Escolha o período de cálculo da VWAP (diário, semanal ou mensal). Para day trade use no modo Daily, e para swing trade e longo prazo utilize no modo Semanal ou Mensal. Escolha a quantidade de bandas (desvios padrão) para exibição, até no máximo 6 bandas (escolhendo zero exibe apenas a linha VWAP principal). Ajuste fino

One of the simplest Pivot Point indicator, easy to operate, and most complete for a single chart in determining Resistance and Support level lines.
In single chart, it will show R&S Level Line with 5 popular types of Pivot Point, Highest&Lowest of closing price Include the Trend and up to 3 Time Frames.
Five types (Floor, Woodie, Camarilla, DeMark, & Fibonacci) of popular Pivot Points in determining Resistance and Support levels. With just using simple button on th
FREE
O Mercado MetaTrader oferece um local conveniente e seguro para comprar aplicativos para a plataforma MetaTrader. Faça download de versões de demonstração gratuitas de Expert Advisors e indicadores a partir do seu terminal para testes no Testador de Estratégia.
Teste os aplicativos em diferentes modos para monitoramento do desempenho e assim fazer um pagamento para o produto que você deseja, usando o sistema de pagamento MQL5.community.
Você está perdendo oportunidades de negociação:
- Aplicativos de negociação gratuitos
- 8 000+ sinais para cópia
- Notícias econômicas para análise dos mercados financeiros
Registro
Login
Se você não tem uma conta, por favor registre-se
Para login e uso do site MQL5.com, você deve ativar o uso de cookies.
Ative esta opção no seu navegador, caso contrário você não poderá fazer login.