Смотри обучающее видео по маркету на YouTube
Как купить торгового робота или индикатор
Запусти робота на
виртуальном хостинге
виртуальном хостинге
Протестируй индикатор/робота перед покупкой
Хочешь зарабатывать в Маркете?
Как подать продукт, чтобы его покупали
Новые технические индикаторы для MetaTrader 5 - 35

A personal implementation of the famous Bollinger bands indicator as a trend following mechanism, which uses a moving average and the standard deviation to define what a trend is and when it changes. Bollinger bands are usually used as an oversold/overbought indicator only, but in my opinion, the trading approach is more complete using the trend variant as an exit strategy. [ Installation Guide | Update Guide | Troubleshooting | FAQ | All Products ] Easy to trade Customizable colors and sizes I
FREE

Данный индикатор умеет определять ценовые уровни, на которых было больше всего объёма за указанный промежуток истории. В будущем, ч асто цена отбивается от таких уровней, и это можно с успехом применять в торговле. Они отображаются линиями, некоторые параметры для определения уровней можно настраивать. Этот индикатор прост, поэтому не сообщает сигналы, а построение уровней делает только на EUR/USD. Параметры HistoryBars - количество баров для определения ближних объемных уровней; Range -
FREE

This indicator plots in the candles the divergence found in the selected indicator and can also send a notification by email and / or to the cell phone.
Works on all TIMEFRAMES. Meet Our Products
He identifies the divergences in the indicators:
Relative Strength Index (RSI); Moving Average Convergence and Divergence (MACD); Volume Balance (OBV) and;. iStochastic Stochastic Oscillator (STOCHASTIC).
It is possible to choose the amplitude for checking the divergence and the indicator has

Was: $49 Now: $34 Blahtech Better Volume provides an enhanced version of the vertical volume bars. Each bar is compared to the previous 20 bars. Depending on its volume, range and volume density it will be assigned a state and colour. Low Volume – Minimum volume High Churn – Significant volume with limited movement Climax Neutral – High volume with unclear direction
Climax Up – High volume with bullish direction Climax Dn – High volume with bearish direction Climax Churn – High vol

Dark Support Resistance is an Indicator for intraday trading. This Indicator is programmed to identify Support and Resistance Lines , providing a high level of accuracy and reliability.
Key benefits
Easily visible lines Only the most important levels will be displayed Automated adjustment for each timeframe and instrument Easy to use even for beginners Never repaints, never backpaints, Not Lag 100% compatible with Expert Advisor development All types of alerts available: Pop-up, Email, Pus
Big promotion! , prices are now on discount , get your copy now The Rubdfx Price Tracker that is used to show price price bound , the price almost never goes out of the channel and most of the time price will react when it touches the channel limits .It determines the best highest and lowest prices at which you can sell and buy respectively Suitable for scalping & swing trading It Draws arrows that appear after a candle close , The arrows indicate bullish or bearish pressure For bearish an

The market price usually falls between the borders of the channel .
If the price is out of range, it is a trading signal or trading opportunity.
Basically, Fit Channel can be used to help determine overbought and oversold conditions in the market. When the market price is close to the upper limit, the market is considered overbought (sell zone). Conversely, when the market price is close to the bottom range, the market is considered oversold (buy zone).
However, the research can be used

Automatic Trend Line Fit. This indicator automatically plots the straight line and parabolic (curved) trend to any symbol at any timeframe. The plotted straight line is a good indication of the current trend and the curved line is an indication of a change momentum or change in the current trend. Plotting the straight line over about 2/3 the number of candles as the curved line is usually a good way to determine entry and exit points as it shows the current trend and momentum of the market. This
FREE

Gapless Moving Average (GMA)
Improved version of standard Moving Average (MA) from MetaTrader library which provides the possibility to eliminate the 'gaps' between candle sticks which distort the average values mainly during the N ('period') initial candles after market opens due to the spread ('gap') between closing price from previous day and opening price from the next day. The greater these 'gaps' are, the more divergent the standard MA is in order to indicate the current p
FREE

GenMA MTF Сигнальный индикатор БЕЗ ПЕРЕРИСОВКИ дает рекомендации направления торговли. При переходе ценой внутреннего канала - дает сигналы (красные и синие стрелки), рекомендуя возможное изменение направления движения цены вверх или вниз. При пересечении ценой внешнего канала - дает сигналы (желтые стрелки ), предупреждая о том, что возможно сильное движение цены не даст сразу развернуть направление торговли. При пересечении ценой средней, возможно закрывать полностью или часть прибы
FREE

Stochastic: It was developed by George Lane in the early 1950s. It is based on the principle that the price closes close to the maximum if the asset is on an uptrend, and close to the minimum if it is on a downtrend. Following the idea of the inercial movement of prices. This indicator can generate possible signals of overbought moments or about asset sales. In a usual way it can used according to some standards;
Slow Stochastic: A moving average of 3 periods is calculated on the stochastic i

In the world of finance, correlation is a statistical measure of how two securities move in relation to each other. Correlations are used in advanced portfolio management. This indicator measures how different securities move in relation to a reference one, thus making portfolio management easier. [ Installation Guide | Update Guide | Troubleshooting | FAQ | All Products ] Avoid concurrent trades in highly correlated instruments Find trading opportunities among highly correlated instruments Cor
FREE

Фрактальная дивергенция - это скрытая дивергенция, построенная на фракталах Билла Вильямса. Бычья фрактальная дивергенция представляет собой комбинацию из двух нижних фракталов, последний из которых расположен ниже предыдущего, и при этом две свечи справа от минимума последнего фрактала имеют минимумы выше уровня предыдущего фрактала (см. скриншот 1). Медвежья фрактальная дивергенция - это комбинация из двух соседних верхних фракталов, последний из которых расположен выше, чем предыдущий верхн
FREE

Esse Indicador é uma boa opção para quem gosta de operar a longo prazo e com paciência. Ele trabalho com os níveis de fibo na media de 200 são 9 níveis onde você pode operar nas reversões o mercado partir do níveis abaixo. Level 1 = 550 pontos Level 2 = 890 pontos Level 3 = 1440 pontos Level 4 = 2330 pontos Level 5 = 3770 pontos Level 7 = 9870 pontos Level 8 = 15970 pontos Level 9 = 25840 pontos Level 6 = 6100 pontos
FREE

Информационная панель ADR Alert показывает вам, где в настоящее время торгуется цена по отношению к ее нормальному среднему дневному диапазону. Вы будете получать мгновенные оповещения через всплывающие окна, электронную почту или push-уведомления, когда цена превышает свой средний диапазон и уровни выше него по вашему выбору, чтобы вы могли быстро переходить к откатам и разворотам. Черта предназначена для размещения на пустом графике и просто находится в фоновом режиме и предупреждает вас о до

Панель предупреждений RSI / TDI позволяет вам одновременно отслеживать RSI (выбирается вами) по каждой основной паре, которой вы торгуете.
Вы можете использовать его двумя способами:
1. Выберите несколько таймфреймов, и тире покажет вам, когда несколько таймфреймов выходят за рамки обычных торговых условий. Отличный индикатор того, что цена в последнее время сильно подросла, поскольку она достигла уровня перекупленности или перепроданности в нескольких временных рамках, поэтому вскоре ожи

White Weis Volume
This indicator shows the sum of the volume in each wave, bulish or bearish, as idealized by David Weis , but it brings an important addition , which is the marking of the bar with the highest volume of the wave (White Bar)!
In coding the indicator, it was sought to optimize the code to require minimal processing during use and not to overload mt5.
The indicator can be used for pre-trading analysis and study, where the trader analyzes possible points of support and resi

Dark Breakout is an Indicator for intraday trading. This Indicator is based on Trend Following strategy, providing an entry signal on the breakout. The signal is provided by the arrow, which confirms the breaking of the level. We can enter in good price with this Indicator, in order to follow the main trend on the current instrument. It is advised to use low spread ECN brokers. This Indicator does Not repaint and N ot lag . Recommended timeframes are M5, M15 and H1. Recommended working pairs
This indicator shows the candles with the highest volume in the market, based on a period and above-average growth percentage. It is also possible to activate the "Show in-depth analysis" functionality that uses algorithms to paint the candles with the probably market direction instead of painting based on the opening and closing positions.
EA programmers: This indicator does not redraw.
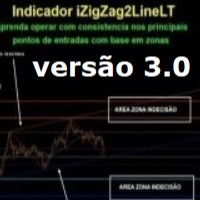
- iZigZag2LineLT
New version 3.0 of the iZigZag2LineLT indicator where it is possible to search for possible exhaustion regions of the market looking for small or large reversals, it follows the same characteristics contained in the indicator of the LTB and LTA lines, Fibonacci, Supports and Resistances with the application of Market Undecided zones (improved version of Stop or Move by Sato´s), in these areas suggestions (through the dotted lines) appear to include pending orders always looki
This indicator show several candle patterns. Very useful to learn and to trading some stocks or forex.
The supported patterns are: bullish spinning top, bearish spinning top, bullish marubozu, bullish force, bearish marubozu, bearish force, bullish kicker, bearish kicker, bullish engulfing, bearish engulfing, bullish harami, bearish harami, piercing line, dark cloud cover, morningstar, evening star, bearish abandoned baby, bullish abandoned baby, three white soldiers, three black soldiers, mo

This indicator marks the relevant volume levels among the day. The two relevant levels are the candle with more volume and the period with more volume of lots transacted.
The filled red background is the range of price with the most relevant volume of the day (probably the big player that is command the game). The purple lines shows the range of price with most volume (probably a area where some big player is accumulating before force a market direction). There is also the dot lines that mark

Hey guys.
This indicator will show you, in the volume histogram, if the candle was a Doji, a bullish candle, or a bearish candle.
The construction of this indicator was requested by a trader who uses other indicators from my catalog, and I decided to release it free to help traders who think that the indicator can contribute to their operations.
The parameters are:
Volume Type: Real Volume or Tick Volume. Color if the candle is bearish: select the color. Color if the candle is high:
FREE
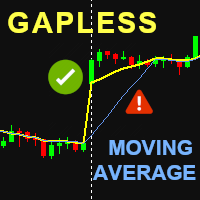
Gapless Moving Average (GMA)
Improved version of standard Moving Average (MA) from MetaTrader library which provides the possibility to eliminate the 'gaps' between candle sticks which distort the average values mainly during the N ('period') initial candles after market opens due to the spread ('gap') between closing price from previous day and opening price from the next day. The greater these 'gaps' are, the more divergent the standard MA is in order to indicate the current price trend

This panel displays the price percentage change
Shows the percentage change in price from the last open: Daily, Weekly and Monthly timeframes. Numbers are easier to use than histogram currency meters. Line up the three timeframes strengths/weaknesses for strong trends. Compare currencies strongest against weakest. USD is the world's reserve currency to compare against.
How to use 1. Match the strongest currency with weakest currency; or 2. Match the strongest or weakest currency against US
FREE

Simple alternate MACD version like the one used in tradingview. Two lines (MACD & signal line) and a histogram. This MACD version can be used in many different ways. Potential trades are the crossing of the MACD & signal line, the crossing of the MACD through the 0-line of the histogram, the MACD being under the 0-line of the histogram or the movement of the histogram itself. A combination of these potential signals on different timeframes can be very precise, but always needs additional confirm
FREE
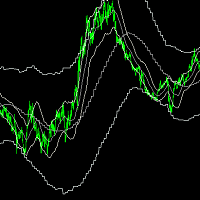
inp_timeframe: Set Timeframe of indicator MA Parameters: (Same as standard moving average indicator) inp_MA_period, inp_MA_shift, inp_MA_method, inp_MA_price: Moving Average Period, Moving Average Shift, Moving Average Method, Moving Average Price Please take note that using a MA_shift of 0 will result in a different result when the indicator is reloaded for higher time frame This indicator only accepts shift>0 This is due to the indicator showing the current time moving average and atr at the c
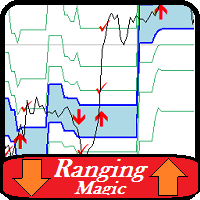
This is a powerful indicator that is very easy to work with. Its default setting is for the euro-dollar pair, but with the right settings it can be used in all markets and all time frames less than daily. The basis of the work of the Ranging indicator is to find areas of price range and get signals from it. You can specify the duration of the valid sufferings and the minimum and maximum price in it. It is also possible to determine the number of reliable signals received from each range.
Othe
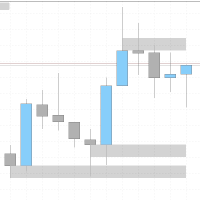
I created an indicator inspired by the "Wicks don´t lie" community on Youtube. It let's you see zones from other timeframes, and lets you keep a zone from a higher timeframe when you go to lower time frames. It operates by creating zones wherever the price has previously turned and not been retested again. This makes it easier to know where to expect a possible hick-up while going with a breakout, or where the price might make a reversal. The indicator also continues to add zones out from the cu

VR Cub это индикатор что бы получать качественные точки входа. Индикатор разрабатывался с целью облегчить математические расчеты и упростить поиск точек входа в позицию. Торговая стратегия, для которой писался индикатор, уже много лет доказывает свою эффективность. Простота торговой стратегии является ее большим преимуществом, что позволяет успешно торговать по ней даже начинающим трейдерам. VR Cub рассчитывает точки открытия позиций и целевые уровни Take Profit и Stop Loss, что значительно повы

Модифицированный осциллятор MACD. Классический индикатор, соединяющий в себе трендовый индикатор с осциллятором для обнаружения точек входа. Имеет мультитаймфреймовую панель, а также 3 типа уведомлений
Преимущества:
Работает на всех инструментах и таймсериях Трендовый индикатор с осциллятором для входов Мультипериодная панель на всех таймфреймах Подключаемые стрелки при появлении сигналов Три типа уведомлений: push, email, alert
MT4 версия -> ЗДЕСЬ / Наши новости -> ЗДЕСЬ
Как работат
FREE

Description This addon is originated from my own trading. I spent my whole time waiting for signals and just wanted a notification when a specific signal appears. So i started to wrote my own addon and called it "LifetimeSaver", because thats exactly what it is for me. But because this addon should not only be for my personal trading, I extended the LifetimeSaver and now its highly customizable, so that it can fit your needs.
Functions: Notification at your defined target/signal Notificatio

SupportResistance - это динамический индикатор поддержки и сопротивления, основанный на максимуме и минимуме предыдущих свечей.
Параметры расчета настраиваются. Вы можете использовать максимальное и минимальное значения предыдущей свечи в качестве ориентира, или вы можете использовать максимум и минимум группы предыдущих свечей.
Индикатор использует красную линию для обозначения сопротивления и зеленую линию для обозначения поддержки.
Когда уровень поддержки или сопротивления пробит, его

Time Session OPEN-HIGH-LOW-CLOSE This Indicator Will Draw Lines Of OHLC Levels Of Time Session Defined By User. It Will Plot Floating Lines On Current Day Chart. Time Session Can Of Current Day Or Previous Day. You Can Plot Multiple Session Lines By Giving Unique ID To Each Session. It Can Even Show Historical Levels Of Time Session Selected By User On Chart To Do Backdating Test. You Can Write Text To Describe The Lines.
FREE

CPR Pivot Lines It Will Draw Pivot Point R1,R2,R3 S1,S2,S3 Tc Bc Best Part Is That You Can Even Add Values Of High,Low,Close Manually Also To Get Your All Levels On Chart.So If Your Broker Data Of High ,Low ,Close Is Incorrect Then You Don’t Have To Depend On Them Anymore. You Can Even Modify All Lines Style. It Will Show Line In Floting Style And Not Continues Mess.
FREE

This indicator implements the logic behind Traders Dynamic Index to the classic MACD Indicator. It helps to find powerful trende changes and ignore meaningless ones. It is simply the classic MACD indicator plotted with volatility bands on top designed with the sole purpose of being able to ignore trend changes that do not follow an over-extension or over-contraction of the market. The indicator alerts on trend changes after the volatility bands have been breached and implements alerts of all ki
FREE

This indicator uses the metaquotes ZigZag indicator as base to plot fibonacci extension and fibonacci retracement based in the Elliot waves. A fibonacci retracement will be plotted on every wave draw by the ZigZag. A fibonacci extension will be plotted only after the 2nd wave.
Both fibonacci will be updated over the same wave tendency. Supporting until 9 consecutive elliot waves.
Parameters:
Depth: How much the algorithm will iterate to find the lowest and highest candles Deviation: Amoun
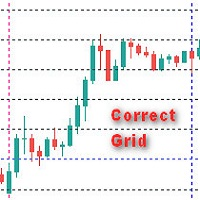
Общие сведения Индикатор отображает правильную сетку с задаваемым в параметрах шага в пунктах , что позволяет более точно визуально оценить масштаб и размер ценовых движений. Параметры индикатора
Step - шаг сетки в пунктах по вертикали Figure - шаг фигуры MaxBars - ограничение истории (0 - вся история)
Цвет вертикальных лини color new_day - Цвет новый день new_week - Цвет новая неделя new_mon - Цвет новый месяц
Цвет горизонтальных линий new_Hfigure - Цвет

Эта информационная панель представляет собой инструмент оповещения для использования с индикатором разворота структуры рынка. Его основная цель - предупредить вас о возможностях разворота на определенных временных рамках, а также о повторных проверках предупреждений (подтверждении), как это делает индикатор. Панель инструментов предназначена для самостоятельного размещения на графике и работы в фоновом режиме, чтобы отправлять вам оповещения о выбранных вами парах и таймфреймах. Он был разработ
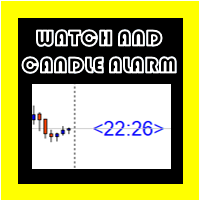
Osw Watch для METATRADER 5
Это индикатор, который показывает оставшееся время до истечения текущей свечи на часах, он всегда расположен рядом с последней свечой, следующей за ценой, числа отображаются так же, как на изображениях, и могут быть изменены как по размеру. и цвет.
между вашими настройками вы можете установить:
размер чисел, показывающих время.
цвет цифр, показывающих время.
Также в конфигурации вы можете активировать и деактивировать, чтобы сигнал тревоги звучал каждый раз,
Индикатор арахиса
Этот индикатор указывает тренд толстой синей и красной ЛИНИЕЙ на основе золотого креста, мертвого креста и MACD. Вы можете свободно настраивать число в настройках параметров (период скользящей средней, значение MACD).
Таким образом, вы можете настроить этот индикатор в соответствии с типом вашей торговой валюты, периодом и т. Д. Номер этого индикатора по умолчанию подходит для торговли USD / JPY M30 или H1.
КАК ИСПОЛЬЗОВАТЬ ЗЕЛЕНАЯ ЛИНИЯ: ПОДЪЕМ, КУПИТЬ КРАСНАЯ ЛИНИЯ: ПАД
Объемные уровни - очень важный показатель для биржевой торговли. На таких уровнях, совершалось больше всего сделок. В будущем, ч асто цена отбивается от таких уровней, и это можно с успехом применять в торговле. Данный индикатор умеет определять уровни, на которых было больше всего объёма за указанный промежуток истории. Эти уровни отображаются линиями, параметры для определения уровней можно настраивать. Кроме отображения, этот индикатор может сообщать пользователю, когда цена касается уровня,
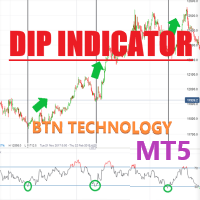
DIP Indicator Oshime Индикатор DIP Осимэ Этот индикатор основан на Осимегай (покупка на провалах). Это основано на линии скользящей средней, поэтому этот индикатор указывает линии, основанные на долгосрочном и краткосрочном тренде. Так что этот индикатор полезен, когда вы торгуете с краткосрочным флеймом. Следовательно, вы можете легко найти в пламени M5 или M15 и M30 , когда вам следует получить позиции на продажу или покупку. КАК ИСПОЛЬЗОВАТЬ Синяя стрелка вверх - цена пойдет вверх

The market price usually falls between the borders of the channel .
If the price is out of range , it is a trading signal or trading opportunity .
Basically , Fit Channel can be used to help determine overbought and oversold conditions in the market. When the market price is close to the upper limit, the market is considered overbought (sell zone). Conversely, when the market price is close to the bottom range, the market is considered oversold (buy zone).
However, the research can
Developed to assist in binary options retracement operations, this indicator will show the assets with the best retracement percentages!
How it works: The indicator will calculate the total length of each candle from low to high, the total of the body and total of shadows (up and down) and calculate a total shadows percentage of various configurable assets. The counter is updated with each new candle.
ATENTION: Demo on the estrategy tester is not functional to show multiple assets.

九转序列,源自于TD序列,是因TD序列的9天收盘价研判标准而得名。 汤姆·德马克(Tom DeMark)技术分析界的着名大师级人物,创建了以其名字首字母命名的TD系列的很多指标,价格反转的这个指标就是其中重要的一个,即TD序列。 德马克原版TD序列指标要复杂一些,想研究就自行看关于德马克的资料吧。这里只说简单的TD序列(九转序列)。 九转序列分为两种结构,低九买入结构和高九卖出结构。 TD高九卖出结构:连续出现的九根K线,这些K线的收盘价都比各自前面的第四根K线的收盘价高, 如果满足条件,就在各K线上方标记相应的数字,最后1根就标记为9,如果条件不满足,则K线计数中断,原计数作废重新来数K线。如出现高9,则股价大概率会出现转折。 TD低九买入结构:连续出现的九根K线,这些K线的收盘价都比各自前面的第四根K线的收盘价低,如果满足条件,就在各K线下方标记相应的数字,最后1根就标记为9,如果条件不满足,则K线计数中断,原计数作废重新来数K线。如出现低9,则股价大概率会出现转折。
结构的本质是时间和空间的组合,时间是横轴,空间是纵轴,不同的时间周期和空间大小的组合,形成不同的结构形态,不同

Investment Castle Volatility Index has the following features: 1. This indicator shows the volumes of the current symbol and the market volatility. 2. This indicator is built-in in the Investment Castle EA which works as volatility index for the EA dynamic distance and opposite start. 3. Parameters available for optimization for each pairs. 4. Works with any chart.
FREE

Ищет сильные движения цены и по их завершении рисует уровни. Силу движения вы определяете самостоятельно, указав в настройках количество пунктов и количество свечей одинакового цвета подряд в одном направлении. В настройках есть 2 типа построения: extrenum - high/low close - цена закрытия Так же можно регулировать количество отображаемых уровней и число свечей для расчетов. По умолчанию в настройках указано 5 уровней для 360 свечей. То есть будет вычислено 5 уровней для сильных движений вверх
FREE
Developed to assist in binary options retraction operations, this indicator will show the best assets to operate retractions!
How it works: The indicator will calculate the total length of each candle from low to high, the total of the body and total of shadows (up and down) and calculate a total shadows percentage of various configurable assets. The counter is updated with each new candle.
ATENTION: Demo on the estrategy tester is not functional to show other assets, but still can show how

Donchian通道(唐奇安通道指标)是用于交易突破的最古老、最简单的技术指标之一。 一般来说,唐奇安通道的宽度越宽,市场波动就越大,而唐奇安通道越窄,市场波动性也就越小 。此外,价格走势可以穿过布林带,但你看不到唐奇安通道的这种特征,因为其波段正在测量特定时期的最高价和最低价。 交易实用必备工具指标 波浪自动计算指标,通道趋势交易 完美的趋势-波浪自动计算通道计算 , MT4版本 完美的趋势-波浪自动计算通道计算 , MT5版本 本地跟单复制交易 Easy And Fast Copy , MT4版本 Easy And Fast Copy , MT5版本 本地跟单复制交易 模拟试用 Easy And Fast Copy , MT4 模拟账号运行 Easy And Fast Copy , MT5 模拟账号运行 唐奇安通道指标计算: 唐奇安上阻力线 - 由过去N天的当日最高价的最大值形成。 唐奇安下支撑线 - 由过去N天的当日最低价的最小值形成。 中心线 - (上线 + 下线)/ 2 唐奇安通道信号 唐奇安通道常用作突破指标。它提供了两种主要类型的突破信号,一个是上阻力线或下支
FREE

KDJ Index 4 交易实用必备工具指标 波浪自动计算指标,通道趋势交易 完美的趋势-波浪自动计算通道计算 , MT4版本 完美的趋势-波浪自动计算通道计算 , MT5版本 本地跟单复制交易 Easy And Fast Copy , MT4版本 Easy And Fast Copy , MT5版本 本地跟单复制交易 模拟试用 Easy And Fast Copy , MT4 模拟账号运行 Easy And Fast Copy , MT5 模拟账号运行 "Cooperative QQ:556024 " "Cooperation wechat:556024" "Cooperative email:556024@qq.com" 强烈推荐趋势指标, 波浪的标准自动计算 和 波浪的标准自动计算MT5版本
KDJ指标又叫 随机指标 ,是一种相当新颖、实用的技术分析指标,它起先用于期货市场的分析,后被广泛用于股市的中短期趋势分析,是期货和股票市场上最常用的技术分析工具。 随机指标KDJ一般是用于股票分析的统计体系,根据统计学原理,通过一个特定的周期(常为9日、9周等
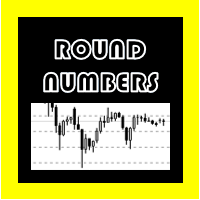
КРУГЛЫЕ ЧИСЛА (для Metatrader 5)
Этот индикатор позволяет добавлять горизонтальные линии в соответствии с круглыми числами, содержащимися в активе.
В отличие от других индикаторов, этот рассчитывает ближайшие уровни динамически и автоматически по мере движения цены.
работает с валютными парами, индексами, металлами, акциями и т. д.
Округлить 5-значным, 3-значным и целым числом 10 100 или 1000.
линии можно настроить в таких параметрах, как:
Скройте строку или круглое число, котор
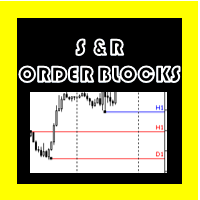
ОПОРНЫЕ ЛИНИИ И РЕЗИСТОРЫ + КОМАНДНЫЕ БЛОКИ для METATRADER 5
Гораздо более приятный визуальный способ определения уровней поддержки и сопротивления, в отличие от обычных горизонтальных линий, они могут быть расположены от определенной точки, не расширяясь назад, что делает график не лучшим, а также показывает название временного периода, в котором он был создан. так что когда вы работаете, вы можете знать, к какой временной области он принадлежит.
Вы также можете создавать блоки заказов удо
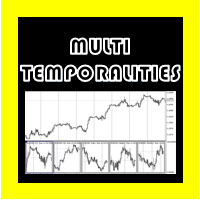
НЕСКОЛЬКО ВРЕМЕНИ ДЛЯ METATRADER 5
Этот индикатор в нижнем окне показывает текущий график на разных таймфреймах, это может помочь вам лучше расшифровать рынок с учетом старших таймфреймов.
Среди настроек, которые вы можете изменить:
просмотр цен в графиках просмотр темпоральностей на графиках включить каждую графику в разных временных рамках (M1, M5, M15, H1, H4, D1, W1, MN1).

Автоматическая поддержка и сопротивление Osw MT5
Этот индикатор отображает линии на возможных точках поддержки и сопротивления выбранного актива.
он работает во множестве темпоральностей.
позволяет настроить:
Цвет линий. Ширина линий. Тип линий. Когда индикатор начинает свою работу, он анализирует поддержки и сопротивления более высоких уровней в зависимости от времени, в котором он работает.

Представляю индикатор для профессионалов. Prof MACD по виду и своим функциям сильно напоминает классический MACD , но строится на абсолютно иных алгоритмах (к примеру, у него только один период усреднения) и более робастный, особенно на малых таймфреймах, поскольку фильтрует случайные блуждания цены. Классический индикатор MACD ( Moving Average Convergence/Divergence ) — это следующий за тенденцией индикатор, основанный на соотношении между двумя скользящими средними, а именно EMA

Automatic Fibonacci Retracement Line Indicator. This indicator takes the current trend and if possible draws Fibonacci retracement lines from the swing until the current price. The Fibonacci levels used are: 0%, 23.6%, 38.2%, 50%, 61.8%, 76.4%, 100%. This indicator works for all charts over all timeframes. The Fibonacci levels are also recorded in buffers for use by other trading bots. Any comments, concerns or additional feature requirements are welcome and will be addressed promptly.
FREE

The third indicator from the set for market analysis. The first one is here: https://www.mql5.com/ru/market/product/65258 The second one is here: https://www.mql5.com/ru/market/product/65347
The indicator builds a channel of maximum price fluctuations for a specified period. Additionally, the middle of the channel is drawn.
All color settings, line types are customizable.
The indicator allows you to see the picture of price movement from a slightly different angle. You can use several in

The second indicator from the set for market analysis. The first one is here: https://www.mql5.com/ru/market/product/65258
The indicator draws a line by levels where the price reaches a aliquot of the value in the Step parameter. You can specify the spread of + - points from the required level.
All color settings, line types are customizable.
Example: Step - 500 Deviation - 20 If the symbol reaches the price for example 1.73500 + - 20, i.e. from 1.73480 to 1.73520, lines are being built.

I am placing the indicator obtained as a result of market analysis, it may be useful to someone. The indicator shows how quickly the price changes (where there is a trend), and where there is no obvious trend. With the right settings, you can know the beginning of the trend in advance.
The indicator measures the slope / rate of change / ratio of the moving average on the current bar relative to the previous bar.
The settings specify the ratio limit for a downtrend and a ratio limit for an u

Forex Indicator Arrows is an arrow Indicator used as an assistant tool for your trading strategy. The indicator analyzes the standard deviation of bar close for a given period and generates a buy or sell signals if the deviation increases. It good to combo with Martingale EA to follow Trend and Sellect Buy Only/Sell Only for EA work Semi-Automatic. You can use this Indicator with any EAs in my Products.
FREE
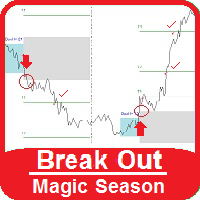
<< See how it works on YouTube >>
Possibilities:
Arrow signal to buy, sell and hit the targets Alert signal send mail Execute custom audio file The Break Out Magic indicator monitors price fluctuations over a set period of time (adjustable rectangle). Then, according to the maximum and minimum price, in the second rectangle, it determines the outline break lines. And sets 3 goals to exit from each side. In the settings we have:
Start Time: Start time of range
End Time: The end of range tim
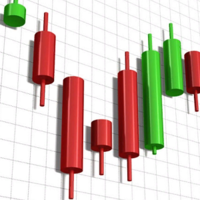
Индикатор разработан для отображения свечей (баров) старшего таймфрейма, на текущем. Индикатор имеет множество настроек отображаемых свечей, а также звуковой сигнал, который прозвучит за несколько минут (секунд) до закрытия бара. Входные параметры: BarsCount=50 - количество отображаемых баров старшего таймфрема Auto_Candle_UP_TF = false - Автоматический выбор старшего таймфрейма Candle_UP_TF=PERIOD_H1 - Старший таймфрейм, если Auto_Candle_UP_TF = false Signal_Close_Candle_UP_TF=false - Звуковой

Индикатор MaxMinTrend отображает на графике максимумы и минимумы цены. Данный индикатор был создан для упрощения определения направления тренда, а также для сопровождения открытых позиций, путем переноса Stoploss по текущим максимумам и минимумам цены, тем самым получая большую прибыль. Данный индикатор не перерисовывается.
Входные параметры:
BarsCount - 1000 - Количество баров для рисования индикатора
maxmin - true - Включено отображение Максимумов и Минимумов
line - true - Включено о

Индикатор Flat Horizontal Channel Range Price автоматически строит горизонтальный канал (диапазон) цены на старшем или текущем таймфрейме. Данный индикатор был разработан для упрощенного определения боковых движений рынка, а также поиска сигналов входа на отбой от границ канала (диапазона) или на его пробой.
Входные параметры:
BarsCount - 1000 - Количество баров для поиска горизонтального канала AutoPeriodDraw - true - Включено автоматическое построение горизонтального канала на старшем тай

Phi Cubic Fractals Pack1A with FuTuRe PACK 1A é uma melhoria sobre o Pack 1 que inclui a possibilidade de selecionar as linhas LINE 4/8/17/34/72/144/305/610 individualmente. Este produto contém os indicadores do PACK 1A (Lines + LineSAR + Channels + BTL + Ladder) + MODO FUTURO Phi Lines - medias moveis especiais, semelhantes às MIMAs do Phicube, capazes de indicar com muita clareza tanto a tendencia como a consolidação; Phi LineSAR - apaga ou destaca as Phi Lines para mostrar apenas as linha

Индикатор выводит на график размер спреда по текущему инструменту. Очень гибок в настройках. Есть возможность задать максимальное значение спреда, по превышении которого, сменится цвет надписи спреда, и прозвучит сигнал (если включено в настройках). Индикатор будет очень удобен людям, которые торгуют на новостях. Вы никогда не войдете в сделку с большим спредом, так как индикатор вас об этом уведомит как визуально так и звуком. Входные параметры: AlerT - true - включен звуковой сигнал при превыш
FREE

For those who need a Volume Profile / Market Profile indicator, here is the solution!
It contains the essential information:
Control Point (POC); Higher Value Area (VAH); Lower Value Area (VAL); You can choose to SHOW or NOT SHOW the volume Histogram, according to your wish. If you choose to show the histogram, note that according to the type of asset, it is necessary to adjust the scale of the indicator (last parameter of the indicator).
You can also choose from the data source of your h

индикатор показывает стрелки купли/продажи на факторе волатильности. индикатор не перерисовывается! работает на любом валютном паре и на любом таймфрейме. индикатор протестировано и показывает неплохие результаты как в качестве фильтра, так и в виде основного генератора сигналов (проверьте скриншоты). возможно находит сотни прибыльных настроек некоторые из которых показаны на скриншотах. в настройках имеются следующие параметры: N-период волатильности; Level-уровень волатильности; Reverse-true/f

Условный диапазон Вильямса (WCR) - это индикатор технического анализа, применяемый для определения состояния перепроданности / перекупленности рынка на основе изучения позиции цены закрытия в заданном диапазоне, образованном экстремумами за прошлые периоды, и для поиска расхождений, указывающих на вероятность разворота. Он позволяет оценить, оказали ли покупатели или продавцы более сильное влияние на цену в течение определенного периода времени, и предположить дальнейшее развитие событий. Инди
FREE
А знаете ли вы, почему MetaTrader Market - лучшее место для продажи торговых стратегий и технических индикаторов? Разработчику у нас не нужно тратить время и силы на рекламу, защиту программ и расчеты с покупателями. Всё это уже сделано.
Вы упускаете торговые возможности:
- Бесплатные приложения для трейдинга
- 8 000+ сигналов для копирования
- Экономические новости для анализа финансовых рынков
Регистрация
Вход
Если у вас нет учетной записи, зарегистрируйтесь
Для авторизации и пользования сайтом MQL5.com необходимо разрешить использование файлов Сookie.
Пожалуйста, включите в вашем браузере данную настройку, иначе вы не сможете авторизоваться.