Conheça o Mercado MQL5 no YouTube, assista aos vídeos tutoriais
Como comprar um robô de negociação ou indicador?
Execute seu EA na
hospedagem virtual
hospedagem virtual
Teste indicadores/robôs de negociação antes de comprá-los
Quer ganhar dinheiro no Mercado?
Como apresentar um produto para o consumidor final?
Novos Indicadores Técnicos para MetaTrader 4

on free demo press zoom out button to see back.. cnt number is bar numbers.you can change up to 3000 related to chart bars numbers. minimum value is 500. there is g value set to 10000. sometimes need to lower or increase. and if they need can make small change on it.
this indicator almost grail,no repaint and all pairs ,all timeframe indicator. there is red and blue histograms. if gold x sign comes on red histogram that is sell signal. if blue x sign comes on blue histogram that is buy signal.

You can visually backtest Elliot Wave Impulse to see how it behaved in the past!
Manual guide: Click here Starting price of $49 for the first 25 copies ( 12 left)! -- Next price is $99 .
This indicator is unstoppable when combined with our other indicator called Katana . After purchase, send us a message and you could get it for FREE as a BONUS! The Elliot Wave Impulse is a pattern identified in the Elliott Wave Theory, a form of technical analysis used to a
Apresentando o indicador "TW trend sniper" , um indicador poderoso que é usado para identificar as principais tendências usando a fórmula exclusiva do indicador "Trade Wizards" junto com o uso de ação de preço, detecção de sessões de negociação de moeda, Fibonacci e funções de detecção e métodos de remoção de ruído de inteligência artificial com alta precisão. esta estratégia desenvolvida pelo "grupo Trade Wizards", composto por traders experientes e programadores especializados, es

Com esta ferramenta de negociação, você pode analisar 15 mercados simultaneamente.
Apresentando o novo indicador de negociação 2024:
️ Dashboard Multi Moeda Multi Time Frame Double RSI.
Há pelo menos duas razões pelas quais criei esta ferramenta de negociação:
Primeiro, estou cansado de observar apenas um mercado. Segundo, não quero perder o momento de entrada em outro mercado.
É por isso que quero conhecer outras condições de mercado ao mesmo tempo.
Por esta razão, preciso de um s
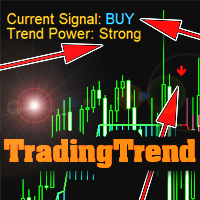
The indicator is not redrawn.
Can be used as a ready-made trading strategy.
Shows: Trend direction; Trend strength; Points of trend reversal or fading. Settings: Trend sensitivity (the lower, the more accurate) - operating sensitivity (the higher, the more accurate); Calculation method - calculation method; Info position - angle of location of the info label (or remove); Text Color - text color; Trend Color Buy - color of the BUY text; Trend Color Sell - SELL text color; Sound Alert - Pop-up

Introduction
The Price Action, styled as the "Smart Money Concept" or "SMC," was introduced by Mr. David J. Crouch in 2000 and is one of the most modern technical styles in the financial world. In financial markets, Smart Money refers to capital controlled by major market players (central banks, funds, etc.), and these traders can accurately predict market trends and achieve the highest profits.
In the "Smart Money" style, various types of "order blocks" can be traded. This indicator

Introduction
The "Smart Money Concept" transcends mere technical trading strategies; it embodies a comprehensive philosophy elucidating market dynamics. Central to this concept is the acknowledgment that influential market participants manipulate price actions, presenting challenges for retail traders.
As a "retail trader", aligning your strategy with the behavior of "Smart Money," primarily market makers, is paramount. Understanding their trading patterns, which revolve around supply
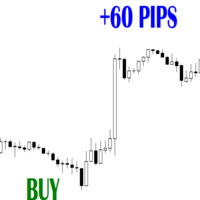
Outras ferramentas de volume para combinar: https://www.mql5.com/en/market/product/72744 Identificação de extremos de alto volume: Posicione o indicador como uma ferramenta poderosa para os traders identificarem períodos de intensa pressão de compra ou venda. Destaque como o buffer primário do indicador, que utiliza volume, ajuda os traders a identificar picos de volume que indicam maior atividade de mercado. Enfatize a importância desses extremos de alto volume na sinalização de possíveis rev
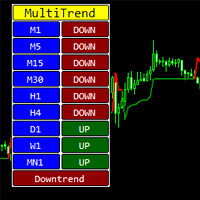
The indicator shows the direction of the trend on different timeframes.
Timeframes can be disabled in the settings.
The bottom line of the indicator reports the prevailing trend - up or down.
The indicator can be used on any trading instruments - currencies, stocks, futures, indices, metals, cryptocurrencies.
This indicator can be used as an independent trading system or as an addition to another system.

It just the main chart sign of the "KingSequence" indicator.
Here is the detals from the "KingSequence" indicator
Slide 1: Title Slide Title: Unveiling Market Rhythms with Advanced Price Momentum Analysis Subtitle: A Revolutionary Trading Indicator Powered by Proprietary Oscillators Slide 2: Problem Title: The Challenge of Timely Market Entry and Exit Traders struggle to identify precise entry and exit points for maximum profitability. Existing indicators often lag behind price action, leadi

Title: BBMA Structure Guide - BBMA Structure Guide
Description: BBMA Structure Guide is a specialized MQL4 indicator designed to help traders understand the journey of BBMA structure more easily and efficiently. BBMA, or "Bollinger Bands Moving Average," is known for its motto "One Step Ahead," highlighting the importance of understanding market structure in depth.
With BBMA Structure Guide, you can quickly identify the underlying market structure patterns that drive price movements. This w
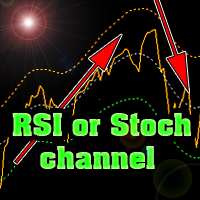
The indicator plots Stochastic or RSI levels in the price channel of a trading instrument.
Download the indicator for FREE right now and test it in the strategy tester.
It is easy to determine the trend direction and overbought or oversold levels.
The settings are standard for any of these indicators.
It is possible to change settings for each trading instrument separately.
You can use currencies, stock markets, futures or cryptocurrencies.
The indicator can be used as an independen
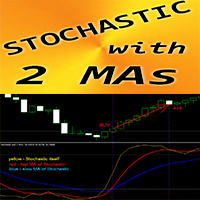
Indicador Forex "Estocástico e 2 Médias Móveis" para MT4
O oscilador estocástico é um dos melhores indicadores do mercado – ferramenta perfeita para muitos traders. O indicador "Estocástico e 2 Médias Móveis" permite que você veja as médias móveis rápidas e lentas do oscilador estocástico Zona de sobrecompra – acima de 80; OverSold um - abaixo de 20 É ótimo receber entradas de venda acima de 80 zonas e entradas de compra abaixo de 20 Você pode ver as condições de entrada de Compra e Venda nas

Introducing the K-Level Indicator: A Powerful Tool for Unveiling Hidden Trading Opportunities In the dynamic world of trading, identifying high-probability trading opportunities is crucial for success. However, sifting through the vast amount of market data can be a daunting task, often leading to missed opportunities or ill-informed decisions. To address this challenge, we present the K-Level Indicator, a revolutionary tool designed to empower traders with unparalleled insights into market stru
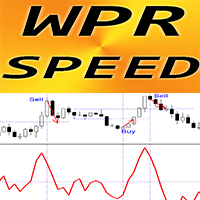
Indicador Forex "WPR SPEED" para MT4 - ótima ferramenta preditiva!
O cálculo deste indicador é baseado em equações da física. WPR SPEED é a primeira derivada do próprio oscilador WPR WPR SPEED é bom para scalping de entradas em mercados laterais e planos O indicador WPR SPEED mostra a rapidez com que o próprio WPR muda de direção - é muito sensível Recomenda-se usar o indicador WPR SPEED para estratégias de negociação de scalping de impulso: encontre picos de tamanho grande do indicador - abr

The Deep Space Divergence indicator carefully analyzes price dynamics, identifying temporary weakening of the trend or sharp changes in its direction. By monitoring the readings of this indicator, you can easily notice changes in the market and take appropriate action. Entering the market may be easy, but staying in it is much more difficult. With Deep Space Divergence, you will have a reliable base to successfully stay ahead of the trend. This indicator allows you to analyze historical data an
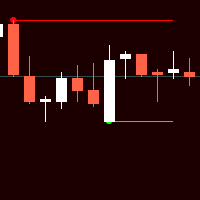
Индикатор Форекс и бинарных опционов основан на простых паттернах из двух свечей. Стрелки вообще не рисуют. Даже при смене таймфреймов.
В настройках можно включить или отключить линию уровня.
Также в настройках можно менять коды стрел, их цвета (также цвета линии уровней), Размер и расстояние от свечи (баров).
Индикатор прост в применении. А настройки тоже не сложные. Единственно не рекомендуется увеличивать период (step). По умолчанию прописано 500. Больше этого уже загружает терминал.
FREE
This is a trial version, you can only replay one day's Bar! Full version: https://www.mql5.com/en/market/product/117203
Please put this file into the folder in MQL4\Indicators\
This indicator is not an EA,so it does not have the 'ORDER' function. It only simulates placing orders, so please use it with confidence.
Instructions for use: |←:Choice Bar. →:Start.You can also press the 'X' key on the keyboard to go back and the 'Z' key to go forward. X1:Bar Speed. →|:Back to current time.
N
FREE
This indicator is not an EA,so it does not have the 'ORDER' function. It only simulates placing orders, so please use it with confidence.
Instructions for use: |←:Choice Bar. →:Start.You can also press the 'X' key on the keyboard to go back and the 'Z' key to go forward. X1:Bar Speed. →|:Back to current time.
Note: If you pull too far forward in the big period, Bar in the small period may not read that far forward. At this time, you must first reduce the picture to the minimum, then press a

Graf Mason is a tool that will make you a professional analyst! The method of determining wave movements using inclined channels qualitatively conveys the schematics of the movement of any instrument, showing not only possible reversals in the market, but also the goals of further movements!Destroys the myth that the market is alive , clearly showing the schematics of movements from one range to another! A professional tool, suitable for the medium term with the definition of the current trend!
The indicator determines the ATR value (points) in a classic way (taking into calculation paranormal bars/candles) and more correctly - ignoring paranormal movements of the Instrument. Correctly it is excluding paranormal bars from the calculation, extremely small bars (less than 5% of the standard ATR) and extremely large bars (more than 150% of the standard ATR) are ignored. The Extended version - allows you to set calculation parameters and a lot of other input parameters Ver
FREE
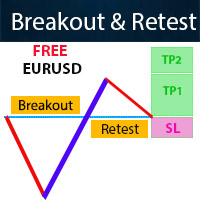
Contact me for any questions All Symbols version! It is free on EURUSD chart. Introduction The breakout and retest strategy is traded support and resistance levels. it involves price breaking through a previous level. The strategy is designed to help traders do two main things, the first is to avoid false breakouts. Many false breakouts start with a candlestick that breaks out of a level but ends with an immediate candlestick that brings the price back into the level. The second thing that the
FREE

Market Magnet - This is not just a convenient tool, but rather an indispensable assistant for those who prefer to analyze the market using a clean chart. Sometimes even experienced traders need an additional analytical tool to identify key entry and exit points for trades. That's where Market Magnet comes in.
This indicator is ideal for those who often have difficulty identifying trend inflection points or drawing trend lines on a chart. It offers a visual representation of key market moments

EMA Above Below Bid price Технический индикатор в помощь трейдеру. Данный индикатор, показывает расположение пяти ЕМА,
пяти средних скользящих, относительно цены формирующей японские свечи или бары (цена Bid ).
О понятии ЕМА.
Скользящая средняя (moving average, MA) — это дополнительная линия на графике цены актива.
Внешне она повторяет график цены, но с небольшим запозданием и более гладко, без колебаний. Основные характеристики:
1. Показывает тренды. Если скользящая устрем
FREE

High and Low Levels EMA Технический индикатор в помощь трейдеру. Однажды пришла идея при изучении индикатора Moving A verage ( MA ).
Так как мувинги эти сглаженное, среднее значения цены за выбранный период, то как и у обычной цены и у мувинга
должны быть «хаи и лои».
Данный индикатор, показывает уровни High и Low . Динамических уровней поддержки и сопротивления.
О понятии High и Low .
Хай — от английского high — обозначает наиболее высокую цену («рынок на хаях » — капитализ
FREE
AlphaTrend AM is an indicator that allows you to open a position at the very beginning of a significant price movement. The second most important quality of the indicator is the ability to follow the trend as long as possible in order to obtain all potential profits while minimizing potential losses. The indicator allows you to notify the user about your signals by sending messages to the terminal and e-mail. This indicator does not repaint or not recalculate.
The indicator is a synthesis of t

Introduction
"Smart money" is money invested by knowledgeable individuals at the right time, and this investment can yield the highest returns.
The concept we focus on in this indicator is whether the market is in an uptrend or downtrend. The market briefly takes a weak and reversal trend with "Minor BoS" without being able to break the major pivot.
In the next step, it returns to its main trend with a strong bullish move and continues its trend with a "Major BoS". The "order bloc

This indicator will show week and monthhigh low, very useful to understand the market sentiment. To trade within the range/ break out. Low- can act as support- can used for pull back or break out High- can act as resistance- can used for pull back or break out Breakout strategy refers to the day trading technique that provides traders with multiple opportunities to go either long or short . The main idea is to identify the trend in its most juicy state followed by a trending move.
FREE
Highly configurable Trader Dynamic Index (TDI) indicator.
Features: Highly customizable alert functions (at levels, crosses, direction changes via email, push, sound, popup) Multi timeframe ability (higher and lower timeframes also) Color customization (at levels, crosses, direction changes) Linear interpolation and histogram mode options Works on strategy tester in multi timeframe mode (at weekend without ticks also) Adjustable Levels Parameters:
TDI Timeframe: You can set the lower/higher
FREE

The indicator defines the buy and sell arrows with high performance and consistent results. Suitable for trend trading or following the trend. Automatic analysis of market opportunities ; Help traders earn more from their investments;
Never repaints, recalculates or backpaints signals; This is FREE demo version of the indicator and works only on "EUR USD M5" . The demo version does not work on SUFFIX OR PREFIX brokers ! Forex Trend Commander All details about the indicator here :
FREE

Safe Trade Indicator MT4
The Safe Trade indicator is an analytical and technical tool that has different features and very accurate signals. This indicator can be used in various markets such as the stock market and the forex market. It states and also provides buy and sell signals.
Features of the Safe Trade indicator
Receiving signals as notifications on the Metatrader mobile application. Receive signals by email. Receiving signals in the form of warning messages or alarms on Metatrader.

Best strategy,
Easy trade ,
Support of version update in the future MT My Way: develop for new traders with no experience It is a very simple trade. Open the order when there is signal
and close the order when there is exit or found the next opposite signal. For experienced traders, It will be very easy to trade.
TRADE: Forex
TIME FRAME: All Time Frame
SYMBOL PAIR: All Symbol
SETTINGS:
CALCULATE BARS: Value or bars used must be large enough to calculate the formula. Fo

TrendWave Oscillator is an advanced MT4 oscillator that not only identifies the trend direction but also provides visual and audio alerts to enhance trading strategies.
Key Features: - Color-coded trend indication: - Blue : Indicates an uptrend, signaling potential price growth. - Orange : Indicates a downtrend, suggesting possible price decline. - Gray : Represents a flat market or lack of clear entry signals.
- Graphical signals on the chart : - Aqua : Highlights an uptrend, empha

TLBD Chart Indicator MT4
Drawing a trend line in price charts is one of the most important methods to identify the market trend, many traders use the trend line break for positioning because they believe that the trend line break means changing the trend and creating a new trend. As a result, the breaking of the trend line is an important sign for traders to open their positions in the direction of the trend. The TLBD indicator is a very suitable tool for detecting the breaking of dynamic tren
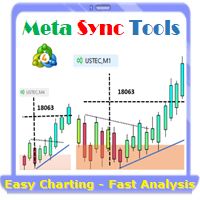
Supercharge Your MetaTrader Analysis with MT4 Sync Tools! Struggling to analyze price action across different timeframes? Meta Sync Tools eliminates the frustration of unsynced crosshairs and charts, allowing seamless multi-timeframe analysis. Missing key correlations between assets and constantly switching between charts? Meta Sync Tools empowers you to visualize relationships between instruments effortlessly. Tired of wasting time on repetitive tasks? With 30+ Customizable Shortcuts, streamli

Slide 1: Title Slide Title: Unveiling Market Rhythms with Advanced Price Momentum Analysis Subtitle: A Revolutionary Trading Indicator Powered by Proprietary Oscillators Slide 2: Problem Title: The Challenge of Timely Market Entry and Exit Traders struggle to identify precise entry and exit points for maximum profitability. Existing indicators often lag behind price action, leading to missed opportunities and potential losses. Slide 3: Solution Title: Introducing a Cutting-Edge Trading Indicator

Use GANN 369 to use a combination of 30's,60's,90's time to cross 3's,6's,9's. Any larger combination of these cross smaller combinations of these
Using GANN 369 Method for Trading Reversals The GANN 369 method, inspired by the works of W.D. Gann and Nikola Tesla's 3, 6, 9 numerical patterns, can be employed to identify potential reversals in financial markets. By combining specific periods (30, 60, and 90) with the numbers 3, 6, and 9, traders can seek opportunities for trend changes.

The indicator defines the buy and sell arrows with high performance and consistent results. Suitable for trend trading or following the trend. Automatic analysis of market opportunities ; Help traders earn more from their investments;
Never repaints, recalculates or backpaints signals; This is FREE demo version of the indicator and works only on "GBP USD H1" . The demo version does not work on SUFFIX OR PREFIX brokers ! ProTrading Arrow - All details about the indicator here : Work
FREE

The indicator defines the buy and sell arrows with high performance and consistent results. Suitable for trend trading or following the trend. Automatic analysis of market opportunities ; Help traders earn more from their investments;
Never repaints, recalculates or backpaints signals; This is FREE demo version of the indicator and works only on " USDJPY M30" . The demo version does not work on SUFFIX OR PREFIX brokers ! ProTrading Arrow - All details about the indicator here : Wor
FREE

77% discount for the next 10 buyers (original price $605) 3 Indicators in 1 indicator
Strategy based on price action
Made specifically for the best forex currency pairs
Can be used in the best time frame of the market
at a very reasonable price This indicator is basically 3 different indicatos . But we have combined these 3 indicators in 1 indicator so that you can use 3 indicators at the lowest price.
All three strategies are based on price action. But based on different trends. Long term

- It is 30$ now - 50% Discount (Real price is 60$) Contact me for instruction, any questions! Introduction Triangle chart patterns are used in technical analysis , which is a trading strategy that involves charts and patterns that help traders identify trends in the market to make predictions about future performance.
Triangle Pattern Scanner Indicator It is usually difficult for a trader to recognize classic patterns on a chart, as well as searching for dozens of charts and time frames w
Our custom Kalman Filter indicator is a sophisticated, adaptive tool designed for MetaTrader 4 (MT4), giving traders a dynamic approach to analyzing the financial markets. This indicator is based on the Kalman Filter algorithm, a powerful statistical method used to estimate linear dynamic systems. It is specifically designed for traders who need an advanced, responsive tool to monitor market trends and make informed decisions. We have slightly modified the algorithm for this filter to provide b
"NEXT GENERATION ARROWS INDICATOR, SMALL LOSSES BIG PROFITS!" Buy Infinity Trend Commander MT4 Indicator And You Will Get Trends Reversing PRO Indicator for FREE !
Breakthrough system that determines the beginning of key points in any market . Indicator is a complex system based on unique knowledge filters all market conditions.
It works equally well in sideways and trending market allowing you to trade from the safe side of the market. Infinity Trend Commander identify th
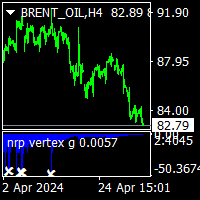
nrp vertex g indicator is no repaint vertex indicator. it works all time frame and all pairs. working princible is wery easy and can use beginners. when histogram up side and there is a white star on it that is buy signal.. and reverse signal sell comes when histogram below zero and white star on it.that is sell signal. indicator hold long time to signal.and it is not neccesary to stay on computer. minimum bar number is 500 bars on chart to work of it. and the cnt nr is minimum 500 can be. but p

volatility level indicator is a volatility oscillator to see trend reversal points. price trends has reverese when volatility inreased . this indicator show trend reversal points volatility. mostly same level up and down volatility is reversal points. red colour shows up points of volatilty.and probably trend will down. blue colour oscillator shows deep point of price when increased volatiliyty. on pictures horizontal lines on oscillator has drawed by hand.to see the before level and compare now

Symbols must be separated by commas (,) and entered into the parameters exactly as displayed by your broker to ensure they are recognized in the dashboard. These symbols will be used for analysis by the indicator.
With one click open any pair any timeframe directly from dashboard The MA Speedometer Dashboard is a highly functional MetaTrader 4 (MT4) indicator designed to enhance trading strategies through dynamic market analysis. It offers robust features for identifying market trends, trading

The PERFECT TREND HIT creates BUY and SELL perfect trend arrow signals based on ADX EMA AND RSI And all filters inbuilt with accurate trend entries. Furthermore, the indicator and template display the trend direction, strength, and trade recommendation for independent price charts. ROCK WITH THE TREND Moreover, it shows the final trade recommendation to BUY or SELL with all filters and displays that information as arrow signals and pop up in the chart. The indicator works well for new and
O indicador RSI Pro Analyzer é uma ferramenta poderosa projetada para traders que buscam tomar decisões informadas em vários intervalos de tempo simultaneamente. Este indicador utiliza o RSI para fornecer sinais de sobrecompra, sobrevenda e tendência , facilitando a identificação de oportunidades de entrada no mercado. Sua principal vantagem é a facilidade de leitura graças aos códigos de cores claros e distintos para indicar as diferentes condições do mercado.
O indicador exibe valores RSI e

Com esta ferramenta de negociação, você pode analisar 15 mercados simultaneamente.
Apresentando o novo indicador de negociação 2024:
️ Dashboard Multi Moeda Multi Time Frame Double CCI.
Há pelo menos duas razões pelas quais criei esta ferramenta de negociação:
Primeiro, estou cansado de observar apenas um mercado. Segundo, não quero perder o momento de entrada em outro mercado.
É por isso que quero conhecer outras condições de mercado ao mesmo tempo.
Por esta razão, preciso de um s

缠中说禅在MT4的应用,该指标自动识别分型,划笔,划线段,显示笔中枢,线段中枢,也可以根据需求在参数中设置显示自己所需要的。 1.笔采用条件较为宽松的新笔。 2.当前分型与前面分型不能构成笔时,若与前面笔同向且创新高或新底时会延伸笔,若与前面笔异向且符合替换条件则去除倒数第一笔,直接倒数第二笔。 3.线段的终结第一类情况:缺口封闭,再次创新高或新底新低,则判为终结,同时破坏那一笔的右侧考虑特征序列包含。 4.线段终结的第二类情况,缺口未封闭,考虑后一段特征序列分型出现新的顶底分型,同时做了包含处理。 5.中枢必须有退出段才进行显示,中枢的进入段和退出段必须同向。 中枢的进入段起始点 ( 上下上结构的) 必须高于GG,或( 下上下结构的)必须 低于DD; 中枢的退出段结束点 (下上下结构的) 必须高于GG,或 (上下上结构的) 必须低于DD。
O Smart Volume Tracker é um indicador projetado para fornecer insights sobre o sentimento do mercado, apresentando visualmente dados de volume de lances e pedidos em uma janela dedicada. Esta ferramenta intuitiva ajuda os traders a identificar rapidamente onde se concentra a atividade de compra e venda, permitindo-lhes tomar decisões de negociação mais informadas.
Com o Smart Volume Tracker, você pode avaliar facilmente se o mercado está inclinado para uma tendência de alta ou de baixa. Ele m

Waddah Explosion Scanner Features : Waddah Trend, Explosion Increase/Decrease Trend Percentage with Threshold DeadZone Trend Direction Aligned Checks Highlight and Alerts Multi-Timeframe & Multi-Currency Detailed Product Description and Free Demo: https://abiroid.com/product/abiroid-waddah-scanner/
Customizable Threshold: With customizable threshold, you can identify best trading opportunities in volume-based trading. Use Trend Height (x times Explosion) : Trend height in relation to the exp

Direct translation of blackcat's L3 Banker Fund Flow Trend Oscillator. Get push notifications on your phone app when a signal bar has formed. Historical signals are shown with a red checkmark right on the main chart. Indicators uses two data calculations to check for a positive cross below 25% level. Long signals only! For any further questions feel free to contact me directly. Including requests for product improvements.
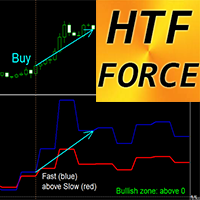
Indicador Forex Oscilador de Força HTF para MT4
HTF Force é um indicador poderoso para negociação Multi-Time Frame. HTF significa - Prazo Maior O índice de força é um dos principais indicadores que combina dados de preço e volume em um único valor Os valores do período máximo podem mostrar a direção da tendência (tendência de baixa - abaixo de 0; tendência de alta - acima de 0) Força Rápida - linha Azul, Força Lenta - linha Vermelha Sinal de compra - Linha rápida cruza Linha lenta para cima e
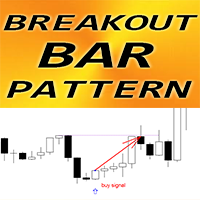
Indicador Forex "Padrão de barra de ruptura" para MT4
O indicador "Padrão Breakout Bar" é um indicador muito poderoso para negociação de Price Action: sem repintura, sem atrasos; O indicador detecta padrões de Breakout Bar no gráfico: Padrão de barra de quebra de alta - sinal de seta azul no gráfico (ver fotos) Padrão de barra de quebra de baixa - sinal de seta vermelha no gráfico (ver fotos) com alertas de PC, celular e e-mail O indicador "Padrão Breakout Bar" é excelente para combinar com N
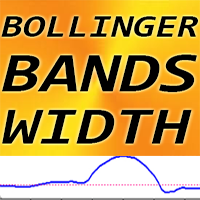
Largura das bandas de Bollinger do indicador Forex para MT4, sem repintura.
-O indicador BB Width é aplicável para uso em conjunto com o indicador Bollinger Bands padrão. -Este software é obrigatório para todos os fãs do indicador Bollinger Bands, porque sua combinação é muito eficiente para negociar Breakouts -O indicador BB Width mostra a distância (span) entre as Bandas de Bollinger.
COMO USAR a Largura BB (Veja o exemplo na imagem): 1) Encontre o menor valor de BB Width dos últimos 6 me
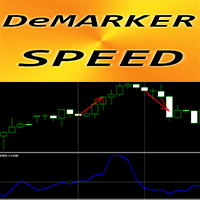
Indicador Forex "Velocidade DeMarker" para MT4
O cálculo deste indicador é baseado em equações da física. DeMarker Speed é a primeira derivada do próprio DeMarker A curva do oscilador DeMarker indica a posição atual do preço em relação às máximas e mínimas anteriores durante o período de cálculo do indicador A velocidade do DeMarker é boa para escalpelamento de entradas quando o oscilador DeMarker padrão está na zona OverSold/OverBought (como nas fotos) O indicador DeMarker Speed mostra a rap
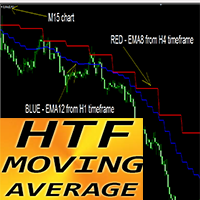
Indicador Forex HTF MOVING AVERAGE para MT4
Atualize seus métodos de negociação com o indicador HTF MA profissional para MT4. HTF significa - Prazo Maior Este indicador é excelente para Trend Traders com entradas de Price Action. O indicador HTF MA permite que você anexe a média móvel de um período de tempo superior ao seu gráfico atual. O indicador mostra a tendência de um período de tempo superior -> este é um método sempre lucrativo. O indicador HTF MA oferece oportunidade de obter grande
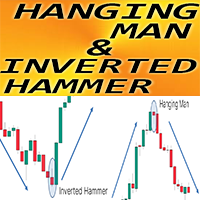
Indicador Forex "Padrão Homem Enforcado e Martelo Invertido" para MT4
O indicador "Padrão Hanging Man e Inverted Hammer" é um indicador muito poderoso para negociação de Price Action: Sem repintura, sem atrasos; O indicador detecta padrões de alta do Martelo Invertido e do Homem Enforcado de baixa no gráfico: Martelo Invertido de Alta - Sinal de seta azul no gráfico (ver fotos) Bearish Hangman - Sinal de seta vermelha no gráfico (ver fotos) Alertas de PC, celular e e-mail estão incluídos O in
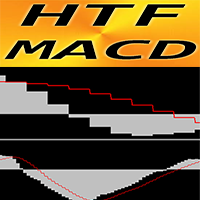
Indicador Forex Oscilador HTF MACD para MT4
HTF significa - Prazo Maior O próprio indicador MACD é um dos indicadores mais populares para negociação de tendências Este indicador é excelente para sistemas de negociação Multi-Time Frame com entradas de Price Action ou em combinação com outros indicadores. O indicador HTF MACD permite que você anexe o MACD de um período de tempo superior ao seu gráfico atual -> esta é uma abordagem de negociação profissional O indicador possui alertas integrados
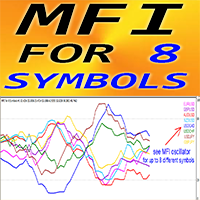
Indicador Forex "MFI para 8 símbolos" para MT4.
O Money Flow Index (MFI) é um oscilador técnico que utiliza dados de preços e volumes para identificar zonas de sobrevenda e sobrecompra. É ótimo obter entradas de venda de sobrecompra quando o IMF está acima de 80 e entradas de compra de sobrevenda quando está abaixo de 20. MFI é muito útil para detecção de divergências e também é ótimo para combinar com Price Action "MFI para 8 símbolos" dá a oportunidade de controlar valores de MFI de até 8 s

In a departure from the conventional approach, traders can leverage the bearish engulfing candlestick pattern as a buy signal for short-term mean reversion trades. Here's how this alternative strategy unfolds: The bearish engulfing pattern, (typically signaling a reversal of bullish momentum) , is interpreted differently in this context. Instead of viewing it as a precursor to further downward movement, we perceive it as an indication of a potential short-term bounce or mean reversion in prices.
FREE

The Tripl indicator is designed to visually display the current trend in the market. One of the key aspects of currency market analysis is identifying a trend, which is a stable direction in which prices are moving. For this purpose, the Tripl indicator uses calculations that smooth out sharp fluctuations that do not have a significant impact on the overall trend of price movements.
A trend can be either upward (bullish) or downward (bearish). Most often, a trend develops for a long time befo
Please feel free to contact me if you need any further information.
Please let me know if you have any questions.
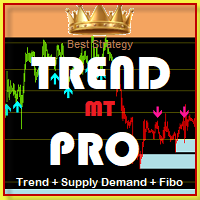
I hope the above is useful to you. MT Trend Pro: "Trade according to the trend and you will be a winner." There is Supply&Demand and Fibo to help set SL and TP.
TRADE: Forex
TIME FRAME: All Time Frame
SYMBOL PAIR: All Symbol
SETTINGS:
SIGNAL FOLLOW TREND: Input period (>1)
CANDLE MA FILTER TREND: Set MA to change the candle color and filter signals.
FIBO TREND:
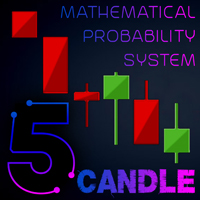
This trading system is based on mathematical probability. In this case, 5 consecutive candles are compared with each other. For a logical comparison, consider these 5 candles as 1 candle on the M5 timeframe. Therefore, the comparison begins with the opening of a candle on the M5 timeframe. The probability of a match is 50% in the 1st candle, 25% in the 2nd candle, 12.5% in the 3rd candle, 6.25% in the 4th candle, 3.125% in the 5th candle. Thus, the 5th candle has a probability of matching in 1

About Waddah Multimeter (free): This product is based on the WAExplosion Indicator. It helps identify explosive market trends and potential trading opportunities. Waddah Multi-meter (Multi-timeframe) Check out the detailed product post here: https://abiroid.com/product/simple-waddah-multimeter/
Features: Waddah Trend Direction Trend Strength (above/below explosion line or deadzone) Trend Explosion Alert Alignment alerts Multi-timeframe Custom currency Multi indicators on same chart (unique p
FREE
Dynamic Arc is a non-redrawing channel indicator based on the use of double smoothing moving averages. The difference between the Dynamic Arc indicator and other channel indicators such as Bollinger Band is that it uses double smoothed moving averages. This allows you to more accurately determine the direction of market movement, but makes the indicator less sensitive. However, thanks to double smoothing, it provides a clearer and more stable representation of channels on the chart, which helps

TrendExpert TrendExpert is a sophisticated MQL trading strategy indicator developed by TradeAdviser LLC. It combines advanced technical indicators and risk management principles to deliver consistent and profitable trading outcomes in the financial markets. This strategy is designed to be robust, adaptable, and suitable for various market conditions. Key Features: Utilizes Moving Averages (MA) for trend identification and confirmation. Implements Stop Loss (SL) mechanisms for effective risk man
FREE
Working with the Channel Motion Tracker indicator is as simple as possible. Just react to the arrows that the indicator displays. Each arrow represents an explicit command to action. The signals generated by this indicator are accurate enough to allow you to trade based on this information.
One of the main advantages of the indicator is its ability to build high-quality channels and generate signals for entering the market. This is great for the trader who always finds it difficult to choose

With the growth of information technology and the increasing number of participants in financial markets, traditional analysis tools are becoming less effective. Conventional technical indicators, such as the moving average or stochastic, in their pure form are unable to accurately determine the direction of the trend or its reversal. Is it possible to find an indicator that remains effective for 14 years without changing its parameters, and at the same time adapts to market changes? Yes, such
123456789101112131415161718192021222324252627282930313233343536373839404142434445464748495051525354555657585960616263646566676869707172737475767778798081828384858687888990919293949596979899100101102103104105106107108109110111112113114115116117118119120121122123124125126127128129130131132133134135136137
O Mercado MetaTrader oferece um local conveniente e seguro para comprar aplicativos para a plataforma MetaTrader. Faça download de versões de demonstração gratuitas de Expert Advisors e indicadores a partir do seu terminal para testes no Testador de Estratégia.
Teste os aplicativos em diferentes modos para monitoramento do desempenho e assim fazer um pagamento para o produto que você deseja, usando o sistema de pagamento MQL5.community.
Você está perdendo oportunidades de negociação:
- Aplicativos de negociação gratuitos
- 8 000+ sinais para cópia
- Notícias econômicas para análise dos mercados financeiros
Registro
Login
Se você não tem uma conta, por favor registre-se
Para login e uso do site MQL5.com, você deve ativar o uso de cookies.
Ative esta opção no seu navegador, caso contrário você não poderá fazer login.